
Well, here is little different opinion.
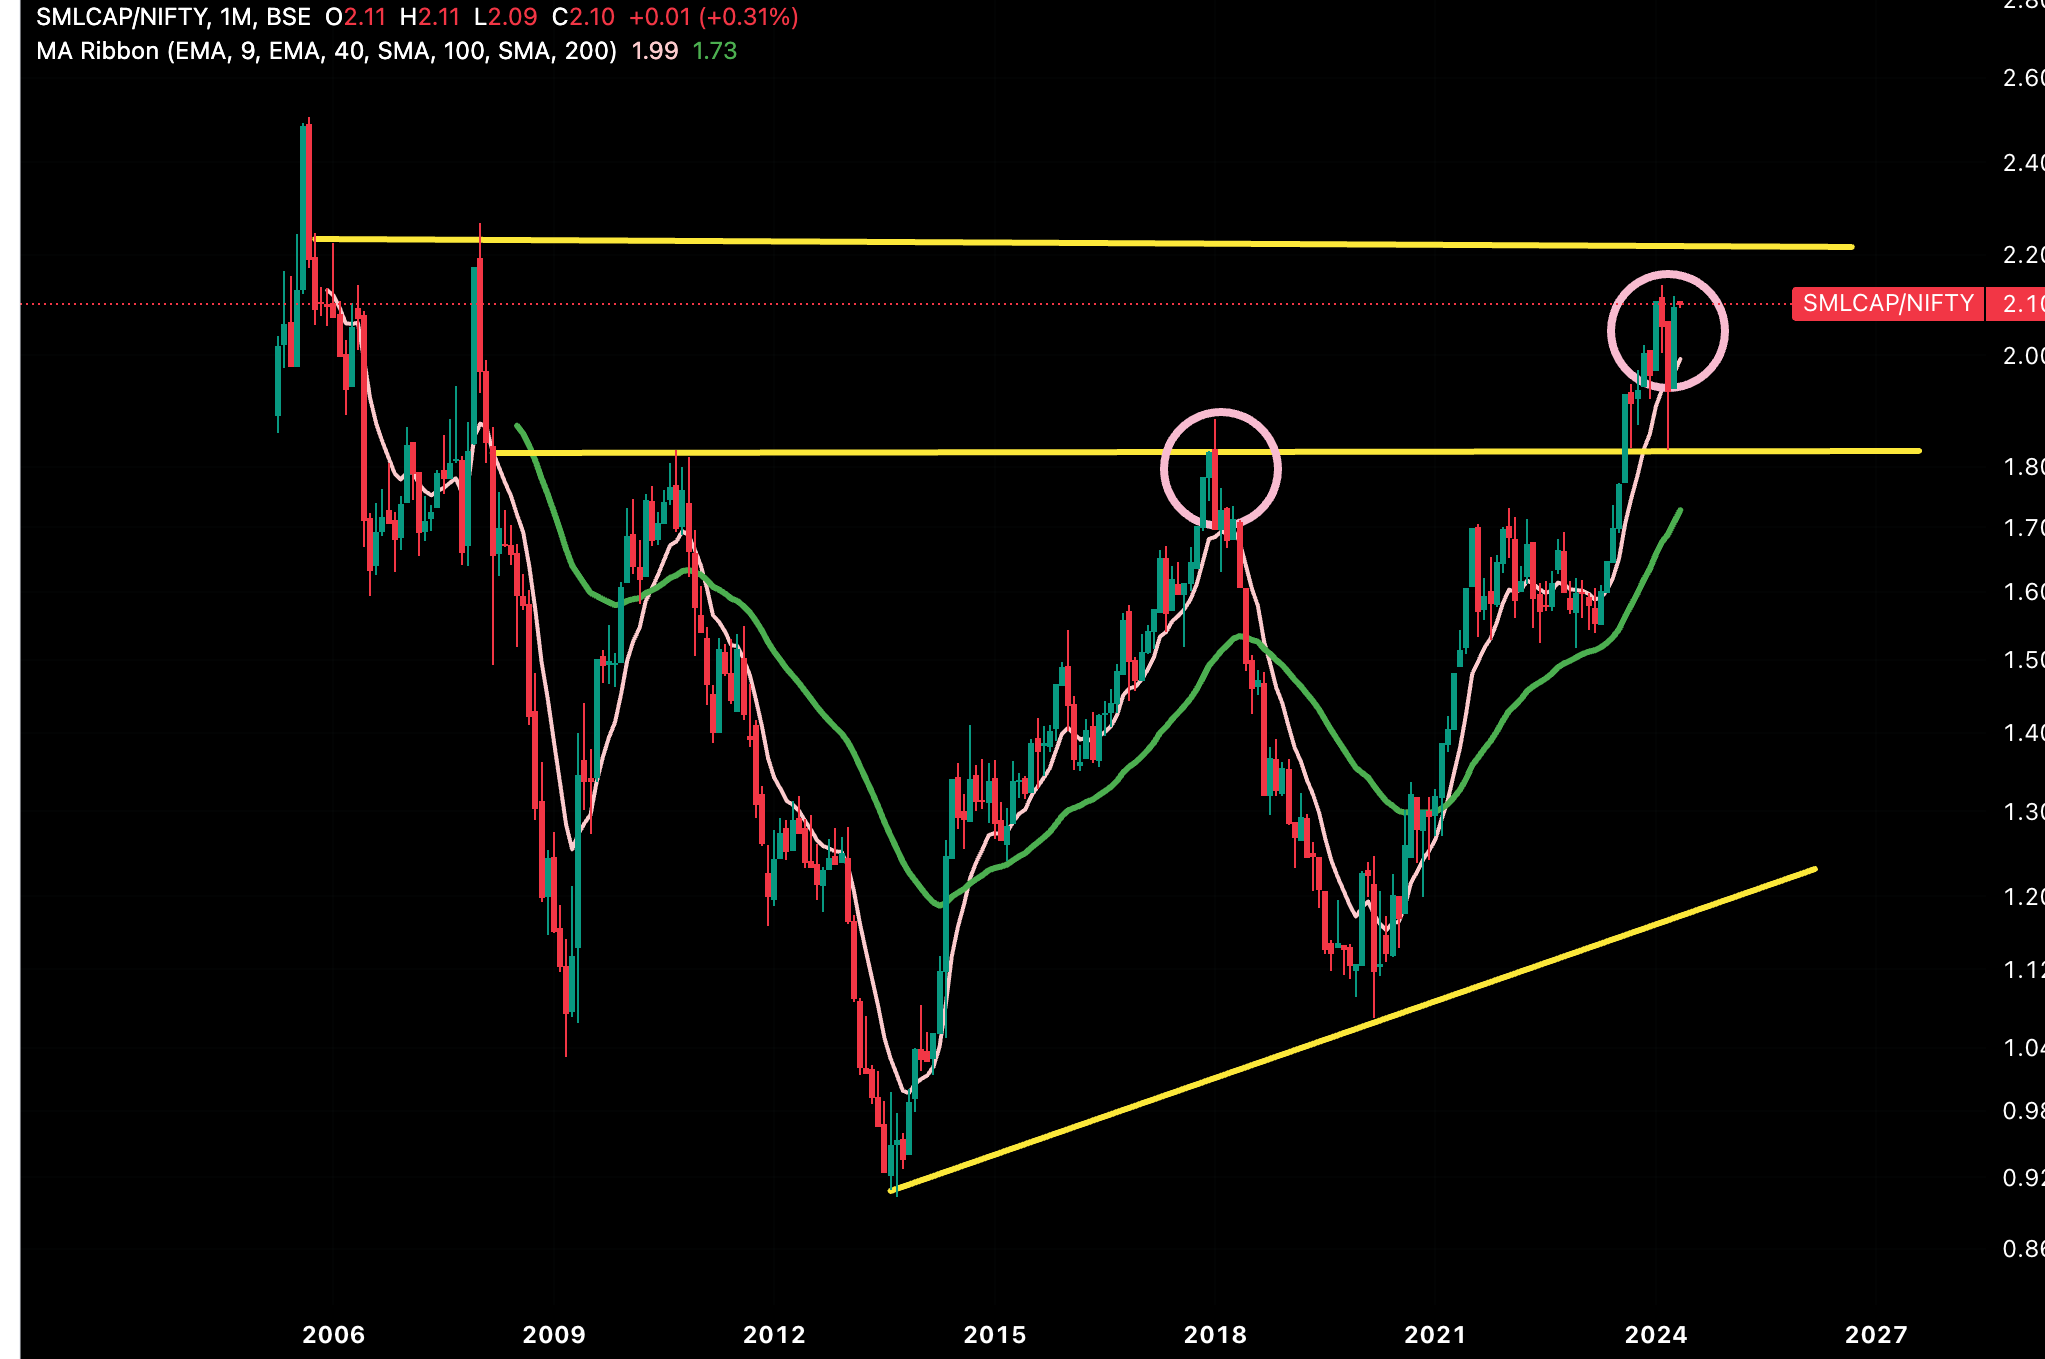
If the chart was published at March end, it might have given more conviction on bearish angle ( a big red candle) . But we got a good recovery in April ( a big green candle) . This shows that there’s still some strength and this also shows the difference between what happened in 2018 vs now ( pink circles). Hence would be bit cautious on taking any view , especially at current levels .
Yes , it is at crucial levels …may be May end candle can give some direction.
We’ve a positive bias as of now due to 4 key reasons :
a) Expected majority government , 3rd time in a row ,a rare event after 3 decades- we’re underestimating the monumental change in Indian politics and policy-making
b) Falling DXY and Brent oil at comfortable levels.
c) Easing QT in US thus more liquidity(Powell said that they would be selling lesser bonds now).
d) Strong domestic economy and expectations of good monsoon.
Yes ,the rally may not be widespread. Some froth from overvalued pockets may go away ( and that is already visible) . It might be stockpickers market here onwards.