
City Union Bank Ltd
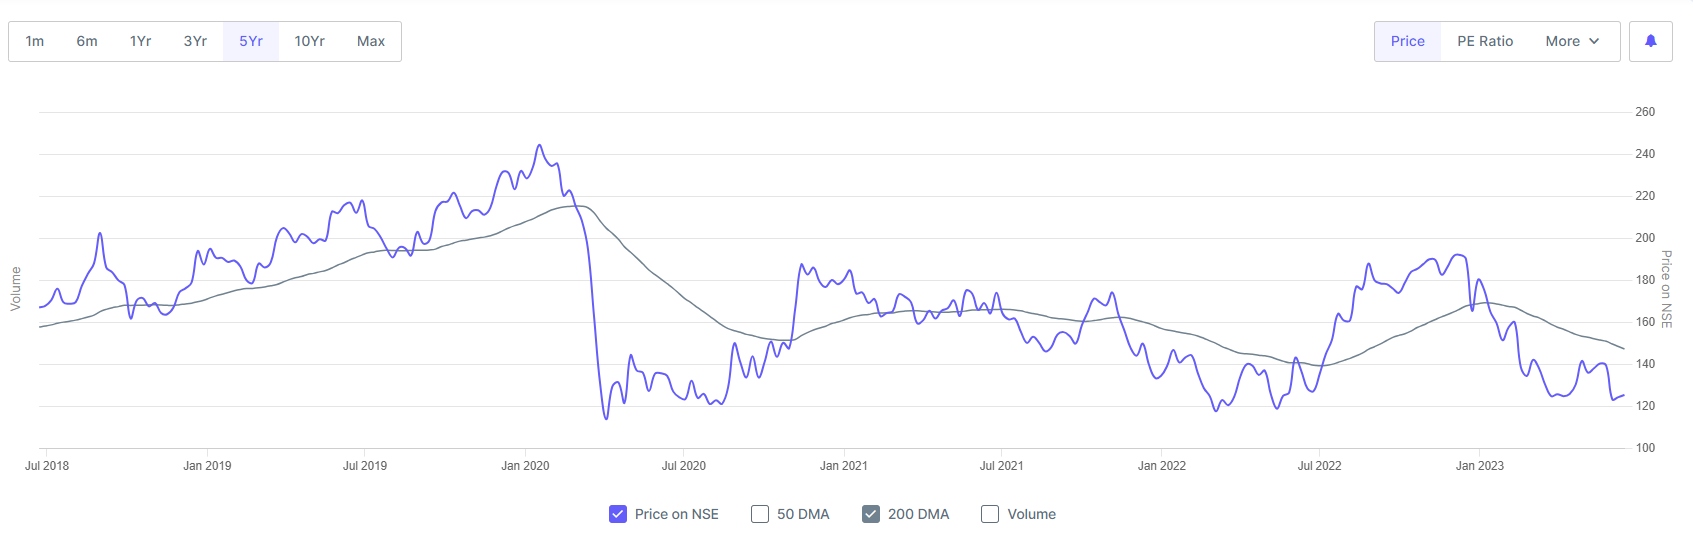
Price Chart: Ongoing base formation ~120, acting as a support for the last 3 Yrs.
PB Chart: Currently PB at ~1.3, last seen 10 Yrs. back. PB below this level was seen during GFC period (2008-09)

Why cheap? Per my understanding:
- Ongoing negative perception (Main Reason):
- RBI’s NPA divergence rap in Dec 2022. Not only requires more provision to improve the PCR but also seeds doubt about the book quality and NPA recognition process.
- Acknowledgement about lack of documentation related to interest subvention schemes, leading to stoppage of interest recognition
- Managements acknowledgment for growth headwinds in FY24:
- Overall NIM compression in FY24 and nil growth in H1FY24. Expected overall growth of 10%+ - H2 to do the heavy lifting using NPA recovery as the key driver.
- Still elevated level of Net NPA plus Restructured Assets (5%+ %)
Key Monitorable: Trend of NPA’s recovery and growth pace of H2FY24 to achieve overall growth of 10%+ in the Net Profits
Valuation: Cheap or will it become cheaper? Current valuation at 1.7Sigma below mean.
| PB | ||||||||||
|---|---|---|---|---|---|---|---|---|---|---|
| Max | 10 Yr | 5 Yr | 3 Yr | 1 Yr | Now | Mean | std. dev. | |||
| CITY UNION BANK LIMITED | 2.1 | 2.4 | 2.2 | 1.9 | 1.8 | 1.25 | 1.94 | 0.40 |
Downside: Already reached, I think, as at historic low on P/B chart | Only other low point on the PB chart belongs to GFC (2008-09) days
Upside Expectation: At least 70% in 1~2 Yrs
Shareholding pattern change: Dec2022 to Mar2023: Insurance companies sold 3% and MFs sold 0.5% | FPI bought 3.6%
Disclosure: Invested at current levels. Not a registered advisor and it’s not a recommendation. Shared to hear counterviews in particular. As I am often wrong in my conclusions, you better make decision as per your due diligence!!!