Bajaar.me : Create customized screeners

I have added a new Screener that allows customization. A few sample templates are included, like:

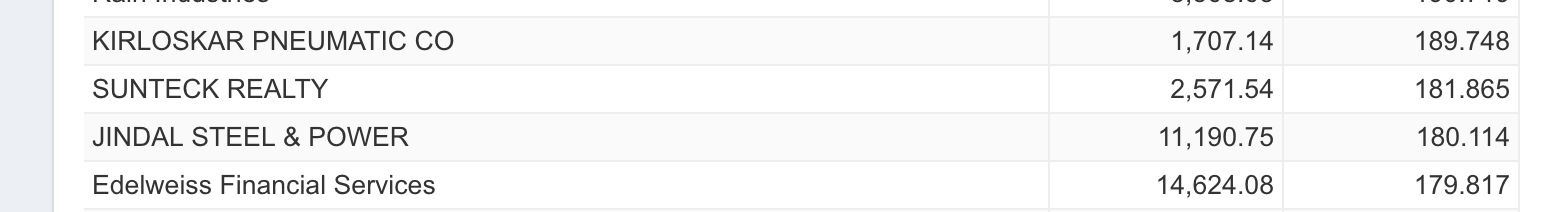
  • Find the top performers over a span of time.
  • Search stocks where promoters holding increased, or pledging changed.
  • Design technical indicators to give BUY/SELL signals, and search for stocks where your indicators are triggered. I added examples using SMA crossovers and RSI
  • Compare performance of stocks over multiple time periods. Eg - Stocks that have performed well in previous bull-markets compared to the current.
  • Use statistical properties over long pricing histories to indicate steady performers.

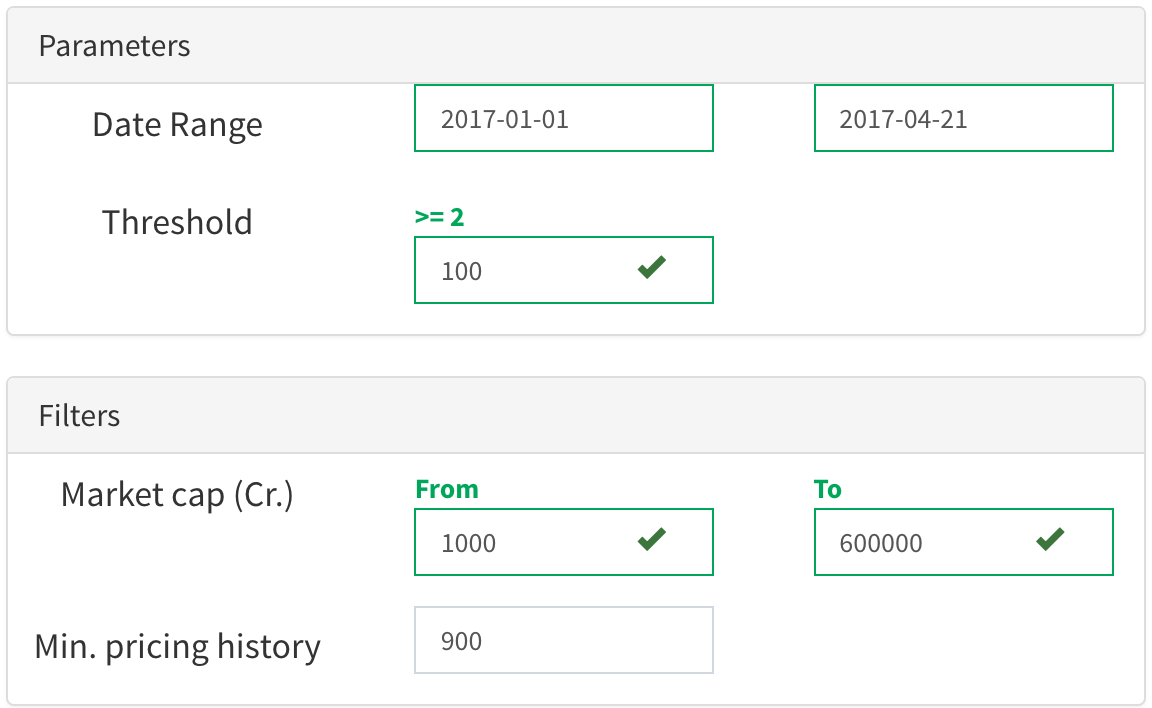
To create your own screener, click on the Advanced tab in the bottom left and it will open up an editor. The scripts are written in a programming language called Lua. I understand not everyone will be comfortable with it, but I hope it is simple enough for you to experiment with. Look forward to your feedback and suggestions.

20 Likes

@vml amazing site. Kudos.

@vml

I am trying to find out top performers as per the image attached above. The search returned the below image where I see Edelweiss and Spicejet at 179% and 163% returns. Where as both stocks gave around 100% return during the period. Please check.

@csteja : I used the the formula:

gain = recent_price/old_price * 100

instead of

gain = (recent_price - old_price)/old_price * 100

Maybe the second formula would have been more intuitive, but it does not change the ordering.

I liked your suggestion about Top performing sectors and its on a longer-term TODO list. I also want something like that, but it might take a few months to get working :frowning:

@vml, I tried

local gain = (price[#price]-price[1])/price[1] * 100

but found that price[#price] for spicejet is showing as ~96 instead of 105 (latest price).

Also, can you expose more > ticker methods/API for public like what screener did. Any language documentation library should help you here.

Prices are updated every Sunday. So latest price would be for last Friday (April 14th). If you check tomorrow afternoon, results would be upto date.

Regarding API documentation: For now I just provided enough examples, but I should eventually provide better documentation. It is an experimental feature and is likely to change a lot over the next few months, so I dont want to spend too much time on documenting it now.

1 Like

i visited the site. it’s amazing.
is it possible to create user’s own screen like we do in screener?

thanks

i mean, changes in date or filter is one thing. but, is it possible to add more filters/parameters through advance tab and then save it?

You can write your own customized query through the advanced tab, but no option for saving it on the website.

It’s a full-fledged programming language inside the editor, so it is possible to create some very sophisticated queries.

@vml first of all congratulations for this fantastic web…amazing things you can do with the web
can you explain how you draw logscale chart in backtesting page…what is the significance of the chart?
Also, how can I customize the range of the chart…for example I don’t want to see the chart for all the years but for a particular range of years…can I do that?

Logscale charts help me overcome a cognitive bias so that a price movement from 10 to 100 visually looks the same as a price movement from 100 to 1000. After all, it is relative gains/losses that are important and not the actual price itself. It also makes it easier to compare different stocks on their long term price movements.

To explain the code a bit, ticker refers to a table (like an Excel sheet) with three columns: date, price and quantity. So

    ticker:get(1)

will return the date column. Similarly, ticker:get(2) will get the price column, and ticker:get(3) the quantity.

You can add more columns to the table with

    ticker:add_column

The first two charts you see are always price and volume. Any other columns you add can either be plotted as separate charts, or be merged with an earlier chart - depending on how you call ticker:add_column. The third parameter to ticker:add_column is the chart number, where charts are numbered starting from 1.

Line 30 in the code

    ticker:add_column('LogScale', logval, 1)

adds the logscale column and merges it into the first plot (along with price). Same goes for line 35, where the Log SMA is added and merged with plot 1.

You could fiddle around with the code, for instance change that 1 to 3 on line 30 and click “Rerun” to get Logscale on a separate chart.

Regarding your question on customized ranges, I don’t have that right now for Backtest, but it is available under Screener with ticker:timeslice. Click on the advanced tab to view/edit the code.

The screener supports multiple timeslices, and your code will run against all stocks and report back to you. For instance, the “High trading volume” and “Waiting for history to repeat” screeners. I use Backtest to test out ideas on individual stocks, before running them on Screener.

How do i get the count of total companies meeting a specific criteria?
Basically i need a global variable called count. But this query appears to run for each row in DB.
Hence I am seeing count a 1.

Usecase:
I need count of companies with gain > 100% from data x to date y.

@csteja
Sorry but I dont support aggregate queries yet. Right now, like you mentioned the query runs once for every stock matching the filters.

There is a slightly roundabout way though:

local range = ticker:timeslice({ from = "2013-06-01",
                             to = "2016-06-01"})

local price = ticker:price(range)

local gain = (price[#price]/price[1] - 1) * 100

if gain > 100 then
    -- Use a global count variable
    if count == nil
    then
        count = 1
    else
        count = count + 1
    end
    ticker:message({ orderby=count })
end

The first row in the result will have the right count. Because count is increasing, and we just need the highest value - so I used orderby.

Hi Vimal
Is there any way to add additional feature like Greater than or less than 2 lack Public shareholding
@suru27 had written blog on same
Please check

Appears like top_perf in bajaar.me is not working, @vml
Guys, need a website which provides top gainers/losers given a time period. Any help?

@vinamrachaware : The screener currently tracks shareholding percentages for only the two most recent quarters. For example, Bajaar uses

local old_value = ticker:public_old()
local new_value = ticker:public_new()

You could use these features for your own custom screeners, if you don’t mind editing the code (Click the “Advanced” switch next to “Submit”).

@csteja : https://www.bajaar.me/screen/top_perf seems to work for me. Can you give an example that didn’t work? Prices are updated only once a week (Sunday morning), so there may be a lag.

Thanks for quick revert. Its working now. I saw only 4 irrelevant columns for market cap above 10k earlier.

-- Construct a time slice for a range of dates
local range = ticker:timeslice({ from = "2018-10-29",
                                 to = "2019-03-07"})

-- Extract price corresponding to range
local price = ticker:price(range)

-- 'price' refers to a column of numbers:
-- price[1] is the first,
-- price[2] is the second,
--  #price is the length of the column, so
--  price[#price] is the last element in the column

local gain = (price[#price]-price[1])/price[1] * 100

-- If the gain for this stock exceeds a threshold, report back
if gain > 20 then
    -- Sort output by relative gain
    ticker:message({ price1=price[1], price2=price[#price], marketcap = ticker:mcap(),
                     orderby = gain })
end

Guys, Is there a website to find top performing sectors given time period? Thanks

Indirectly yes, from https://www.bajaar.me/trends
Check market-cap by sector, click on a year and a new chart will open up below for that year. All charts are downloadable as CSV. Open them in an excel file and use monthly sector-wise data to calculate top performing sectors for your period of interest. Data goes all the way back to 2001.

@vml, I see only yearly data over there