I have tried to teach myself these connections a few times in my journey…but for some reason, never pursued it with diligence
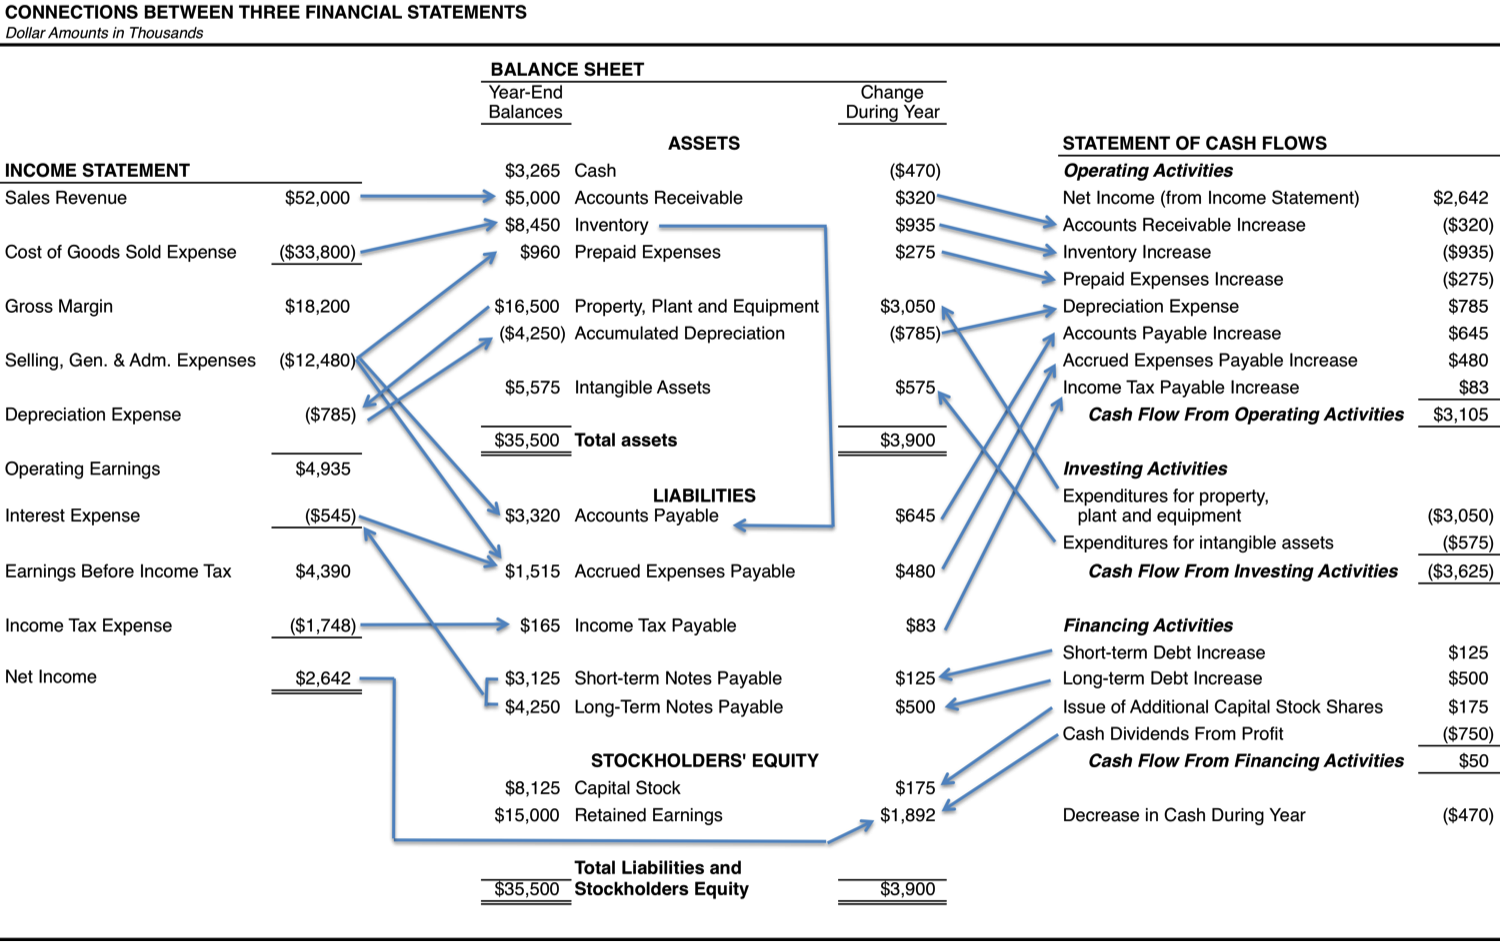
Perhaps I was waiting for the right teacher , and his brilliantly simple and powerful “picture-driven” way of transferring the same. Thought this will be very useful for both learners and practitioners as well. Excerpt from How to Read a Financial Report: Wringing Vital Signs Out of the Numbers: John Tracy
Question for our Accounting/Finance MBA, CFA, CA Experts on the forum. If you could explain it this way, wouldn’t it be the smartest way of transferring Journal Entries - and what is at the heart of reading the interconnections in a Financial Report??
Your comments will spur me on to deep-dive again into trying another attempt at what I thought was beyond me to fully grasp
When someone fudges Sales Data, he will have to adjust Trade Receivables and its related cash flow. putting it in forensic terms --> If Sales Growth is not getting converted into Cash Flow from Operating Activity, it would mean something is amiss.
Similarly one should always remeber that Accounts work on Double Entry. So you can fudge one data alone. Assuming Sales is Fudged --> It will flow into Balance Sheet Assets Side under Accounts Receivable --> So Assets side becomes higher --> Now to manage double entry --> You need to reduce some other figure in Asset Side --> Or increase some figure in Liability Side to bring both sides on par
@Donald
1)Blessing in Disguise :
Finolex Sales Growth 3 Year :4.57 %
Pat Growth 3 Year: 3.73%
Stock Return over 3 Year : 300%
2)Low single digit Sales Growth leads to less infusion of fresh money for running business (Working Capital-WC).
Low Sales Growth -->Less Additional Money For Inventory & Accounts Receivables(Debtors)
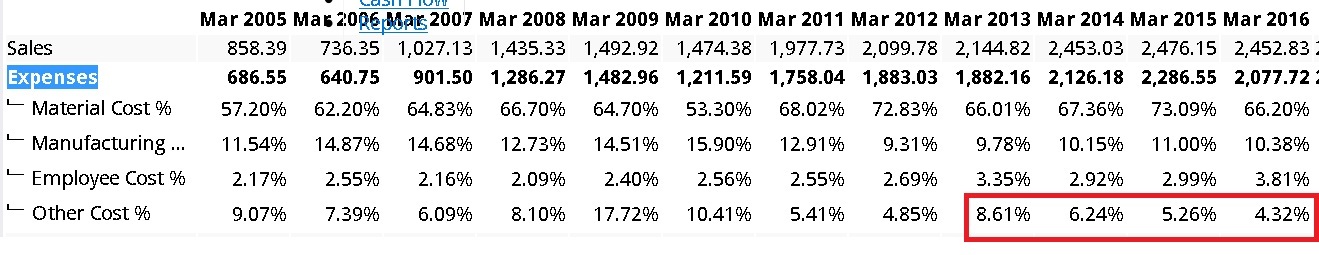
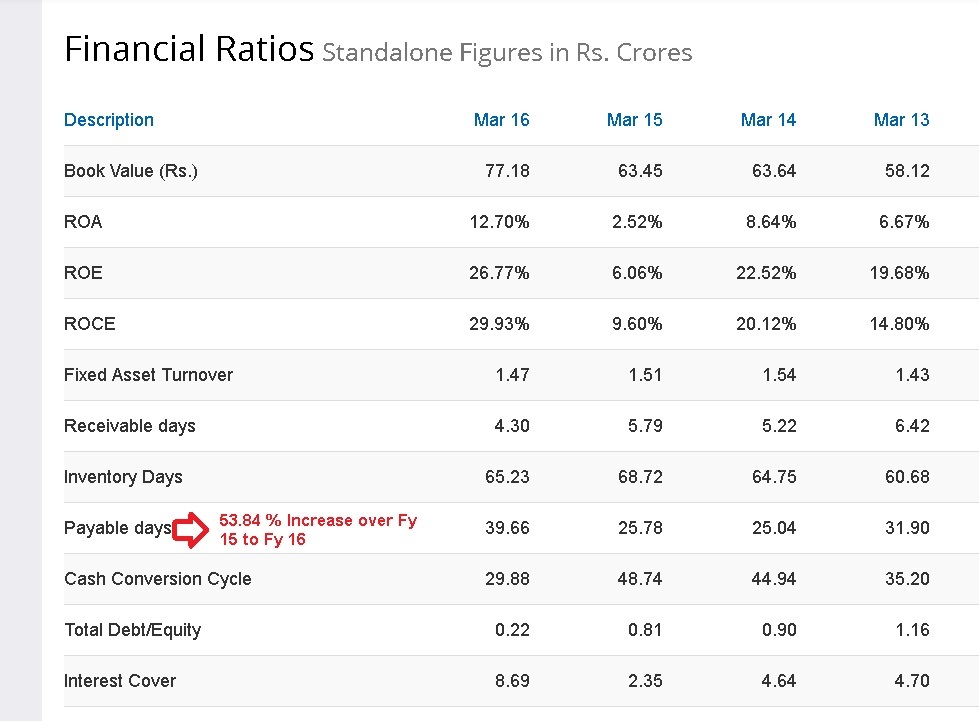
3) Increase in Payable Days results in reduction in Cash Conversion Cycle ---->Reduction in %( WC/Sales)
Increase in Payable Days–>Use of suppliers money for running business @ 0% Net Interest
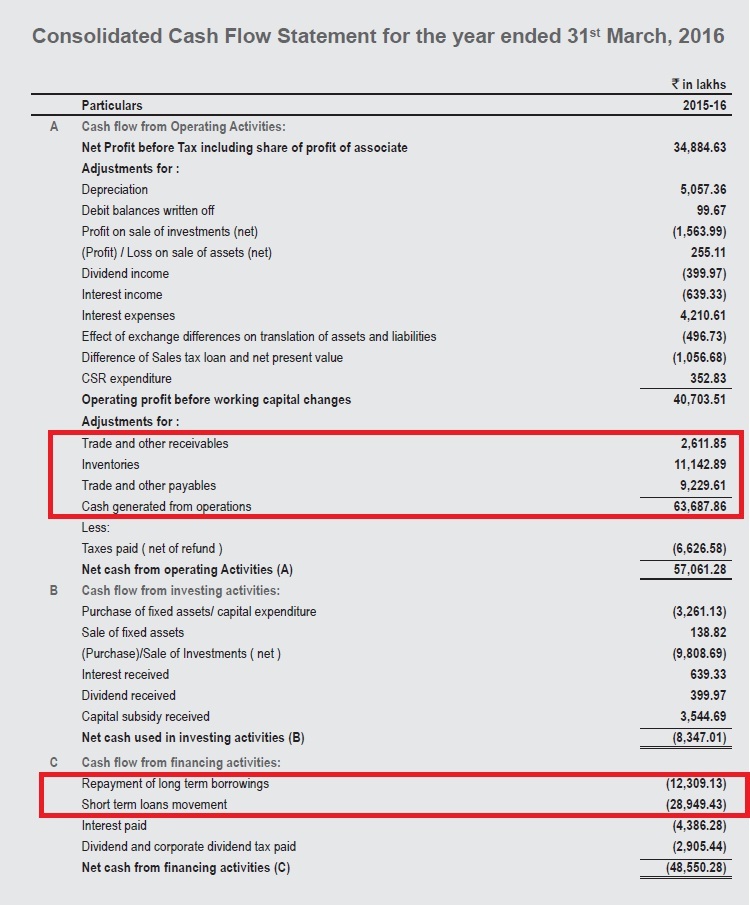
4)2 & 3 give boost to Operating Cash-flow
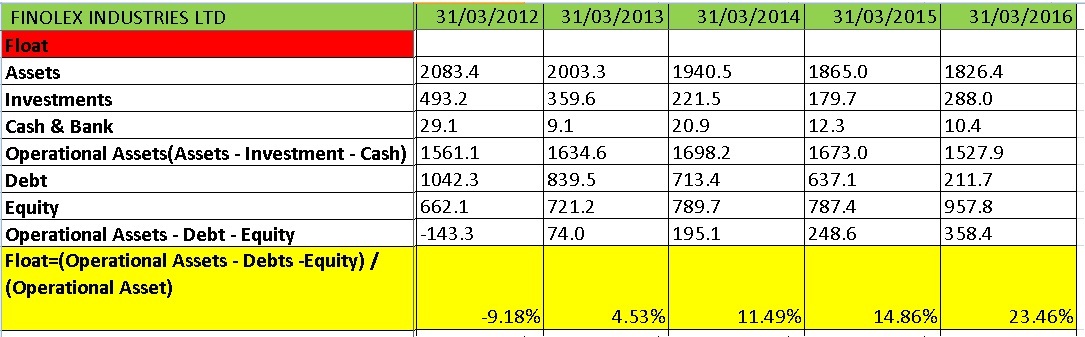
5)Boosted Operating Cash-flow used to deleverage balance sheet.
6)Reduction in Debt —>Lesser Interest Expenses ---->Increase in Net Income
I am surprised how decrease in inventory and increase in payable days both happened incase of Finolex. This couldn’t be related to image Donald put in, where if there is an increase in inventory → payables will increase.
“”"“Low single digit Sales Growth leads to less infusion of fresh money for running business (Working Capital-WC.”""""
Actually, I have big disconnect on point # 2. Thinking from any entrepreneur s POV, he will do whatever it take to break the stagnant top line. That whatever primarily will be compromising on DSO thus be in need of additional cash.
In isolation something else may be going on for Finolex, however, in general, difficult to decipher if stagnant sales can be blessings, in whatsoever manner.
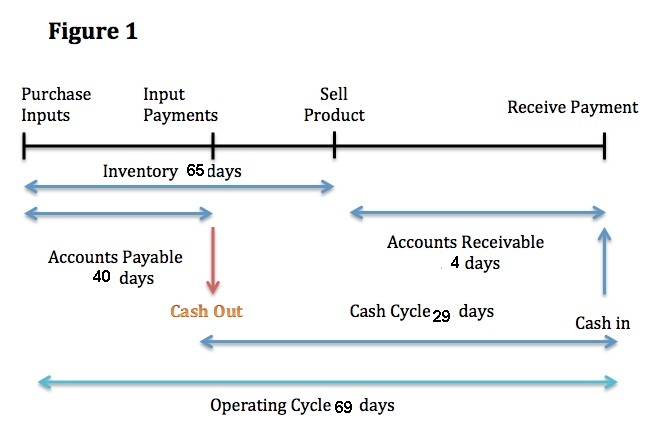
1)Cash Conversion Cycle : The cash conversion cycle is a metric used to gauge the effectiveness of a company’s management and, consequently, the overall health of that company. The calculation measures how fast a company can convert cash on hand into inventory and accounts payable, through sales and accounts receivable, and then back into cash. Eg Finolex Industry
2)Cash Conversion Cycle =Days Inventory Outstanding + Days Sales Outstanding - Days Payable Outstanding
If there is no change in Days Inventory Outstanding, Days Sales Outstanding & Days Payable Outstanding then increase in inventory --> payables will increase.
But if there is Increase in Days Payable Outstanding that will compensate for increase in inventory outstanding.
3)Days Inventory Outstanding : Average no of days inventory company hold their inventory (Raw Material , Work in Progress ,Finished Goods)
4)Days Sales Outstanding : Average number of days that a company takes to collect revenue after a sale has been made.
5) Days Payable Outstanding : Average number of days in which a company pays its suppliers.

 :
: