APL Apollo Tubes

APL Apollo q3 results look pretty good and was along anticipated lines as the company had provided volume growth numbers much ahead of the results and most of the market participants knew that it will deliver stellar numbers.

Key question remains where do we go from here. The company presentation is a good source about getting an idea about the company. Concall should provide further details.

q4 usually is the strongest quarter for the company and going by the trend company should be on course to report good numbers. The important thing for the company is the kind of market dominance it enjoys and the kind of growth numbers it has displayed in spite of adverse market conditions.

Presentation mentions the fact that company has enough capacity to grow at 20 % cagr going ahead. Debt has also reduced marginally. As @zygo23554 says the market reaction to these numbers should be interesting to watch over next few trading sessions. This company is well owned by institutions and I wont be surprised if some amount of positivity rubs on to the price.

I remain invested in the company with no transactions in last month.

14 Likes

Absolutely, numbers look rosy on YoY basis but still significantly lower than the peak EBITDA/tonne levels as seen from FY17 and FY18

image

Not so sure on the CapEx and high FCF yield. Going by the 20% volume growth projections they soon need to trigger fresh CapEx. Current capacity will not last beyond FY21 - assuming 85% as stable peak capacity utilization.

Disc: Invested in the company with no transactions in the last 3 months.

6 Likes

Summary of Q3 concall

• EBITDA / tonne – APL Apollo c. Rs 3150/tonne, Apollo Tricoat Rs 6050/tonne and average consol EBITDA Rs 3450/tonne. There was no inventory gain/loss in Q3 EBITDA as steel price in Sep’19 and Dec’19 end were similar.
• Apollo Tricoat did 0.48MT in Q3 against capacity of 2.5 lakh tonne (c. 77% capacity utilisation). Volumes should increase over next 1-2 years and EBITDA too (due to op leverage). Aim to reach 90-100% utilization over next 1-2 years.
• Q3 FY 20 volumes were good in Nov and Dec, October was weak. Expect Q4 volumes to be better, Jan has started on a good note.
• Long term guidance – double digit volume growth and superior EBITDA growth.
• Expenditure on branding/advertising – Rs 10 crs in Q2 FY 20, Rs 17 crs in Q3 FY 20, full year c. Rs 40-50 crs
• Existing capacity is sufficient atleast for next 12 months. Will decide on further capex depending upon volume uptick. Plan to keep capex at c. 25% of EBITDA.
• WC cycle c. 30 days
• Promoters have infused c. INR 170 crs through conversion of warrants in 9M FY 20 at share price ranging Rs 1800-2000/share
• Long term – Overall consumption of structural steel tubes in India as a % of overall steel consumption is low in India compared to developed countries, this should continue to increase going ahead.

9 Likes

I had attended the concall of APL. Some of the points I noted during the concall:
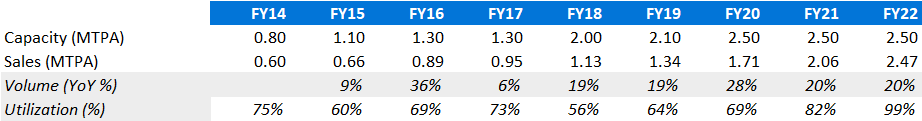
• Consolidated volume of 4.80 lakh during the quarter. Excluding Tricoat, growth is 38%. Restocking at dealer level and overall improvement in markets. On path of 20% volume growth during the year.
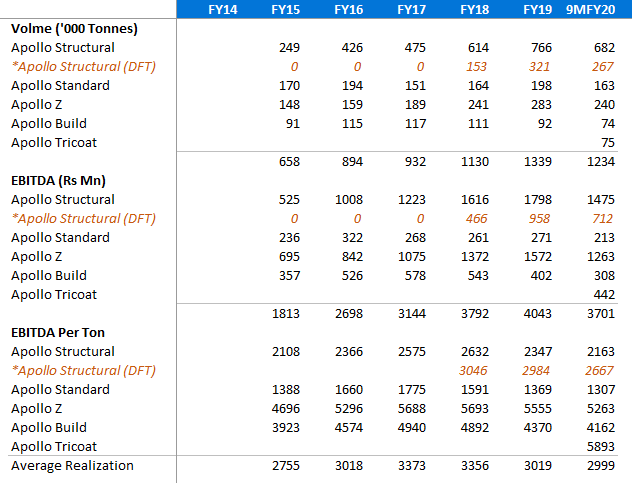
• EBITDA/tonne stood at 3,440. Planning to increase market premium and better product mix. Should report further volume growth.
• EBITDA in Q3 came at 165 crore.
• PAT performance is also better that we have moved to 25% tax level.
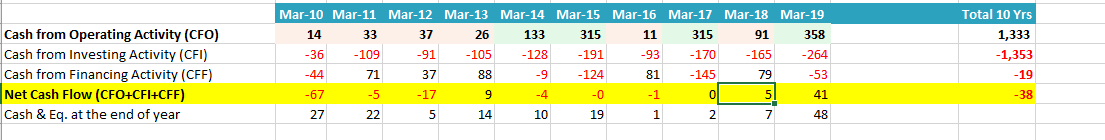
• On balance sheet front, reduced total debt by 100 crore during the quarter. On consolidated basis, D:E improved to 0.6 times as compared to 0.9 times.
• Improving market sentiment and increasing liquidity helped the company.
• Cash flow to improve driven by pick up in utilization. Company is also actively targeting 80 – 85% capacity utilization. Targeting steady improvement in product mix. Focusing on larger diameter hollow segment. Sector still has large demand on these segment. Company appointed PK Singh as an executive director.
• During the quarter, promoter completed 75 crore infusion in the com
• Demand environment seen healthy volume growth – Geography and industry wise? Sales volume break up 65% sold in building category and 35% is from infrastructure and industrial applications. Last 3 months, we have seen demand from housing, commercial and infrastructure. Focused on value added products which has grown higher. Taken market share away from other smaller players. Aspect of government growth which added to our quarter’s sales? Very limited sales from government. All trade channel sales.
• Distributors added? 800 distributors added. Do add new customers and consolidated them. Added 20 – 30 distributors in past 4 – 5 months.
• Ex tricoat – EBITDA/tonne is 3150. Tricoat – 6100 per tonne on consolidated basis.
• Did 48,000 MT in the quarter in Tricoat – total capacity is 250,000 MT.
• Did commercial paper issuance – what was yield to maturity? Issued at 6.60% per annum at mature at March end.
• EBITDA per tonne ex Tricoat is 3150 per tonne. How much of that has come from steel price increase? Steel prices as on 1 October compared to December 31 – no changes in prices. No inventory gain or loss for the quarter.
• Other expenses increased quite a bit, what is the issue? Passing on benefits through distribution rebates? Other expenses increased due to change in trade policy. We have changed to FOR basis, last quarter impact is there. Some branding increase is there. Compare with yoy – last year it was 1 crore, this quarter is 17 crore, last quarter it was 10 crore. Freight policy change – Now selling at gross level plus freight charges.
• Impact of rain disruption and lockdown on sales? Volume sales ramp up started from November onwards. Going forward we may have better volume growth in Q4 compared to Q3. Endeavor is to achieve better.
• Inventory valuation at quarter? Quarter ended December it was 1.5 lakh tonne. Stock got valued at base prices.
• Current prices are higher compared to December 31 rates.
• Product mix – GP, GI and Apollo Tricoat? October was like Q2. Only had 2 months in the quarter where demand had increased. 1.5 months since scenario has improved.
• Reduction in interest cost during the second half of the year. Not seeing that in Q3? What kind of debt levels are we seeing at March end. Debt levels – they have come off. What we look at March, 2020. Debt/EBITDA and interest coverage main ratios definitely improving. Both the ratios would improve further in March, 2020.
• There has been shifting of plant from Gazhiabad – consolidated basis have 10 plants running compared to 11 plants.
• Demand trend for Apollo Tricoat? Started in March, 2019. Working on seven portfolio. Being produced for the first time in India. Ramp up of these products is better than we thought. Chaukat, plank etc – 4 products have ramped up quite well. Channel partners and market have liked the product. Already running at 70 – 80% capacity utilization. Should launch 3 products. Next 2 year, take utilization levels upto 80 - 90% capacity utilization. Potential for the business? Dealer and customer feedback? One product Chaukhat producing 4000 MT per month. Replacement for wooden chaukat. Better price and termite free. In a small 2 BHK flat, there are atleast 7 – 8 doors, it can be a huge market. Only selling in North India currently, would expand further. Signature – designer pipes used in furniture currently.
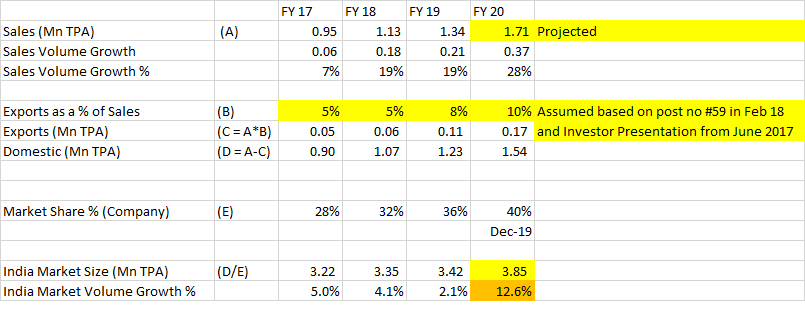
• 40% market share of APL, what is that? Market is structural steel market. India is 4 million tonne, we are doing 1.6 – 1.7 million tonne, so 40% market share. Run rate for growth for the company? Double digit volume growth and superior EBITDA/tonne is possible.
• Higher share of larger dia pipe contributed for growth. Yoy growth. Dia pipe is above 300 mm. It contributed 7 – 8% of our sales compared to 3 – 4% overall for the industry. Need to grow market – have to make architecuture, builders aware about it. EBITDA/tonne higher for it. EBITDA spreads are 2 times higher than what we get for blended basis.
• You have significant capacity yet to be utilized – capex going forward? Capex spend at 20 – 25% of EBITDA. Did 4.8 lakh tonne. Annualized run rate is 18 – 19 lakh tonne. Still 15 – 20% away from optimal utilization. If there is actual pull from the market, we can go ahead with capex.
• Capex front – not much capex. Debt levels will come down? FY20 – how it is panning out, despite capex and acquisition, we have been able to reduce debt. In simple words, capex intensity is low, debt levels should come down. Volume growth of double digit volume growth and superior EBITDA growth for FY21.
• Capex – Guided for 200 crore this year. What stage will we look at further expansion? Capex front – spent 80% of the total outlay, Q4 will be minimal. Capex guidance for FY21 and FY22? Still 12 – 15 months away from optimal capacity utilization. If there is pull in the market, we may have to think of capex. We have land parcel in Raipur which we have already bought. Capex for machines. Some capex for higher diameter tubes.
• January volumes? Tapered down from November, December levels? January ground level demand is still robut. It should continue for next 2 quarters.
• Advertisement and brand spending? Stick to 40 – 50 crore annual expenses in FY20. Getting good response to it. Spend similar amount or lower amount next year.
• Higher margin in Tricoat despite similar realization? Realization are higher in Tricoat leading to higher EBITDA. Apollo Zee and other products sold in entire India while in Tricoat primarily sold in North market.
• Decline in Apollo Standard volume? Share in product mix has declined during the quarter.
• Last year – scrap volume not shared? Not part of manufactured volume. That comes in other operating income. Its around 5% of manufactured volume.
• Current cash and bank balance? We have given debt figures in the presentation. Debt repayment is to the tune of 100 crore. Cash balance is high as of now? Cash is fully invested in working capital and capex. Not much difference between gross and net debt.
• Q4 paying 25% of PBT.
• DFT side – how are seeing panning out of DFT – where do we see it in next few years? Ramped up quite well, sharpness in edges. Customization possible. Started to charge premium for it. Will attract more premium going forward
• Next year guidance is superior EBITDA growth.
• Inventory loss or gain there is none? HRC prices, average price had been significantly lower during the quarter? Have we built higher inventory during the quarter? No inventory gain or loss in the quarter. Saw decline in 1500 per tonne in inventory while November and December were increase of 500 and 1000 per tonne.
• Price increase in January – passed onto consumer may be with time lag.
• Last year we had acquired couple of assets, like to like volume growth – 32% during Q3.
• Rise in steel prices, scrap prices remain low? Scrap prices move only in accordance with secondary steel prices. Recently, secondary steel prices have also moved up – scrap prices have moved up. Scrap prices change every day. It’s a very wide range of variance. Unorganized players loosing market share? Across the industry, working in our industry for sure.
• Brand costs would not be higher than this year next year. Know which category have performed well for us and want to focus on that.
• UP – saw great visibility for about company. Great visibility across roads and interior? It’s a nationwide campaign. We have done it everywhere. In certain areas, we have done more as per our strategy.
• Average inventory levels at distributor level? Normally, our dealers stock 15 – 20 days of its monthly sales. Any prices movement, they have just 5 – 7 days of inventory. If it reduced below that, it would cause problem to him. In price increase, they would be short of working capital. If price stabilizes, they would have to still keep atleast 15 days of inventory.
• Improvement in working capital, what is the reason for that? Collection has improved over the past one year. Channel financing is playing a role in that. Plus we are the largest player in the industry with 40% market share. Have been able to command better payment terms with our dealers. Better inventory and collection days led to improvement in working capital.
• Government receivables? Better payment terms? Don’t have any exposure directly to government agencies. Its normally in line with our receivable days with government contractors.
• Any plans to increase B2C share? Offering are increasing to more building product category? Don’t want to do it directly. But talking to distributors where they can start APL Apollo experience centers. First go through distributors.
• Globally, lot of steel players get into forward integration into steel pipe manufacturing? See similar trend in India? Globally, also pipe players are pure play steel tube players and not steel players. For a steel producer, who are doing 15,000 EBITDA/tonne kind of trend, they would like to be into higher value add products. Tata Steel, JSW and Bhushan are already there in steel tube. Haven’t heard of any other large player in the market. In fact, competition might help in expanding market. Structural steel is 4% of the overall steel market while globally its 10% so huge room for us.
• Improvement in EBITDA/tonne, what is contribution from DFT, logistic cost benefits etc – how much impact? Value added products have contributed to growth have higher margins.
• DFT plant at North and South. Logistic saving coming from Shankara? Neglegible. Doing 10,000 MT per month from Shankara – total capacity 200,000 MTPA.
• Large diameter is fastest growing segment in structural tubing industry. Globally it is 25 – 30% of structural tubing industry while it is at 5 % or even less than 5%. Growth opportunity there.
• Other expenses – what could be quarter run rate – 150 crore quarter run rate? Its linked to volumes. You will see that EBITDA growth is superior than volume growth.
• Royalty with Tricoat as same distributor is selling Tricoat product? What sort of Royalty payment we see there? Tricoat is APL Apollo’s baby. We are not talking about any such arrangement with Tricaot. Tricoat has 50 – 60% same distributors as APL Apollo. Majority of volume will be from APL’s distribution.
• Merger of Apollo Tricoat with APL Apollo for creating vale for APL’s minority investors? APL holds 51% stake in that. For future merger, cant comment now.
• Can we go above 100% capacity utilization? I think depending of size, SKUs, we can maximum operate at 90 – 95%. If we make just one product we can target 100% utilization but not with the wide product range we are making.
• CFO during 9M and H1 – 9M its 265 crore and H1 was 305 crore? It was on account of line by line merger of Tricoat. Any addition is negative for consolidated company. Slight decline in creditor days led to decline in CFO.
• Normal working capital is 30 days for the company.
• No comments on the merger of APL and Tricoat.

18 Likes

Playing devil’s advocate.My thoughts on why a naive investor shouldn’t invest:

  1. Cyclical business as all the steel companies are. EBIT margin/NPM of 6%/3% doesn’t provide much room for steel price fluctuation. 1-2 month lag in pricing can play havoc, as we have seen in the past few quarters
  2. Capital intensive business. Cumulative free cash flow over last 10 years is less than even the dividend amount paid during the same period. You guessed it right, excess dividend comes from debt/issuing promoter warrants from time to time.Reason why absolute debt amount has increased over the last 10 years
  3. KMP which includes entire family clan treats itself with a hefty pay package, collects rent as landlord and tops it up with promoter warrants from time to time. Just look at related party transactions section, you will get to know what I am talking about
  4. Current Valuation in terms of PE is 33% more than the historical 10 year PE average

Disc: Had bought a small chunk for my portfolio way back as a naive investor, looking forward to exiting the script

8 Likes
  1. 1-2 month lag is actually quite good. The track record of EBITDA margin fluctuating between 7-10% for most of the last decade should be more than comforting

  2. It is capital intensive like most manufacturing businesses. The way to judge this business will be growth in sales (which has been 30% over 10 years), ROCE (mostly above 20%), how capex was funded (mostly from internal accruals and some debt. most of the debt is working capital loan). Despite this, they have continuously paid out dividends. The combination of high growth and high ROCE is what you want in a company.

  3. Promoters are increasing their stake. Warrants are being used to do this. As long as salary is below permissible limits and rent is at arms length pricing, nothing wrong with it

  4. Don’t forget to account for operating leverage.

Disc: Invested and very bullish

5 Likes

Here are my thoughts

  1. Even ebitda margin of 7-10% is very low relative to investible universe. Also, ebit is a more relevant measure especially for manufacturing companies as depreciation represents a valid business expense.
  2. It is actually debt which is funding dividend which is my problem. I believe warrants are a way to siphon off wealth. If the promoters are really bullish, they can buy back from the market. Minority shareholders are not benefitted through such an arrangement.
  3. ~8% of net profits paid to Gupta clan in fy19 doesn’t do justice to minority shareholders and with a family member as CFO, rent paid to family members raises integral questions
  4. Operating leverage can hit you in case of a downturn also like we saw last fiscal

However, I accept that every investor has a unique viewpoint and ideology. This script has created a lot of wealth for those who had the conviction to hold. Unfortunately, I don’t have that kind of conviction now after seeing its performance during the last fiscal

1 Like

As per this table, I do not see any cash flow problem at all in the recent past.
Source Screener - using Dr Vijay’s excel sheet.

Costco doesn’t make any money on the products it sells, its margins are so low. Yet it is legendary company. It make money from membership fees. All operations cost is managed by high inventory turn even when margins are wafer thin. Looking at EBITDA margin alone does not makes sense.

1 Like

From the IPO prospectus of Zekelman - a steel manufacturer in the US whose largest business is structural steel under the Atlast brand (50% of revenue):

“Similarly, we believe that specific trends within certain segments of construction are indicative of broader positive market conditions, particularly as it relates to HSS consumption. For example, we believe secular changes in building design and construction, in particular trends toward larger and taller buildings, are also driving HSS demand growth. This shift is underpinned by a number of factors, including re-urbanization trends, the need for larger and taller warehouses to support ecommerce, and large data centers to support enhanced connectivity and data processing and storage needs. We believe that demand for products using HSS will continue to remain strong for the foreseeable future, and we believe our portfolio of highly efficient structural mills, which feature quick change capabilities, are well positioned to capitalize on this market strength through specific optimization initiatives described in further detail below.”

There are very similar trends at play in the non-residential construction market in India

“Based on data from Dodge Data & Analytics, from 2010 to 2017 starts for non-residential construction and residential buildings with greater than four stories has grown at an average annual rate of approximately 10% in the U.S., and currently totals nearly 1.5 billion square feet”

This is a very interesting proxy for upcoming structural steel demand that they track.

If we can find a similar proxy for the India construction market, it could provide great insights into the longevity of growth for APL Apollo. I believe that the phenomenal volume growth delivered in the last 3-4 years is a consequence of a massive number of residential project starts between 2012 and 2016. However, in the last 3 years, there have been very few new launches which may result in volume degrowth for structural steel requirements in the next few years from the residential segment.

Volumes for APL Apollo are currently equally distributed between residential, non-residential and infra. Can the increase in non-residential construction/infra compensate for the possible de-growth in residential.

This is probably the biggest risk to be addressed for APL Apollo.

Disc: Invested.

9 Likes

Hello everyone

Had a couple of questions regarding market share. Would we grateful if anyone can help.

  1. In Q4 FY19 Investor presentation - the Company mentions its market share as 18% (200 bps increase YoY)

https://www.aplapollo.com/wp-content/uploads/2019/05/APL-Apollo-Q4-FY19-Earnings-Presentation.pdf

Whereas in Q3 FY 20 Investor Presentation Market share for FY 19 has been restated at 36%. Even earlier years market share has been restated in the presentation.

https://www.aplapollo.com/wp-content/uploads/2020/02/Earnings-Presentation.pdf

Q - Why has the Market Share % changed ?

  1. Based on the new Market Share numbers, in FY 20, assuming 40% market share for the full year - I have reverse calculated Indian Market Volume growth.
    For FY 20, it seems Indian Market Volume as grown by ~ 12% which is far higher than previous years. With the background of reduced overall construction activity, is this number a one off? Is it due to higher Inventory stocking at dealer level?

Thanks in advance.

I agree you can use composite indicators. Costco or Bj’s have stable margins though

In the midst of all this carnage, here is an observation -

The stock is now available at the same multiple it was when I had first started buying this around mid 2014. Over the period from 2014 till date business has tangibly changed in terms of scale, quality, sustainability and corporate governance.

Draw your own inferences, the data is out there for everyone to see

Disclaimer: The above is just an observation and nothing more. I am invested but that should not mean anything to anyone

9 Likes

@zygo23554

I wish to buy this stock in between 5 to 8 PE. Its EPS is steadily increasing, and will continue to do so as this company’s growth is closely tied to the country’s Infrastructural growth.

What would think about?

Releasing good press note and simultaneously silently disposal of shares (~7000) by director and relatives) .
This shows that next Qtr will not be good and promoters want to cash out profit !

2 Likes

As per their press release, volume is down to 400K Tons in Q4 from 480K tons in Q3. If i am right, promoters have bought 35,000 shares worth Rs. 3.6 crores last week.

Hi MuraliKS,
Can you please share data/cite source?

I do see some sell-off

https://www.screener.in/insiders/details/40802/
https://www.screener.in/insiders/details/40801/

If you see history of promoters - they buy before next Qtr result with possible good Qtr and sell before next Qtr result wth possible bad Qtr. why so many buy and sell by promoters? Are they doing trading of their stocks more than trading of their products!! Raise doubts!
When promoters more engaged in buying and selling their company stocks, they are more focused on market pleasing news than their products!

2 Likes

Prices of HRC coils after touching high of 3800 in Jan have now cooled off to arnd levels of 3150. The avg for the quarter works out to be around 3500. April prices are around 3150 and looks like will be under pressure considering the demand and steel prices. The company like the third quarter of fiscal 19 is bound to bear inventory losses as well as margin pressure. If the correct uncertain scenarios carries on and has second order effects extrapolating into sluggish demand for next two quarters coupled with volatile steel prices , then things will remain difficult for the company.
2. The only silver lining for the company will be that the competition though small might find it even difficult to survive and this might lead to market share gain.
3. If we take third quarter of the fiscal 19 as given for next two quarters of fiscal 21, then the h1 net profit for the company may not be more than 30-40 Cr( please correct me with my calculations here) and next six months at best may give another 60 Cr( on a conservative basis).
4. So for the current year the company may give a np in the range of 80 Cr - 120 Cr ( broadly ) giving it a multiple of 10/15/20 gives us target of 10 pe ( 800 cr-1200cr). 15 pe ( 1200cr- 1800cr) and 20 pe
( 1600cr- 2400cr).
5. The current mcap of the company is around 3000 Cr and hence looks overvalued. Any price correction below 900 might make this story attractive.
Please do correct me incase I am grossly out in my calculations or assumption ( tangible and intangible both)
Regards
Divyansh

3 Likes

Hi Onlish2014,

I was checking the promoter buying/selling on bse and did find the share acquisition is way more than disposal. I am sharing the image of the transaction for Jan-Mar Quarter.

1 Like