
Hello @vml
Welcome back and hats off to you along with Pratyush to upgrade VP.
As i recall you had used R to do the data-prep/transform and eventually visualize it through Shiny for stockscope.
I am still reading up, but i would like to take this excellent tool forward and develop it further.
For instance, as all the FY15 AR updates come in, i could help to update the dataset.
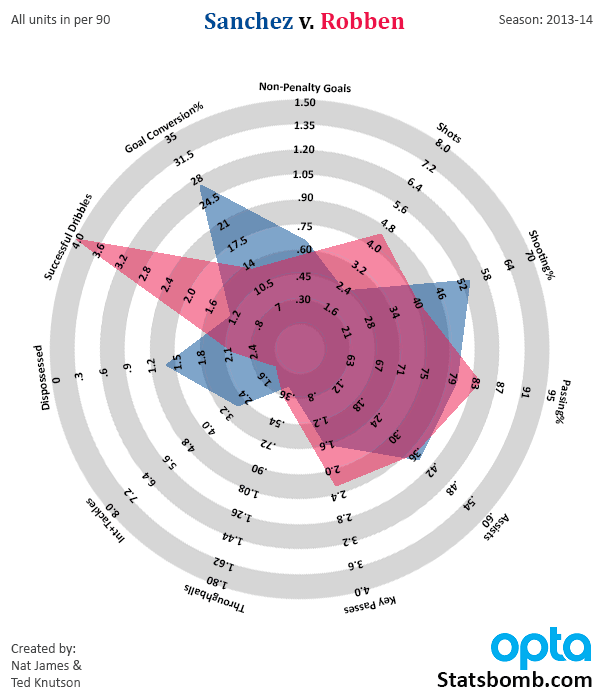
We could calculate the 10-yr averages of certain ratios like RoIC, EPA, D/E, OPM, Asset Turnover, etc… and visualize it as a Radar. Similar to the statsbomb radars for soccer players.
This would also give a much robust comparison between co.s
Let me know what you think!