
Interesting(Bucklandâs) theory below that has considered few more parameters(see Fig 14) in analyzing at what stage of Bull/Bear market we could potentially be riding in currently. Though the theory is closely linked to US markets, since Indian markets are coupled to developed markets, I think the analysis can be applied to indian markets noticing that PB-DY criteria worked there as well at the end of phase-3.
CITI: The Economy Has Entered Its Scary 'Phase 3' Where Bubbles Form Prior To A Crash
Thanks for the link. Buckland’s theory is obviously far more sophisticated, but it led me to think more into the nature of coupling between the two markets. Since FII’s hold such a large share of indian stocks, we are vulnerable like we saw last year.With Indian markets, I might need to combine both global and local interest rate trends for a more accurate model.
What would be the consequences of US tending towards higher interest rates, while ours are heading lower?
To visualize data in a more fun way, I have put it up as an interactive plot athttps://bhejafry.shinyapps.io/cluster_viz/
You can zoom in and out of the plot, and hover over individual stocks 
Superb job Random Walker…Appreciate your hard work
Aksh
Thanks! The site may be a little slow because I am using a free hosting option, and it cant handle too many concurrent users.
Added another tool
https://bhejafry.shinyapps.io/stockscope/
to compare individual stocks, with an option for log-returns. I limited to 3 stocks at a time to limit the load on the server. I have found comparing stocks on log-returns (over long periods) to be very educational.
1 Like
Splendid work. Thank you for sharing…
Sanjay
I started reading Pat Dorsey’s book (Five Rules for Successful Stock Investing) and am implementing the ratios/analysis in parallel. I have updated the stockscope tool (https://bhejafry.shinyapps.io/stockscope/). This way I can see what these numbers are for some of the companies that I am interested in, and improve my understanding of financial analysis. Some insights so far:
- Plots are easier to interpret than numbers, and so I plotted all ratios as graphs. This shows how these ratios varied over the years. Patterns show up more clearly.
- Du-Pont analysis works out very well on a Log-graph. For instance,** ROA = OPM*Asset Turnover**. So log ROA = log OPM + log AssetTurnover. Now it is just a sum of two numbers and shows up well as a stacked graph.
I foundhttps://www.khanacademy.org an excellent resource for someone without a financial background. Its not everyday you get to learn from a Harvard Business School graduate. And the content is arranged as a sequence of short videos - covering balance sheets, investments in stocks and bonds, macroeconomics etc. The math courses are also pretty good.
Had been busy for the last few months. So anyway, uploaded a new tool Marketview. You can lookup portfolios of investors holding more than 1% stake in a company, or do a company-wise lookup for large investors. While the raw data fetched from BSE has a lot of typos, I use some tricks to fix and merge them. So if you dont find the investor you are looking for, they are probably listed under another alias. Some investors also use investment firms, and you may not find them under their names. I think they do it on purpose - you wouldn’t believe the different ways to spell Morgan Stanley that I came across 
More interestingly (atleast for me), I did some number crunching on how these investors behaved. Who were the big fish? (Answer: LIC by far, followed by big Mutual and Sovereign funds). What stocks did they own the most? (ITC and ICICI).
Also took a trip down memory lane, on how much individual sectors contributed to the total market cap over the last 10 to 15 years. Got interested in studying past cycles. Added charts under the Notes section Blast from the past.
Disclosure: I don’t own any of the stocks mentioned in this post.
5 Likes
Thanks for these useful tools. Just wondering where do you get the data from?
This one fetches all data from the BSE website. I wrote some scripts which visit each stock’s page to extract industry/mcap/shareholding. Names of shareholder are available under details for each quarter, just scroll to the bottom to find the link.
BSEindia also provides stock quotes going back to 1998 adjusted for stock splits and bonuses (but not mergers/demergers).
@cool_aksh : If you are an Excel ninja, you should check out
- QuantsPartner. They have Excel sheets for almost everything under the sun. @crazymama was the first to point me to this great resource earlier in this thread.
- Also take a look at Stock Analyzer. It fetches financials from ValueResearchOnline and MorningStar. I haven’t tried out the tool, but they have a great goal - providing ordinary investors the tools to do their own analysis.
3 Likes
Thanks @vml. So you basically wrote scrappers to get data from BSE? Must be a very tedious job. I’ven’t ever tried it. It will be a lot easier if we can get data in some structured format and then we can write our own tools with various analytics. I’ll go through the links you suggested if I can get something useful there.
I think, @j2eeprofession_ also has written some of his own tools which he uses to get better insights. J2EE Professonal, can you please share the details of the tools that you have written and where do you get the data from the same? Thanks.
Hello @vml
Welcome back and hats off to you along with Pratyush to upgrade VP.
As i recall you had used R to do the data-prep/transform and eventually visualize it through Shiny for stockscope.
I am still reading up, but i would like to take this excellent tool forward and develop it further.
For instance, as all the FY15 AR updates come in, i could help to update the dataset.
We could calculate the 10-yr averages of certain ratios like RoIC, EPA, D/E, OPM, Asset Turnover, etc… and visualize it as a Radar. Similar to the statsbomb radars for soccer players.
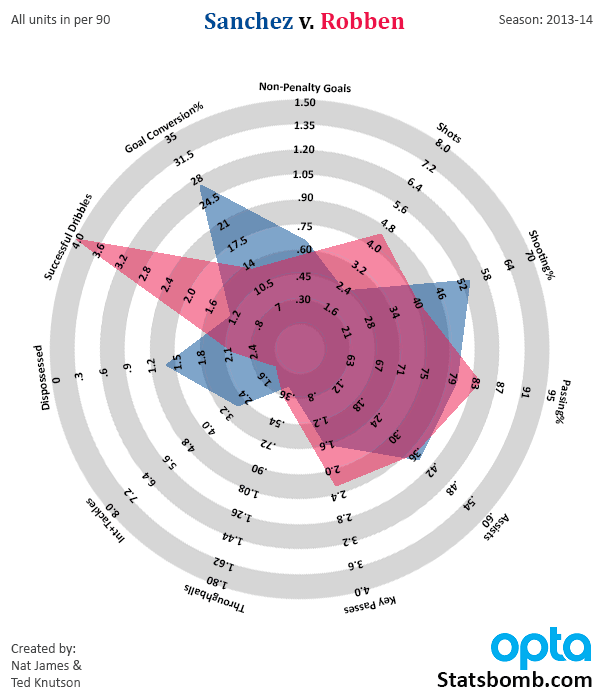
This would also give a much robust comparison between co.s
Let me know what you think!
2 Likes
@crazymama: Wow! That’s a great idea. I had totally forgotten about the Stockscope tool. Just revisited it now. So how it is currently designed is, I have some Python scripts that downloads the Excel files from QuantsPartner, and extracts the content into a database format. Then I use R and Shiny just for displaying it in an interactive format. Just figured out how to draw a radar chart, looks doable.
BTW, that is how the latest tool also works. I scrape BSE’s website using Python, and then display the charts using R/Shiny
@cool_aksh: The initial learning curve was steep, but scraping data is much easier now that most of the hard work is already done. Incremental changes are fairly easy now.
@cool_aksh and @vml - No i don’t scrape data from BSE. I do not think that’s required. As you all rightly pointed out its tedious and dangerous, because one upgrade on their UI, the scrapper would break and we’ll have to go back to the super tedious job of writing a scrapper. All the data is available on BSE in the form of csv files and we should take advantage of it. Basically i get the list of bse codes from BSE website (which is available in csv format), and download the historical data for those scripts - again in csv format and then put this data into a datastore that can then be used to create intelligence.
So added a Radar like we talked about yesterday to the Marketview tool. Looks much better than I expected. You can compare upto 5 stocks at a time, using any combination of upto 10 metrics. What it does not do well, is handle negative values (like negative W/C).
@j2eeprofession_ Ya I know about the bhavcopies and all the other CSVs. I used to do that for NSE’s website, but they don’t provide all the jucy bits of information. Changes to web-scraping are straightforward now, once you get used to it.
@crazymama: Saw your initiative for automating info on pharma companies. If you want to use Python for reading data, I can share some skeleton web-scraping code for you. Wish you all the best.
4 Likes
That was quick! 
You really have a great product in the making!
Get it IP’ed before it is too late!
I am using Google functions for scraping the data.
Basically the importHTML call.
I was more interested in the R/Shiny visualization part.
Anyways, i am tied up with work for next 2 months.
I will definitely come back to you on the Shiny bit…
The Pharma template is little time-consuming, as i need to validate the data and minimize the manual interventions.
I will post an update of my progress in the Shilpa Thread.
2 Likes
Turned out easier than I thought. The tools were already freely available.
R/Shiny is great fun for visualization. Though it was initially designed for statisticians, it is getting easier to use. Let me know when you start your journey - hopefully you can avoid some of the potholes I stumbled through.
I avoid Microsoft Office or Spreadsheets, so pretty much clueless in that area
1 Like