Markets are noisy. My head (my garage) is noisier. This space is my attempt to impose some order on both - working through ideas, connecting dots that may or may not connect, and sharing thoughts on anything and everything in the world of investing. No filters, no format. Just genuine curiosity. Expect thoughts on markets, businesses, macro, and the occasional rabbit hole I couldn’t resist going down.
Current Market Pulse
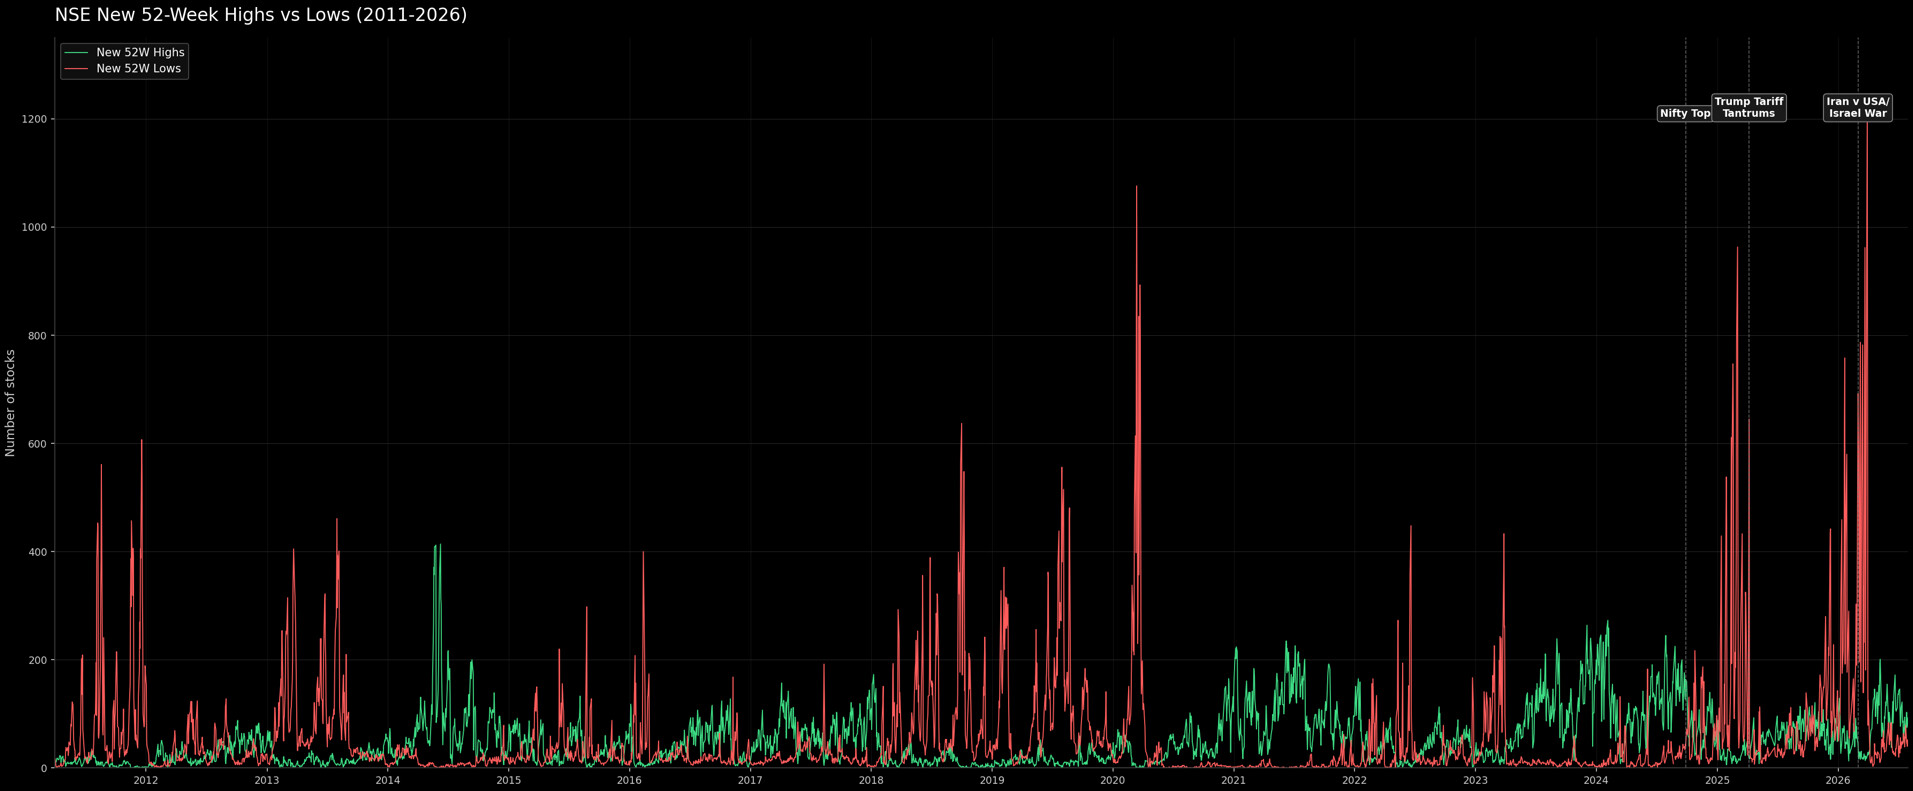
Markets don’t ring a bell at the top or the bottom. But they do leave clues — and one of the cleanest clues is the daily tally of stocks printing new 52-week highs versus new 52-week lows.
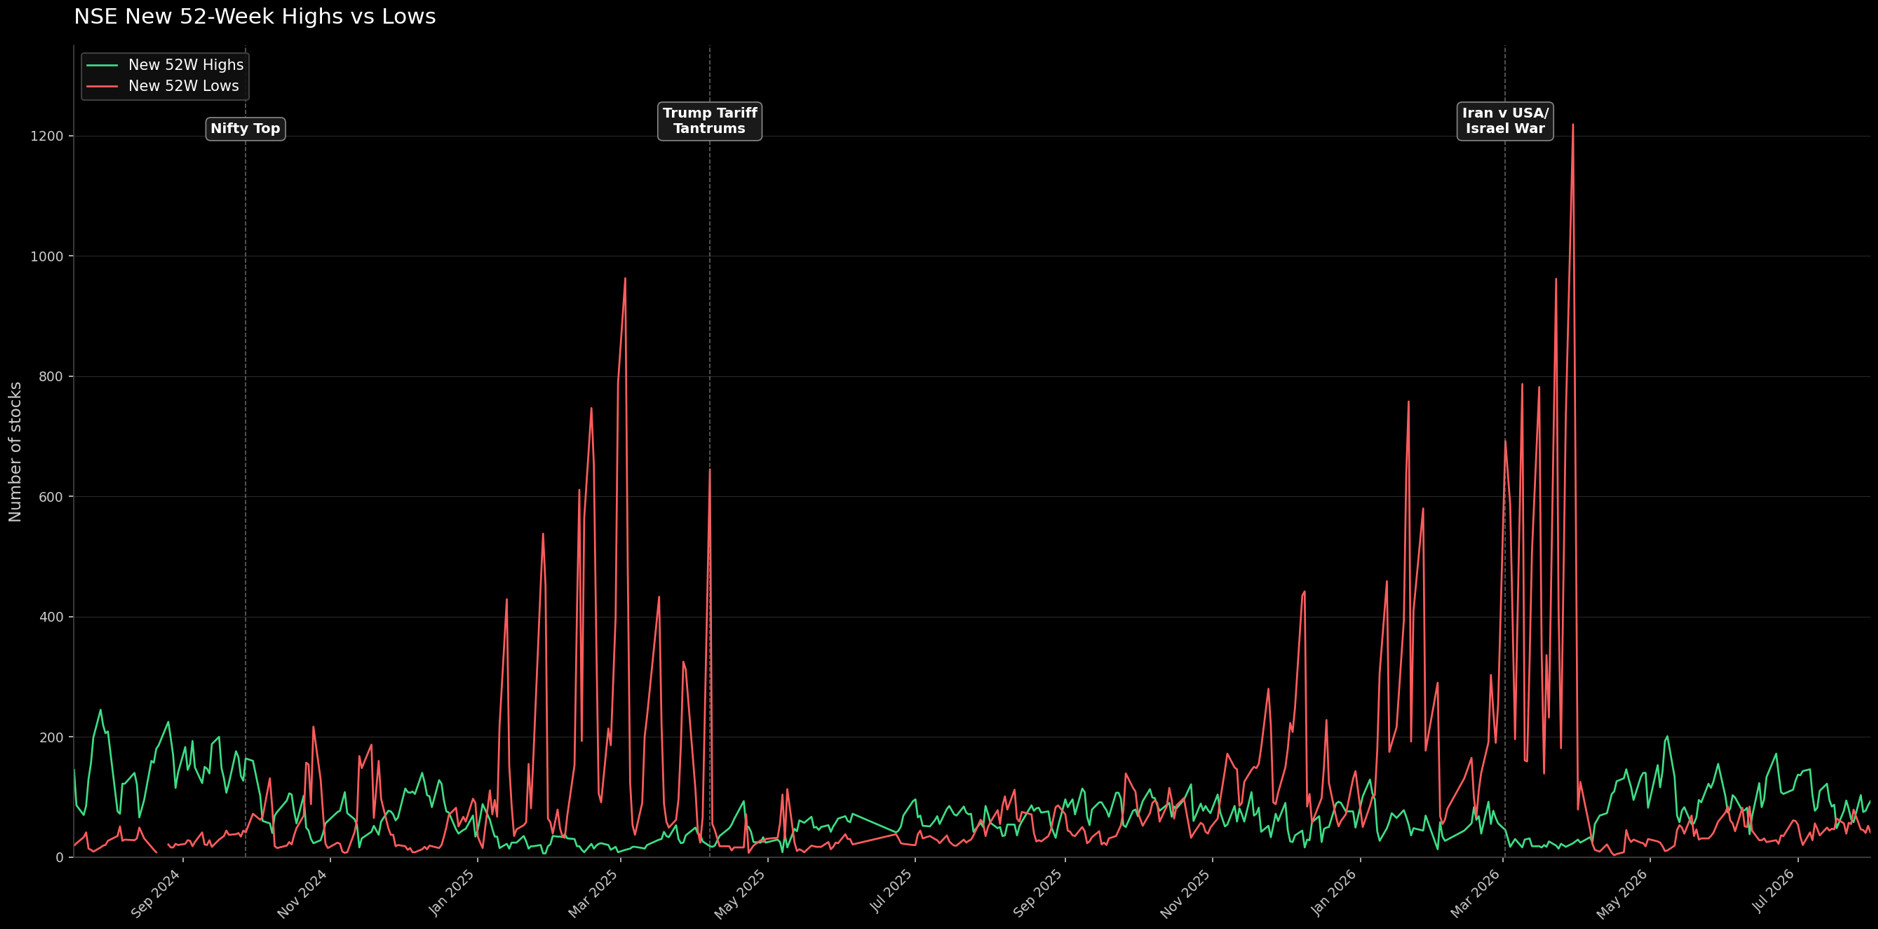
The chart below plots exactly that for the last two years across Indian markets.
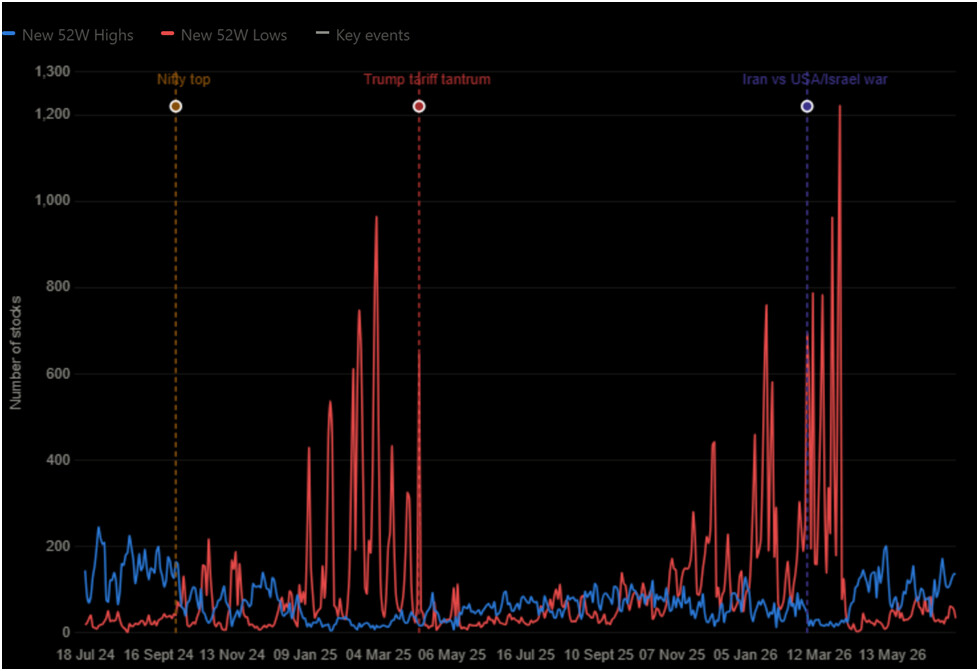
Chart: NSE Daily New 52-Week Highs vs Lows — Jul 2024 to Jul 2026
July–August 2024: Clear Bull Market
Through July and August 2024, markets were consistently clocking 200+ new 52-week highs every single day. That’s not noise, that’s broad-based participation, sign of a healthy bull run. Stocks across sectors were hitting fresh peaks, and breadth was confirming what price action was suggesting.
September 27, 2024: Nifty Topped
And then, quietly, the breadth began to deteriorate. The crossover, the day when new 52-week lows first decisively eclipsed new 52-week high happened in early October 2024. That crossing is worth treating with respect. It doesn’t necessarily mean run for the exits, but it’s the market whispering that the easy money is behind you. Buying pullbacks aggressively after that signal is a different risk proposition than it was two months earlier.
Most technical indicators outside of 52 week high/low list would show us deteriorating breadth. The goal should be to be aware of the deteriorating breadth and not attempting to call the tops.
October 2024 to March 2026: The Long Grind
What followed was 17 months of painful churn — a slow, grinding decline punctuated by bear market rallies that sucked in optimists before resuming lower. Trump’s tariff tantrums and war with Iran just increased the panics in the market.
May 2026: The Snap-Back
Once the ceasefire was agreed, the reversal was violent and fast, exactly as snap-backs from fear extremes tend to be. By early May 2026, markets were clocking 200+ new 52-week highs again. Fear had flipped to relief, and the breadth confirmed it in real time.
The Framework
My working rule is simple: when either side, highs or lows, starts printing 200+, the barometer is tilting heavily into greed or fear territory. Those are the moments to pay attention to positioning.
More importantly, the crossover points, when highs flip to lows or lows flip to highs, are the transitions worth positioning around. From greed to fear. From fear to greed. You don’t need to be precise to the day. Being roughly right and reading the pulse of the market correctly is enough to determine whether you should be buying the dips aggressively or selling the rallies.
Where We Stand Today
The current setup (June–July 2026) looks constructive but not frothy. Highs are running in the 100–170 range with lows contained in the 20–60 range, positive breadth, but not the stretched 200+ consistent readings that signal excess. I believe there’s room to run.
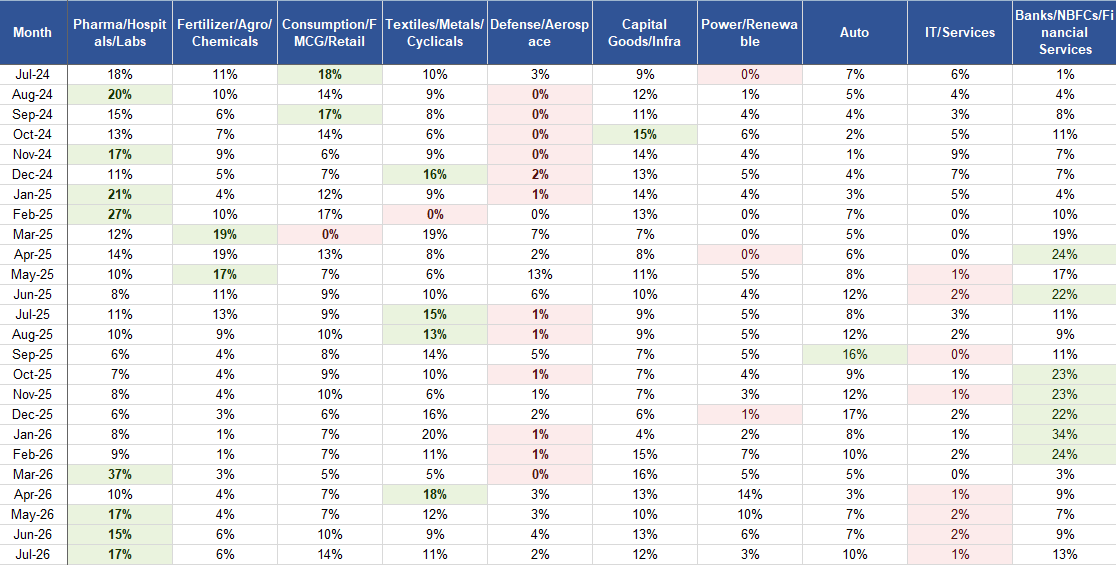
What’s particularly encouraging is the quality of rotation in the 52-week high list. Textile stocks have recently joined the party, but leadership continues to come from Capital Goods, Aero-Defense, Engineering, Power, Pharma, and Lending. Q4FY26 year-on-year earnings growth for SMIDs came in north of 25%, even through a challenging macro backdrop. That’s a meaningful data point.
AI cycle in global markets is a key item on the radar. Global AI businesses charts do so signs of fatigue. So need to watch out how it pans out.
Techno-Funda Set-Up I Like: Mufin Green Finance
Background & Fundamentals
In 2022, APM Finvest was acquired by Mr. Kapil Garg, who took a 67.75% controlling stake and proceeded to rebuild it from the ground up. The company was renamed Mufin Green Finance, and the strategy pivoted entirely to ESG financing: electric vehicles (2-wheelers, 3-
| Financial Year | AUM |
|---|---|
| FY2021–22 | ₹48 crore |
| FY2022–23 | ₹262 crore |
| FY2023–24 | ₹624 crore |
| FY2024–25 | ₹838 crore |
| FY2025–26 | ₹1,541 crore |
Company Goal: Tech-First & Asset-Light
By FY26, Mufin Green has pivoted again, this time into a tech-first, asset-light model built around highly automated, digital-only products that require minimal manpower. Two products are worth highlighting:
Mediclaim Insurance Premium Financing already the largest segment at 39% of total AUM (₹608 crore as of March 2026). This is a sleek digital product: customers financing their health insurance premiums through a structured lending product. Sticky, recurring, and underwriting relatively lower risk than traditional lending.
Salary Saathi a government salary-backed lending product directly integrated with state government HRMS systems. The employer guarantee embedded in the structure de-risks the underwriting meaningfully.
Management is simultaneously reducing headcount from 499 to 300 while targeting a tripling of profitability a combination that, if executed, would dramatically improve operating leverage. The stated long-term ambition is ₹500 crore+ in profitability within three to four years.
A Word of Caution
Before getting carried away with the growth trajectory, it’s worth reading the ValuePickr thread by @24comlb, which forensically examines the promoter group’s history with Hindon Mercantile and raises legitimate questions worth sitting with. I’d call it required reading before forming a strong view either way: link
The latest concall transcript is also a must-read for anyone interested in the business.
Execution is the biggest risk in this story.
Technical Side
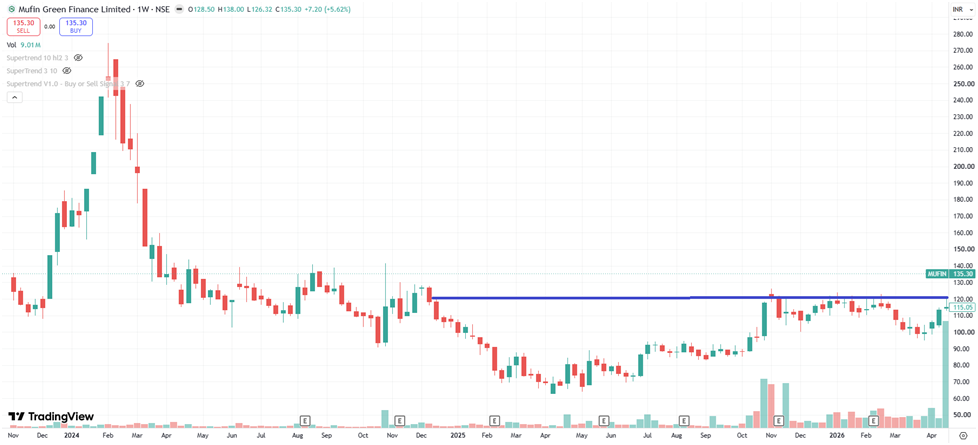
The weekly chart tells an interesting story. The stock spent over two years in a Stage 1-type base which was long, grinding, largely ignored consolidation. In early April 2026, it broke out in what appears to be a cup-and-handle pattern, with encouraging volume accompanying the move. The stock now looks to be attempting a transition into Stage 2 — the markup phase — though it’s still early days and confirmation is needed.
Posting a weekly chart of Mufin Green which doesn’t have last 3 months of data. @Satishwe pls let me know if you find anything wrong, and I will be happy to remove the chart.
Disc: invested in the business discussed. Sharing examples for education purpose and not an investment recommendation. Please do your own due diligence.