Hello Chandragupta,
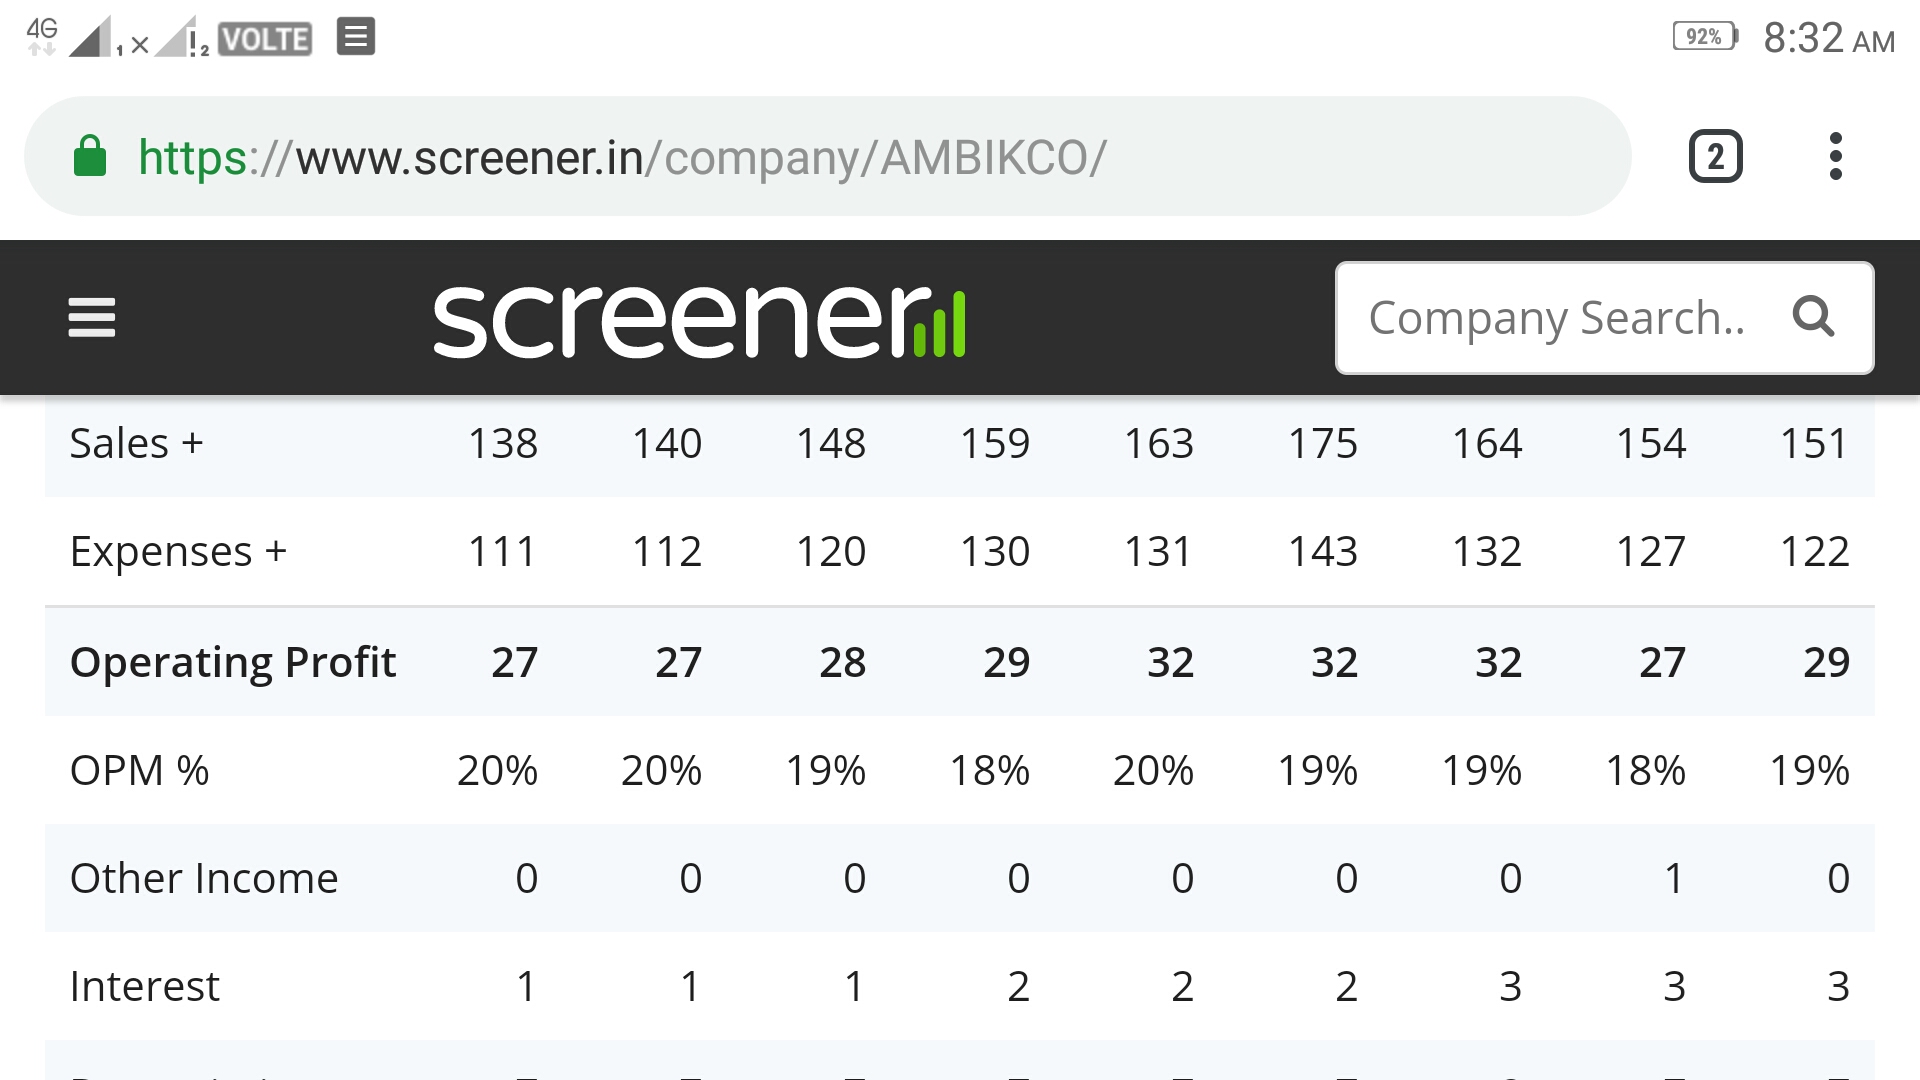
Could you please point me to the source for this. I checked on screener but the margins seemed stable
Could you point me to the source of this information.
Thanks
Hello Chandragupta,
Could you please point me to the source for this. I checked on screener but the margins seemed stable
Could you point me to the source of this information.
Thanks
AR 2018-19 mentions this detail.
Regarding margins reducing, I couldn’t find it.
I do not see how ACM is losing its Moat.
Debt is expected to rise because there was Fixed Assets investment. The global economy is a bad, and the company is going through a expansion. Debt is still under control. Not a point of worry yet.
Right. The fabric manufactured by ACM may not be the one made from its own yarn. Their AR says that their yarn is exported to USA and Europe which is used for making shirts on advanced technology looms which nobody in India (probably Asia) has.
The fabric ACM manufactures is probably a commoditized business, which may have less margin, but is still a cash-cow. No matter of worry there. It will only add to the profits. Only if one could find out, whether the fabric manufacturing business is running is a negative WC cycle (payable days > receivable days).
The new plant will manufacture more of the premium yarn, which will cause noticeable addition to the profits. That IF (a big IF) all goes well. Only then the stock price will pick up. Till then I see the downward price momentum continue.
The FcF is currently negative, and will be so for next two odd years: Is my guess, due to Capex and bad economy. This will cause the stock price to collapse, but I have faith that the management will overcome it. The first step is to stop the dividends!
DEBT:
Debt has increased but that is expected. In that past the management has taken steps to cut down on it. In fact, in 2017 AR the debt was almost cleared.
LastYears
finance Cost/Before Finance Cost and Depreciation
=492/11342 = 4.3%
Current years
942/12510 = 7.5%
So there is a minor increase. You will be surprised that it was much much higher in earlier years. But was well managed.
Now the question is, how low will the stock go? I do not want to rely on DCF for midcaps (that too for textiles in a bad economy).
I see 700-800 as a supportive belt. If more bad news comes-by then price will swiftly find itself around 450, which will be the best time to buy.
On margins, this is what I get:
| Particulars / Rs. In Crores | FY13 | FY14 | FY15 | FY16 | FY17 | FY18 | FY19 |
|---|---|---|---|---|---|---|---|
| Operating Profit = PBT + Dep + Interest - Other Income | 86.65 | 103.08 | 98.86 | 92.32 | 104.34 | 112.08 | 123.53 |
| OPM % | 21.78% | 21.62% | 19.96% | 18.75% | 19.74% | 19.18% | 18.84% |
And on Raw Material imports, this is what the Annual Report says:
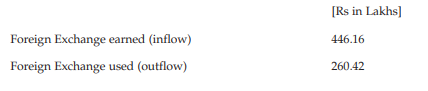
“Rs. in Lakhs” is a typo, it should be Crores. Most of this outflow is on account raw material imports though a small amount could be other expenses like travel, machinery & spares etc. This figure was Rs.352 crore last year.
Dear all,
I am a new investor and tracking ACM.
In the annual report , i am trying to find how the value of 4.96 lakh and 8.82 lakh is allocated against sale of assets and sale of fixed assets under cash flow from operating activities and investing section.
Appreciate your guidance
If there is a lose on asset sale the same has to be recorded in the income statement. Lost on sale of Machinery of 4.96 is added under other expense in income statement (check note 28). So this expense has to be removed from the CFO. It looks like the same asset was sold for 8.82 and so it’s added under CFI. So the actual asset value after depreciation was 8.82+4.96.
Cotton prices increasing in international markets in last 2 weeks and decreasing in India . This is positive overall.
Longterm rating upgraded by CRISIL
Did anyone attend Ambika’s AGM and post the notes here? It will be of great help.
Hi all,
Please see the article below. It claims that Ambika might have taken working capital loan to pay off the payable due and reduce Days sales receivables and days payable down from previous year. The article also points out the misalocation of funds that were used to pay dividends. They could instead be used to pay off the debt.
I would be curious to know how logical is the argument mentioned in this article? Thanks
I partially agree with your assessment.
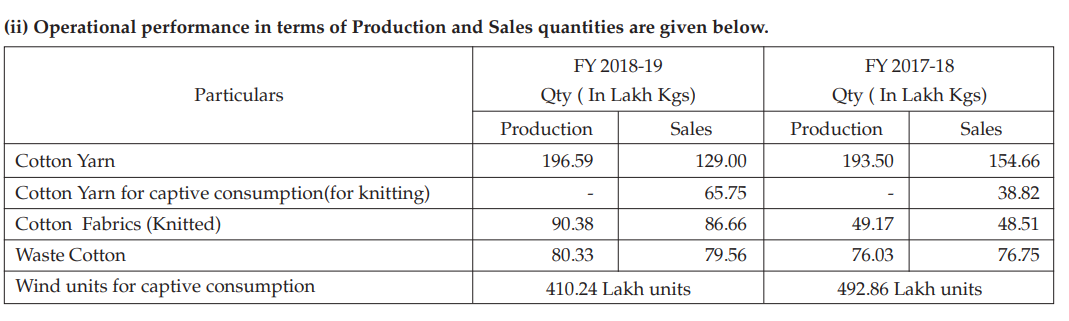
The imports from foreign exchange shows decline y-o-y. The sales from cotton yarn have declined but the delta seems to be the exact quantity of cotton that is being used for knitting. 196 - 129 = 66 Lakh kgs in FY 18-19 or 193-154 = 39kgs in FY 17-18 . Company seems to be changing its business model to knitting instead of spinning its highly known premium yarn.
Ambika has raised their inventory levels by taking working capital loans (which is mainly raw cotton) substantially in last 2 years assuming that the cotton prices will skyrocket which could be another reason for less imports in FY 18-19.
I wish management could clarify any change of business model in its AR. I would be curious to know if anyone has attained AGM and asked this question.
Thanks for sharing the insights. But when i first looked at it, I got the impression that out of 196 units produced, 129 went for sales and 66 used for knitting. This doesn’t seem to be a major problem as the majority of sales is still the cotton yarn.
Disappointing results again
People who attended the AGM, is there any reason for this? Company had shown consistent margins before but this time everything has taken a big hit.
Sunil,
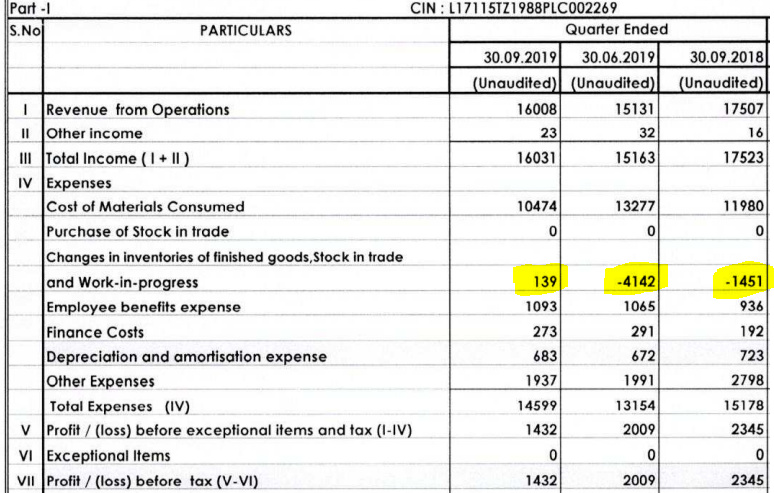
Grateful if you can share specific points around this. In my view, broadly the topline and expenses are in-line with last quarter. The main impact is due to change in inventory figures which lowers PAT (rather artificially).
The built-up in the inventory is clearly evident on the Balance sheet - currently ~316 cr (against market cap of ~488 cr., wow!!). The question remains whether is it due to some specific reason:
I don’t have answer to this yet, but if someone manages to speak with management, that would be great.
Overall, the cashflows look healthy, but again 44 cr. stuck in inventory in 1H is not an encouraging sign unless there is any good valid reason.
One very good point which I notice is that they seem to have paid almost entire working capital loan (see cashflow from financing activities >> 1H’19 itself they paid ~70 cr WC loan + interest of ~5.5 cr., with ~20 cr loan outstanding now).
If anyone is aware about the progress of new capex, kindly add. I noticed that fixed assets have not moved much.
Hi Vivek
There seems to be drastic increase in trade payable from 7 cr to 65 cr??
Yes, but payables are generally not concerning. If it would have been receivables, then it would be worrying sign.
Going by the cotton price which declined by 30% between Apr and September, their inventory would have taken a knock to that extent. Typically, 80% of their total inventory (316 cr) is towards raw material. That will be about 70 crore split between q1 and q2. Despite that, if margins have withstood, so is the knitting so good on operating margin?
All cash rich spinning companies seem to have piled up inventory - may be due to low prevailing prices in q1 and then lower crop prediction.
Hi fellow investors,
I was looking at the quarterly results and found something that I could not understand.
What is the meaning of this negative expense for inventories and work in progress?
Cost of sales line is split into two(pursuant to revised schedule VI issued by MCA a few years back - see the Revised Schedule VI Guidance Note) - the first line is COGS(applicable for manufacturing activities)/ purchases(applicable to trading activities) - which shows the cost of all materials(raw materials) purchased during the period and the second line being changes in inventory for the period.
Let me give you an example -
Assume Ambika had
Thank you!
AJ