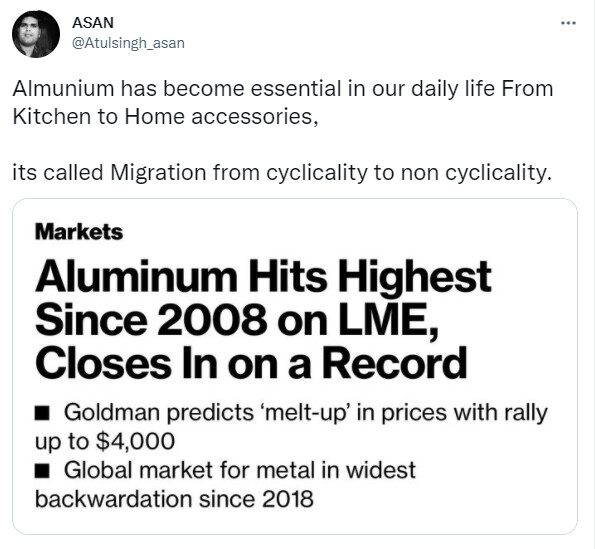
Atulsingh_asan on twitter tweeted this:
Alufluoride Revenue break-up
Domestic turnover:85%
Exports turnover: 15%
Domestic major clients
NALCO: 60%
Balco: 10%
Hindalco: 10%
Others: 5%
Note: I am not sure how much authentic this information is.
Atulsingh_asan on twitter tweeted this:
Alufluoride Revenue break-up
Domestic turnover:85%
Exports turnover: 15%
Domestic major clients
NALCO: 60%
Balco: 10%
Hindalco: 10%
Others: 5%
Note: I am not sure how much authentic this information is.
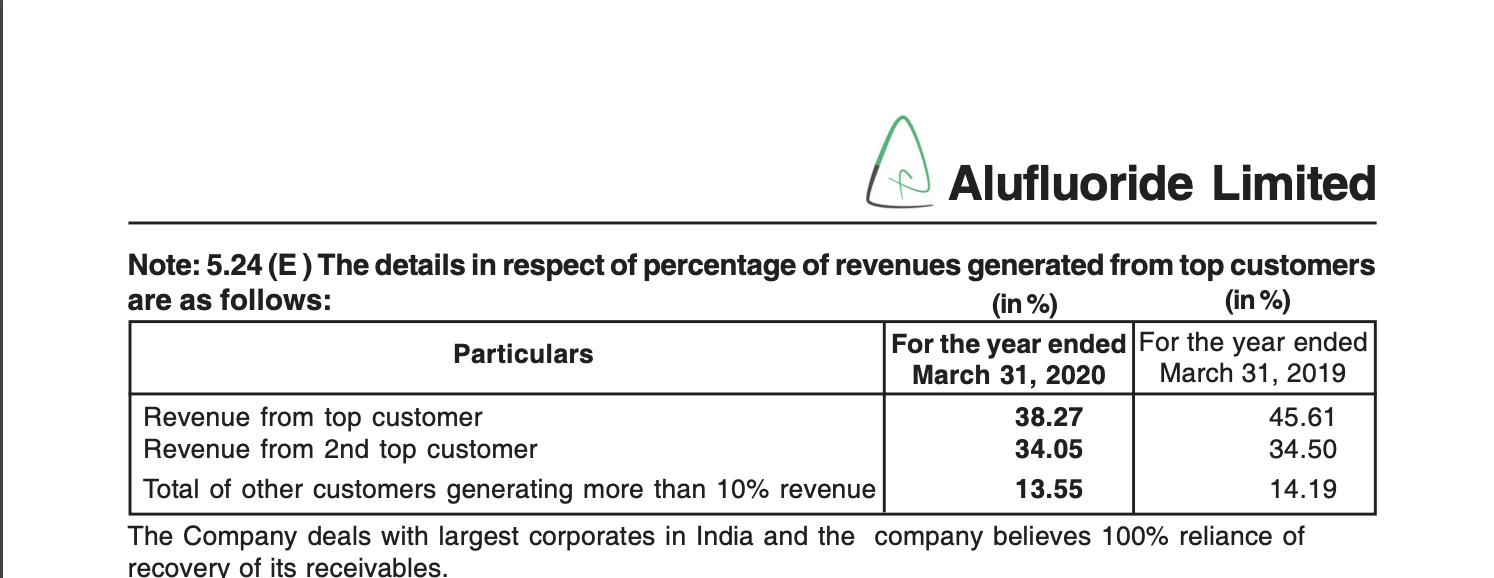
I was going through 19-20 Annual report. The difference between revenues from biggest and second biggest customer isn’t as big as mentioned in the tweet. I may have mis-understood the data. Can someone throw some light on this?
Attaching the screenshot of the Annual Report(Page 74 of 96).
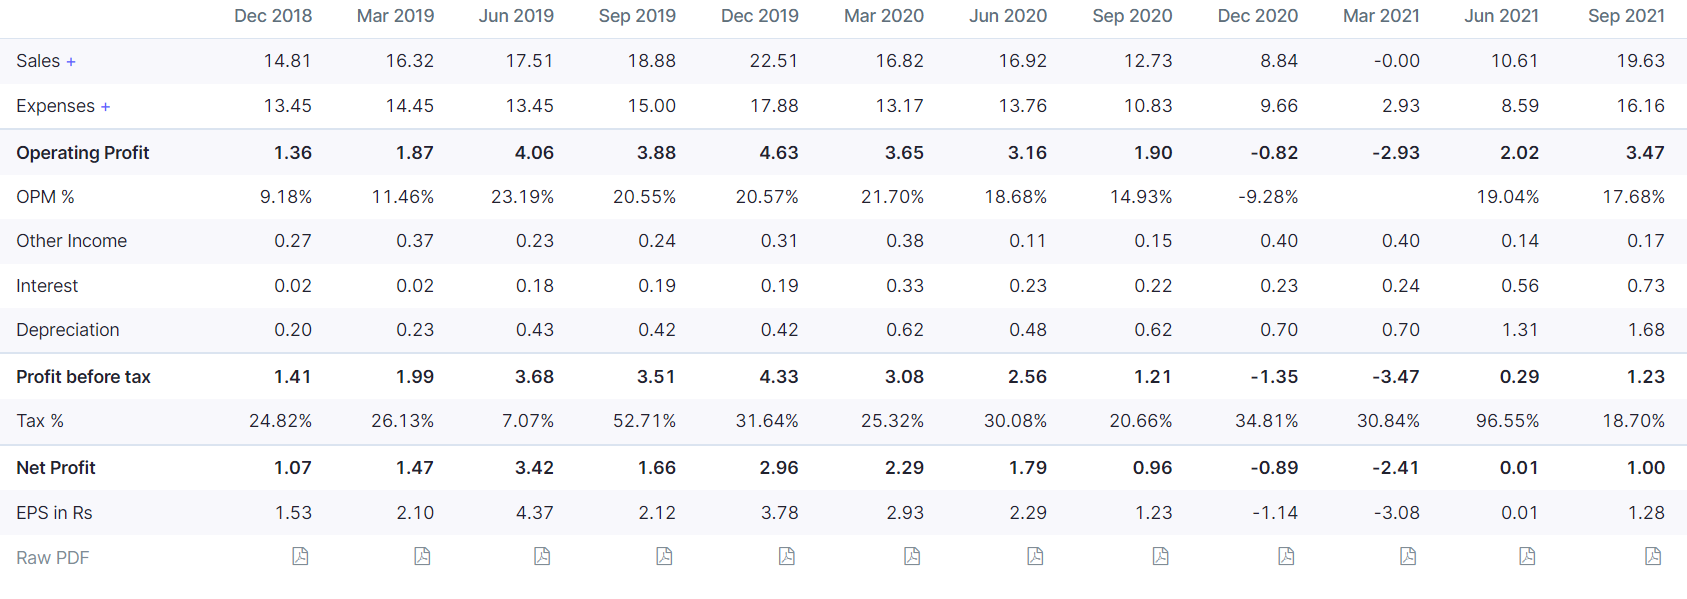
June Quarter results are out. Great results considering the fact that plant operation started on 1 May. Hence, 2 months of production and good results. Next quarter onwards, we will realize the new potential after capacity expansion.
Silicic Acid supply from adjacent Fertilizer Complex continues to be a problem. Lets see how they tackle it.
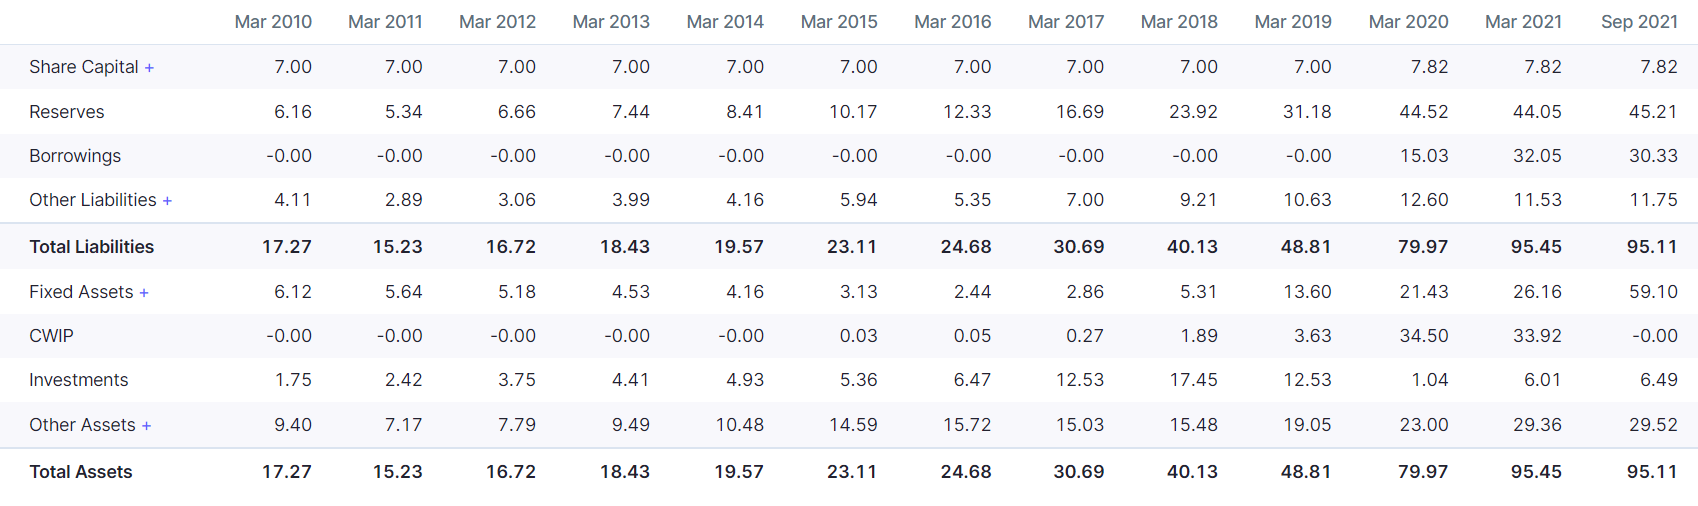
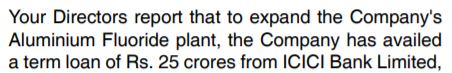
A key trigger for the company is a huge capex. They have more than doubled the gross block from March to September:
Rise in debt is to fund capex:
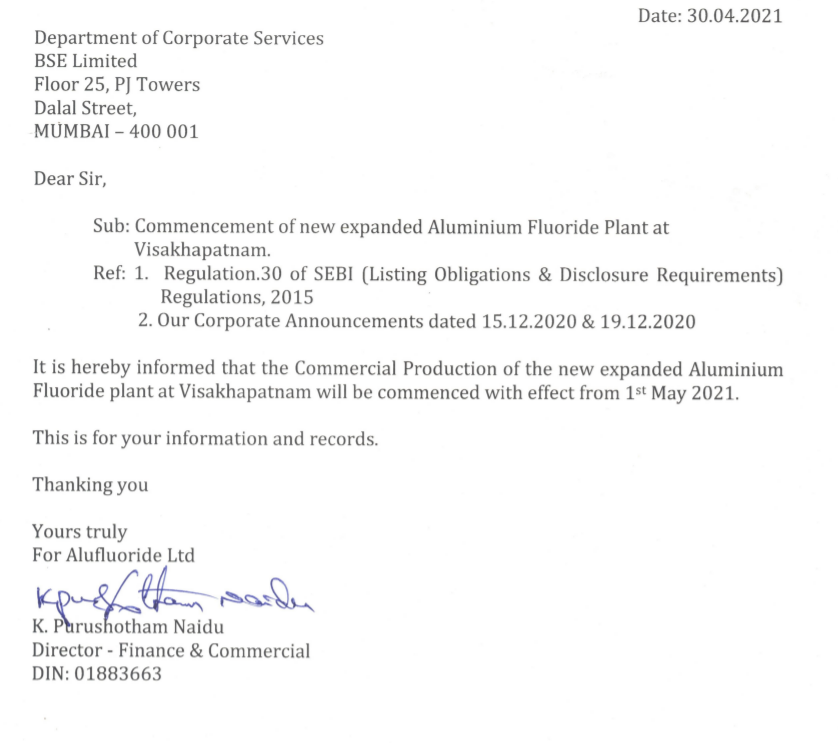
Commercial production was commenced on 1 May:
Sharp rise in depreciation in Q1 and Q2 FY22 is clearly visible (due to capitalisation of new capacities hence depreciation starts getting levied on new assets):
March quarter (Q4 FY21) is clearly a black swan with zero sales so we need to understand what happened here. The reason is that they shut down their existing plant to synchronise with the new plant:
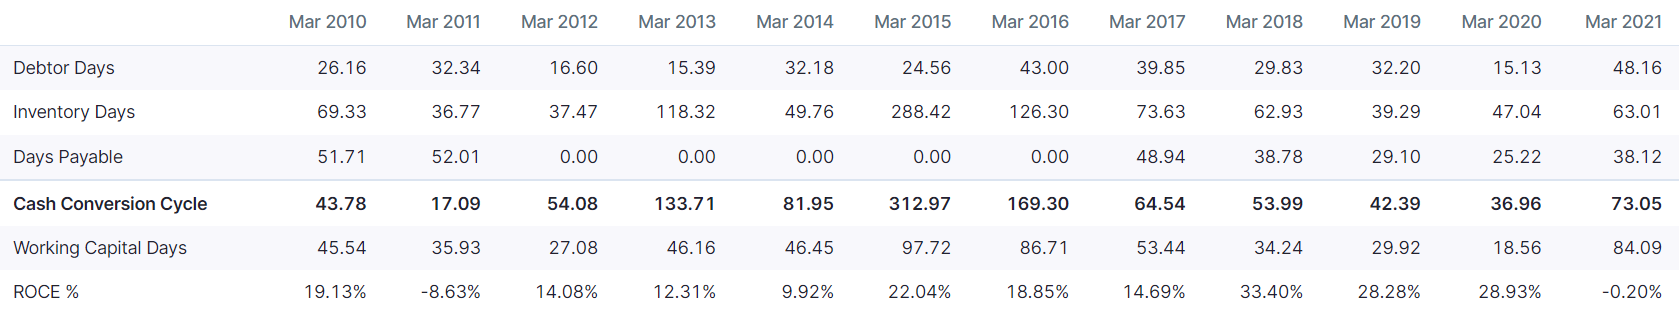
Although they made a small loss in FY21 and TTM and hence FY21 RoCE is -0.2%, they have a track record of generating 20-30% RoCE in last 4-5 years:
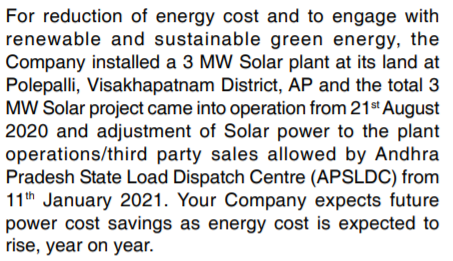
They have also entered power generation for captive use. This is expected to lower energy costs:
I have one question, in case someone can please answer: I believe even cryolite (Na3AlF6) acts as flux in reducing the melting point of Alumina. Do aluminium producers primarily use cryolite or Aluminium Fluoride and whether the effectiveness in reducing the melting point of Alumina is more for one over the other or are they very similar? What is the difference between the two?
Disc- have a small tracking position
I have been trying to dig deeper here and get more insights.
Tanfac Industries is a competitor in Aluminium Fluoride (though they have several other products too) and they have Swiss Davy Process technology. However, Tanfac is reducing the focus on Aluminium Fluoride as it is only 2% of their sales. Extract from Tanfac AR:
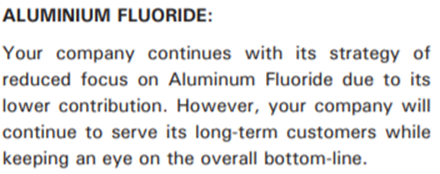
This can lead to market share gains for Alufluoride.
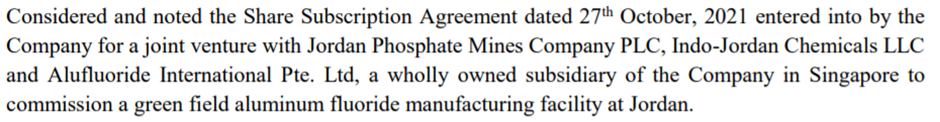
They also announced a joint venture with Jordan Phosphate Mines Co.:
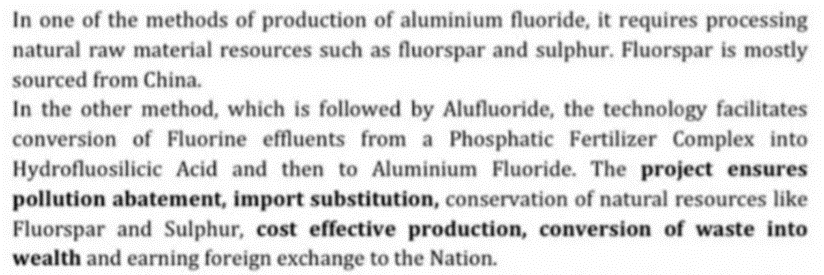
Alufluoride has an edge in their production process, which is environmentally more sustainable and is not reliant on fluorspar (which is mostly sourced from China):
There are two methods of producing aluminium fluoride. The first method (80% of world production), requires processing raw materials like Fluorspar and Sulphur. Fluorspar is mainly imported from China. Their competitor Tanfac uses this method. In the other method (which Alufluoride uses), it is sourced from the fertilizer complex by reacting alumina hydrate with hydro-fluosilicic acid, generated from the fluorine recovery unit. This does not require imports of raw materials and hence is more cost-effective giving Alufluoride a cost advantage.
By rough calculations, we get the market size in India at approx. 82300 TPA (India’s aluminium production in FY20 was 3.6 MT and around 25 kg of aluminium fluoride is required per ton of aluminium production). Realisations are around Rs 80 per kg and hence market size from a demand perspective in India can be around Rs 650 Cr. Against this, Alufluoride’s TTM sales are Rs 40 Cr. Alufluoride and Tanfac’s combined capacity suggests that around 70-80% of demand is being fulfilled by imports and there is a large potential for import substitution.
Disc- have a tracking position
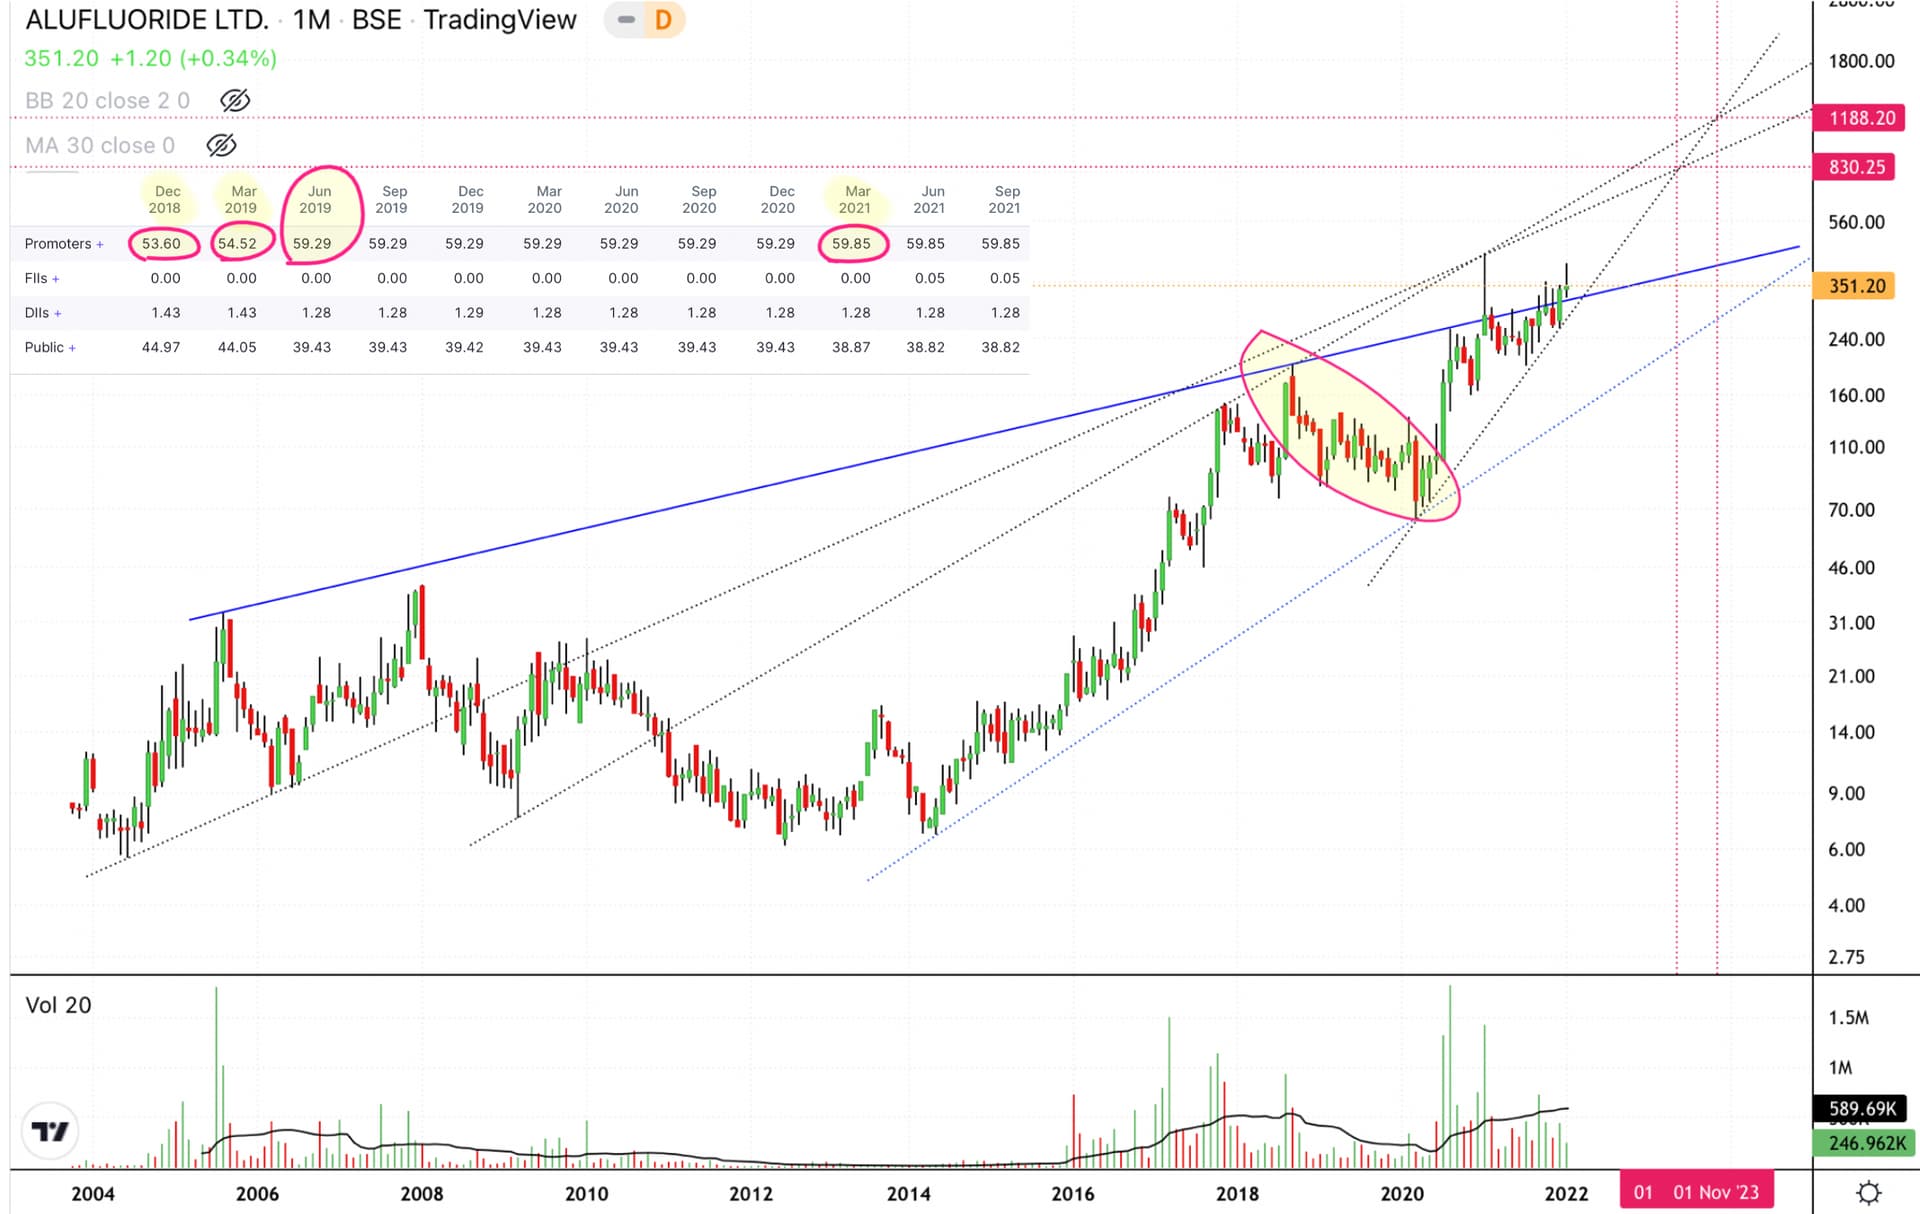
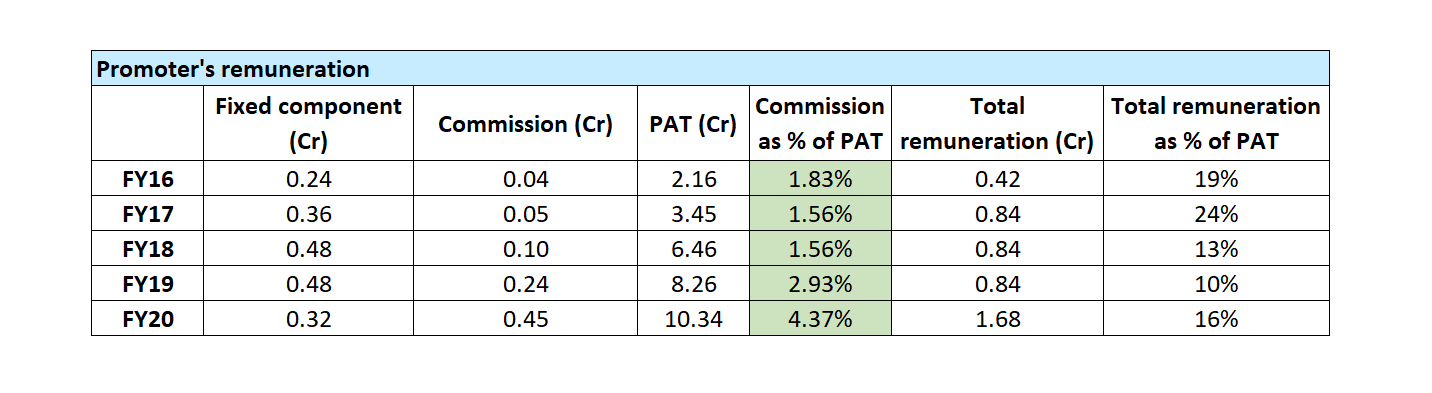
Steller results! Promoter’s fixed income component is going down and commission as % of PAT is going up. High skin in the game!
Hi, I was going through the last 5 years Annual Reports and I couldn’t find the solar power generation/consumption component in 2022 AR. Any idea on what happened to their installed solar plants?
| Year | 2018 | 2019 | 2020 | 2021 | 2022 |
|---|---|---|---|---|---|
| Solar Generation (in MWH) | 269 | 606 | 317 | 456 | 0 |
Also, as per their ARs, 3 MW solar plant is synchronized with Grid. If I consider an average generation of 4k units per day, this has a total capacity of 4320 MWH (more than it’s purchased electricity component of 2022). So, there should be savings of ~ 3cr (@7.4/- per unit) due to solar power which I don’t see in the ARs. Am I missing anything?
| Year | 2018 | 2019 | 2020 | 2021 | 2022 |
|---|---|---|---|---|---|
| Purchased Electricity (in MWH) | 2,611 | 2,451 | 3,163 | 1,687 | 4,036 |
| Purchased Electricity (in Crores) | 2 | 2 | 2 | 1 | 3 |
The website has been revamped thankfully. This is an important aspect for the company and ones who are well versed with the old website would appreciate this fact I suppose.
Completely agree
Previous one belonged to stone age kinds in this era!!
Anyone tracking recent updates?
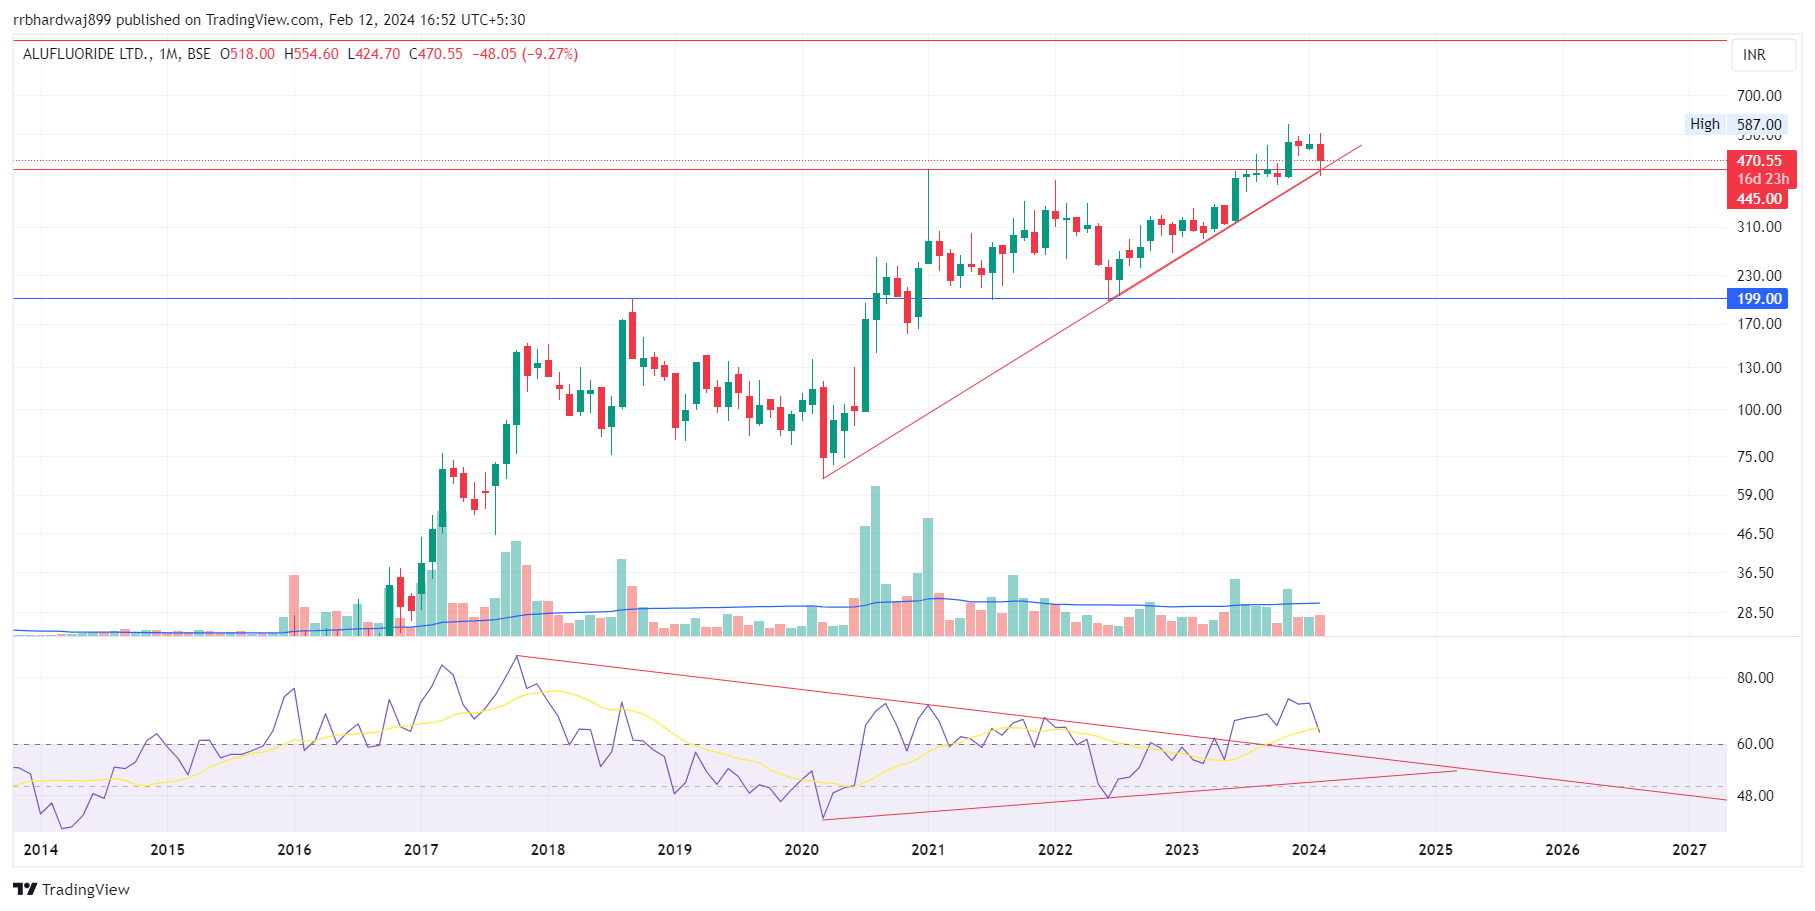
Why there is sudden fall in the stock
Result below investor’s expectations
Disclaimer - bought today. view biased.
is this data available in AR??
where did you get this 25KG AlF3 per ton Aluminium??
Can you share source because i searched on google and it’s saying 20Kg.
thanks
Sir, that looks like a rising wedge to me. I think a breakdown’s more probable.