
1. Executive Summary
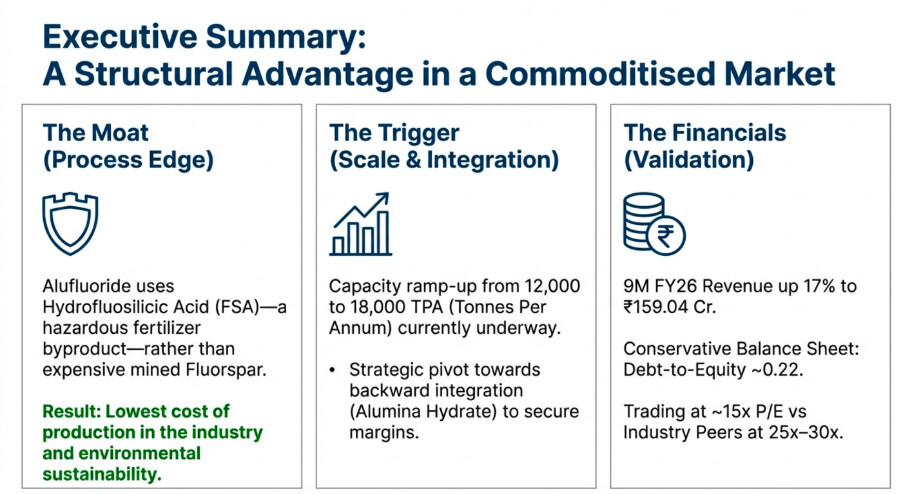
Alufluoride Ltd is a niche chemical player based in Visakhapatnam, Andhra Pradesh, primarily engaged in the manufacturing of Aluminium Fluoride (AlF3). The company operates on a “Wealth from Waste” model, utilizing Hydrofluosilicic Acid (FSA)—a hazardous byproduct of the fertilizer industry—to produce AlF3, which is a critical flux used by aluminium smelters to reduce energy consumption.
Key Investment Thesis:
-
Production Growth: The company is expanding capacity from 16,000 TPA to 18,000 TPA.
-
Strategic Pivot: Successfully exited the risky Jordan Joint Venture (JV) to focus on domestic backward integration (Alumina Hydrate project).
-
Financial Health: The company remains debt-averse with strong cash flows, despite a capital-intensive expansion phase. 9M FY26 revenue stands at ₹156.18 Cr, up significantly from ₹131.89 Cr in 9M FY25.
-
Moat: It is one of only two AlF3 manufacturers in India using the low-cost FSA route, competing favourably against imports and high-cost fluorspar-based producers.
2. Business Overview & Operational Performance
2.1 Product & Technology
-
Core Product: High-purity Aluminium Fluoride (AlF3).
-
Technology: Uses technology developed by Alusuisse, Switzerland. This process is environmentally sustainable as it uses fluorine emissions from fertilizer complexes rather than mining fluorspar.
-
Market Position: Alufluoride holds approximately 20-25% of the domestic market share. The total Indian demand is ~80,000 TPA, while domestic production is limited (Alufluoride ~18k TPA + Greenstar ~5k TPA), making the company a vital import substitution player.
2.2 Capacity Expansion
-
Current Status: Capacity has been enhanced from 12,000 TPA to 16,000 TPA and is currently being ramped up to 18,000 TPA.
-
Solar Power: The company has commissioned a 3 MW solar plant and is adding another 1.1 MW, generating ~85% of its energy requirements via captive solar, significantly aiding margin protection against volatile power costs.
3. Future Prospects
3.1 Backward Integration: Alumina Hydrate Project
A major strategic shift highlighted in the AGM is the plan to manufacture Alumina Hydrate, a key raw material.
-
Rationale: Alumina Hydrate prices have been volatile, impacting margins. Captive production will secure raw material availability and stabilize input costs.
-
Capex: The estimated investment for Phase 1 (30,000 - 50,000 TPA) is approximately ₹40–50 Crores.
-
Impact: This will transform the company from a pure converter to a more integrated chemical player, potentially expanding margins by eliminating supplier premiums and logistics costs.
3.2 Withdrawal from Jordan JV
-
Context: The company had planned a JV in Jordan (Jordanian Renewable Aluminium Fluoride Manufacturing Company).
-
Decision: The Board decided to withdraw and disinvest completely due to geopolitical instability in the Middle East (Gaza conflict) and onerous banking conditions (demand for corporate guarantees from the parent entity).
-
Investor Takeaway: While this writes off ~₹2.6 Cr in investments, it eliminates a significant geopolitical risk and frees up management bandwidth/capital for the domestic Alumina Hydrate project. This is a prudent capital allocation decision.
-
3.3 Value-Added Products (Silica)
- The company has tied up with IIT Hyderabad to develop technology for converting silica effluents into value-added products. This aligns with their “Wealth from Waste” philosophy and could open a new revenue stream from waste disposal.
4. Financial Analysis: Trends & Growth
4.1 Recent Performance (9M FY26 vs 9M FY25)
Based on the Q3 FY26 results:
- Analysis: The company is showing double-digit growth in both top and bottom lines. The Q3 revenue specifically stood at ₹58.43 Cr, the highest in recent quarters, indicating the expanded capacity (16k → 18k TPA) is being absorbed by the market.
4.2 Margins
-
Material Costs: Cost of materials consumed for 9M FY26 was ₹75.89 Cr vs ₹76.71 Cr in 9M FY25. Interestingly, despite revenue rising by 17%, material costs slightly decreased/stayed flat. This suggests improved efficiency or better procurement, likely aided by the stabilization of FSA sourcing from IFFCO Paradeep.
-
Power & Fuel: The “Revenue from solar units” in Q3 FY26 was ₹15.69 Lakhs. The captive solar plant is keeping power costs managed, a critical factor for energy-intensive chemical plants.
5. Working Capital Analysis
The data below is derived from the Q2 FY26 Balance Sheet and AR FY25.
5.1 Current Ratio & Liquidity
-
Current Ratio (Sep 2025): Current Assets (₹86.27 Cr) / Current Liabilities (₹22.65 Cr) = 3.81.
- Note: The ratio has improved significantly from 3.1 in March 2025. A ratio above 2.0 indicates excellent short-term liquidity, but 3.81 might imply slightly inefficient capital deployment (excess cash or inventory).
-
Inventory Days: Inventory increased from ₹10.59 Cr (Mar '25) to ₹19.19 Cr (Sep '25).
- Analysis: The inventory levels have nearly doubled. This could be due to stocking up on Alumina Hydrate due to price volatility or preparing for higher production runs in Q3. This ties up cash but ensures production continuity.
-
Receivable Days: Trade Receivables rose from ₹12.69 Cr (Mar '25) to ₹19.62 Cr (Sep '25).
- Analysis: Receivables have increased by ~54% in 6 months. While sales grew, the pace of receivable growth outpaced sales growth. Investors should monitor this to ensure it doesn’t become a bad debt risk, although the customer base (NALCO, Hindalco, Vedanta) is blue-chip.
5.2 Working Capital Cycle
-
Operating Profit before Working Capital Changes (H1 FY26): ₹21.81 Cr.
-
Net Cash from Operations (H1 FY26): ₹12.07 Cr.
- Gap Analysis: Approximately ₹9.7 Cr of operating profit was consumed by working capital needs (Inventory increase and Receivables increase) in the first half of FY26. This highlights that while the business is profitable, the expansion is capital hungry regarding working capital.
6. Cash Flow Analysis
6.1 Operating Cash Flow (OCF)
-
FY25 (Full Year): The company generated ₹34.97 Cr in Net Cash from Operations.
-
H1 FY26 (First Half): Generated ₹12.07 Cr.
-
Observation: OCF remains positive and robust, sufficient to cover routine capex and dividends.
6.2 Investing Cash Flow (Capex)
-
FY25 Capex: The company spent ₹10.58 Cr on Property, Plant, and Equipment (PPE).
-
H1 FY26 Capex: Spent ₹6.10 Cr on PPE and CWIP.
-
Future Outflow: The projected ₹40-50 Cr capex for the Alumina Hydrate plant will likely be funded through a mix of internal accruals and debt. Given the strong OCF (~₹35 Cr/year), the company can fund a significant portion internally.
6.3 Financing Cash Flow
-
Dividends: The company paid a final dividend of ₹3/share (30%) for FY25.
-
Debt: Long-term borrowings increased from ₹8.30 Cr (Mar '25) to ₹19.68 Cr (Sep '25).
- Reason: This debt was likely taken to fund the ongoing capacity expansion and solar plant. However, the Debt-to-Equity ratio remains very comfortable (Total Debt ~₹22 Cr vs Equity ~₹102 Cr, roughly 0.22 D/E).
7. Risk Factors
-
Raw Material Dependency (FSA): The company relies on fertilizer companies (Coromandel, IFFCO) for FSA. Supply disruptions (e.g., maintenance shutdowns at fertilizer plants) directly impact Alufluoride’s production, as seen in Q4 margins historically.
-
Client Concentration: Sales are concentrated among 3-4 major smelters (Vedanta, Hindalco, NALCO). However, the exit of competitors like Tanfac from the AlF3 space mitigates the risk of losing these clients.
-
Project Execution Risk: The Alumina Hydrate project is a new chemical process for the company. Delays or cost overruns could drag on return ratios (RoCE), which have historically been high (20-30%).
-


8. Conclusion:

-
Growth Visibility: Revenue is tracking for an all-time high in FY26 (projected ~₹210 Cr+ based on 9M run rate).
-
Capital Allocation: Management demonstrated prudence by abandoning the risky Jordan project and refocusing capital on domestic integration (Alumina Hydrate), which will arguably yield better risk-adjusted returns.
-
Financial Discipline: Working capital is growing but managed well within the context of expansion. Cash flows are positive, and the balance sheet is under-leveraged (0.22 D/E), leaving ample room for the ₹50 Cr capex plan.
-
Competitive Advantage: With Tanfac reducing focus on AlF3, Alufluoride strengthens its position as the primary domestic alternative to imports.
We should monitor the working capital cycle in Q4 FY26 to see if inventory levels normalize and track the groundbreaking of the Alumina Hydrate plant, which will be the next major trigger for margin expansion.
================================================================
Latest AGM:
https://youtu.be/SzZbkqpp9xI
This Substack post piqued my interest in Alufluoride ltd:
https://firstprinciplesinvesting.substack.com/p/how-to-make-money-from-aluminium


===========================================================================
Gathered Notes from here & there. Not invested as of now, still studying.
No buy/sell recommendation
===========================================================================