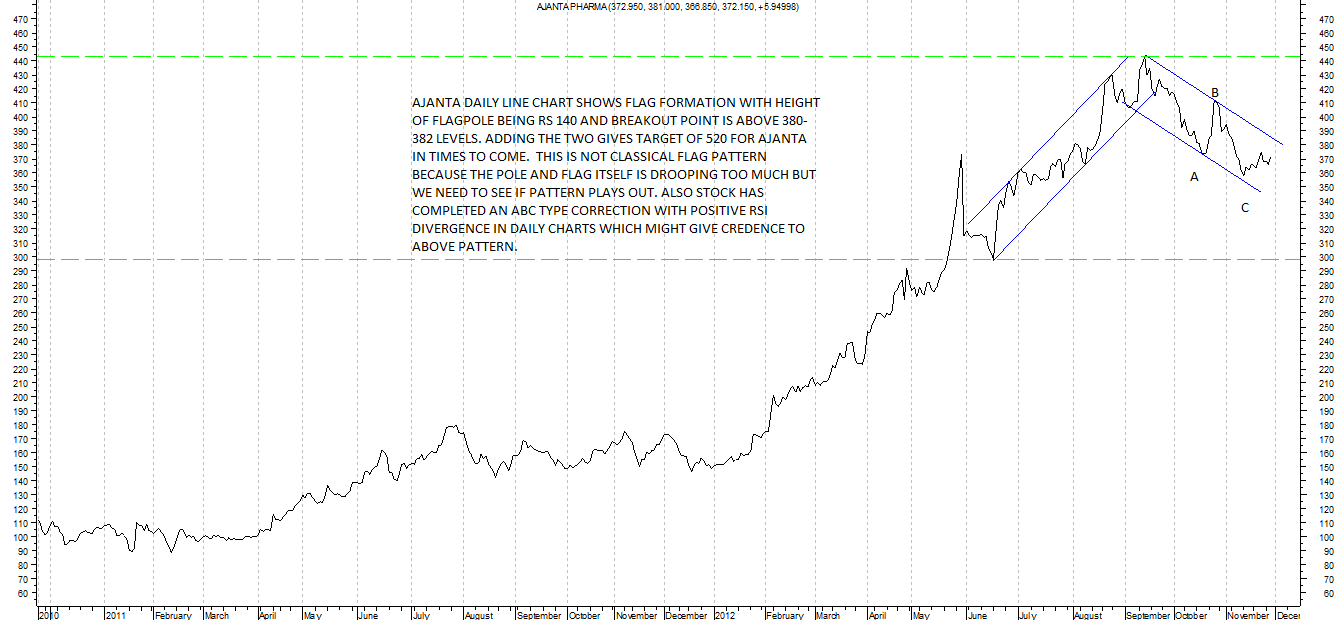
daily charts show a flag like pattern in ajanta pharma.
it also seems to have completed an a-b-c correction nearer to the 61.8% retracement level with positive divergence in RSI.
comments posted on charts.
daily charts show a flag like pattern in ajanta pharma.
it also seems to have completed an a-b-c correction nearer to the 61.8% retracement level with positive divergence in RSI.
comments posted on charts.
Hitesh Bhai
after kaveri playing out flag pattern will it be advisable to switch over complete / partial to Ajanta.
Regards
Hitesh Bhai
after kaveri playing out flag pattern will it be advisable to switch over complete / partial to Ajanta or Unichem.
Regards
On the line charts ajanta seems to have broken out of the flag pattern with closing at around 394 today.
Lets see how this pattern plays out.
agree with this hitesh. not only ajanta broke out of the flag pattern, it also closed above the 50 and 100 day moving averages. the setup is bullish.
also, granules seems to have finished its abc correction off the highs and right now struggling against the 50 dma. once it closes above 185-190 region, the move should gather momentum.
As per the Point and Figure Chart the stock has given a buy signal at 385. That is above its 50 DMA. Now the next resistance is at 420 where it will make a double top. As per price objective the stock can touch 500 where it will make another double top. This is as close as per price given by Hitesh Patel.
Here is the chart
Await feed back on this analysis
Seems Ajanta Pharma has become the no 1 Techno Funda pick ???
hi hitesh/tony,
have bilcare and manjushree also made flag patterns (and broken on the upside)?
(P.S.- I’m quite new at technicals, so pardon me if i’m wrong)
atul
bilcare and manjushree dont have the flag pattern but both stocks’ charts seem good in the short to medium term.
Hi Atul,
Manjushree made a low of 80 in Oct., and a high of 106. Thereafter it made a double bottom at 94. If it manages to break 100 where there is resistance then it can once again touch 106-108 levels.
Here is the chart:
Bilcare: Since October it has been making lower tops and lower bottoms. This is not a bullish sign. The stock has to break out 245, then it can make a high of 255-265. If it breaks out after this then the next target will be 370.
Here is the chart:
Hi Hitesh,
AJANTA PHARMA
Today the stock made a good move which was not surprising. I bought it around 340 when there was bad news about income tax raid. Stock had corrected and was consolidating. Such stocks should always be bought on bad news. This stock has been trading above its Bullish Support Line ( see line in blue) since June 2011. See chart here:
The stock is now in the “X” column which says more buyers than sellers, hence a price rise.Today it made a double top at 410 (2 “X”). Next resistance at 420 and then 440 where it will make an extended triple top ( 3 “X”). Thereafter a new high.
Stocks give a bullish break out when they are in momentum i.e when the 5 DMA cuts the 25 DMA from below. See chart here:
One can see the purple line cutting the green line. This is a bullish sign. Stock is trading above 5 DMA, 25 DMA and 50 DMA. One has to just wait and see the stock touching a new high.
Hitesh bhai
Shasun has fallen quite a bit on all the bad news related to vertex,
whats your views on the same
rgds
hardtoget
Shasun seems to be trying to establish support nearer to 130 levels. I think if there is a bounce from these levels one can exit bcos the news regarding incivek are not good and might impact the results for next few quarters.