I’ve avoided discussing individual stocks until now. But having surrendered my advisory license (due to regulatory overburden), I’m free to share my learning journey and decision-making process. I hope to learn more from fellow forum members :)
I’ve spent the last few months studying the energy transition. The transition is among the defining megatrends of our time, with profound implications for climate, human progress, and capital allocation. The study began with a hypothesis: the transition will happen, but there’s considerable hyperbole around it, particularly from investors who overlook the physics .
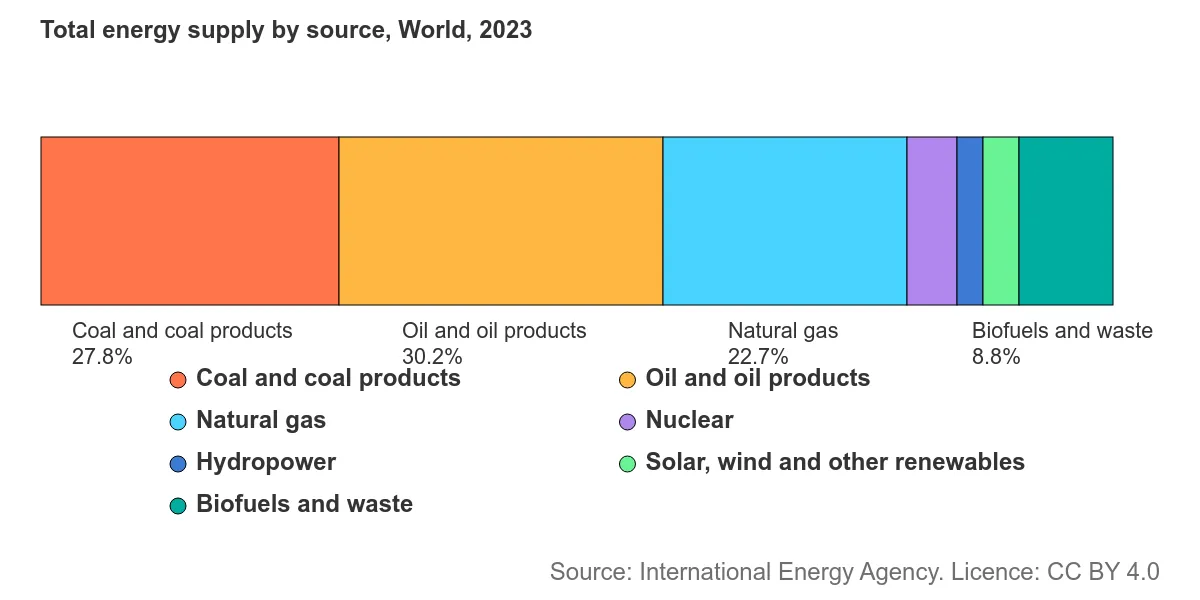
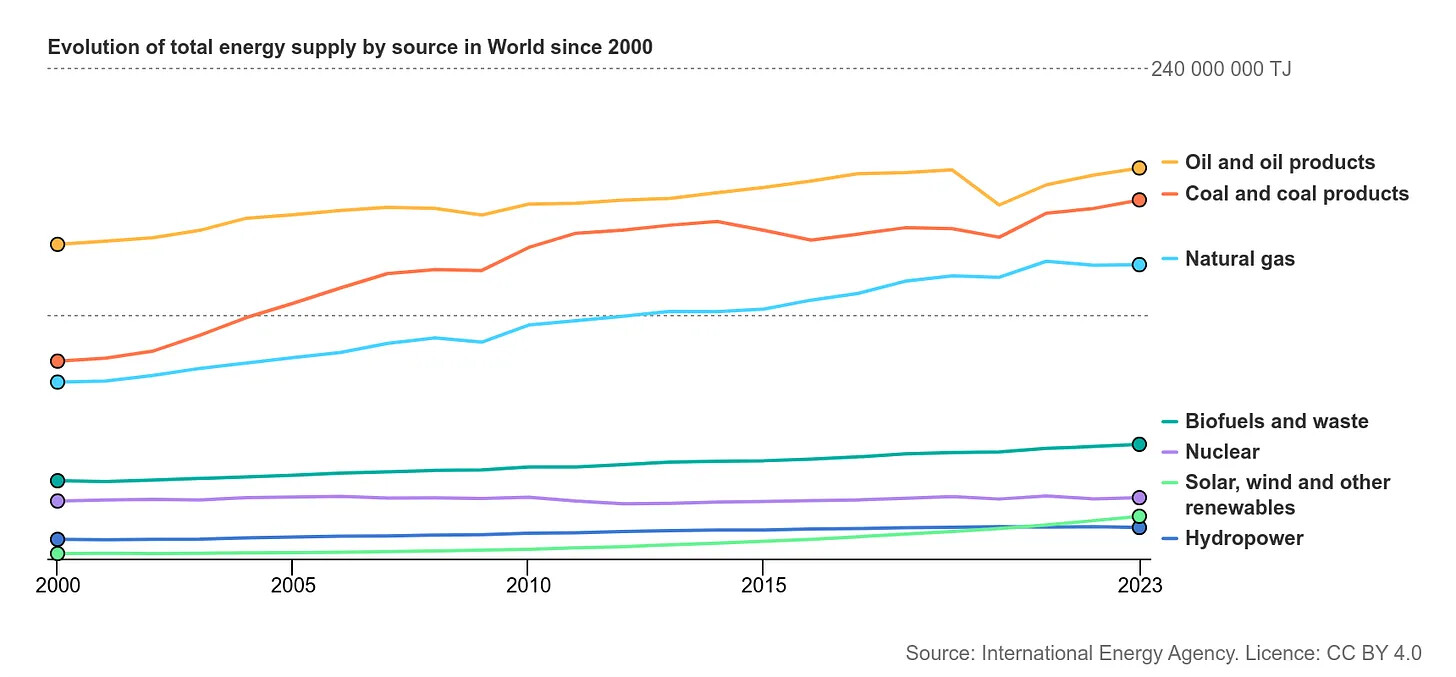
Influenced by Vaclav Smil’s work How the World Really Works and Power Density , I’ve come to appreciate that energy transitions are decadal processes, not overnight revolutions. The shift from coal to oil, for instance, took roughly 60 years to reach 25% of global primary energy supply. Oil’s share peaked at 45% in 1970 and has slowly declined to ~30% today. That decline will continue.
But the relevant question for a country like India isn’t whether renewables will grow - undoubtedly, they will. The question is whether they can serve the energy needs of a large, industrializing nation alone. Despite decades of growth, solar and wind still contribute less than 7% of global primary energy. As Smil writes, “Energy transitions have been, and will continue to be, protracted affairs because of the enormous scale of the shift. ”
Understanding these constraints is essential for evaluating which companies genuinely benefit from the transition versus those riding narrative momentum.
Many companies are riding the energy transition wave - manufacturers of solar panels, wind turbines, inverters, and the like. But their valuations reflect the investors’ enthusiasm. I reckon that I’m late to this party. I missed the opportunity of participating early in this massive capex upcycle. Entering now means exposure to asset-heavy companies facing commoditization risk and potential oversupply.
The better approach is to find a business that benefits indirectly from this tailwind while enjoying some durable competitive advantage - a tollbooth rather than a truck on the highway.
A Fallen Darling
The company I have in mind is IEX, the Indian Energy Exchange.
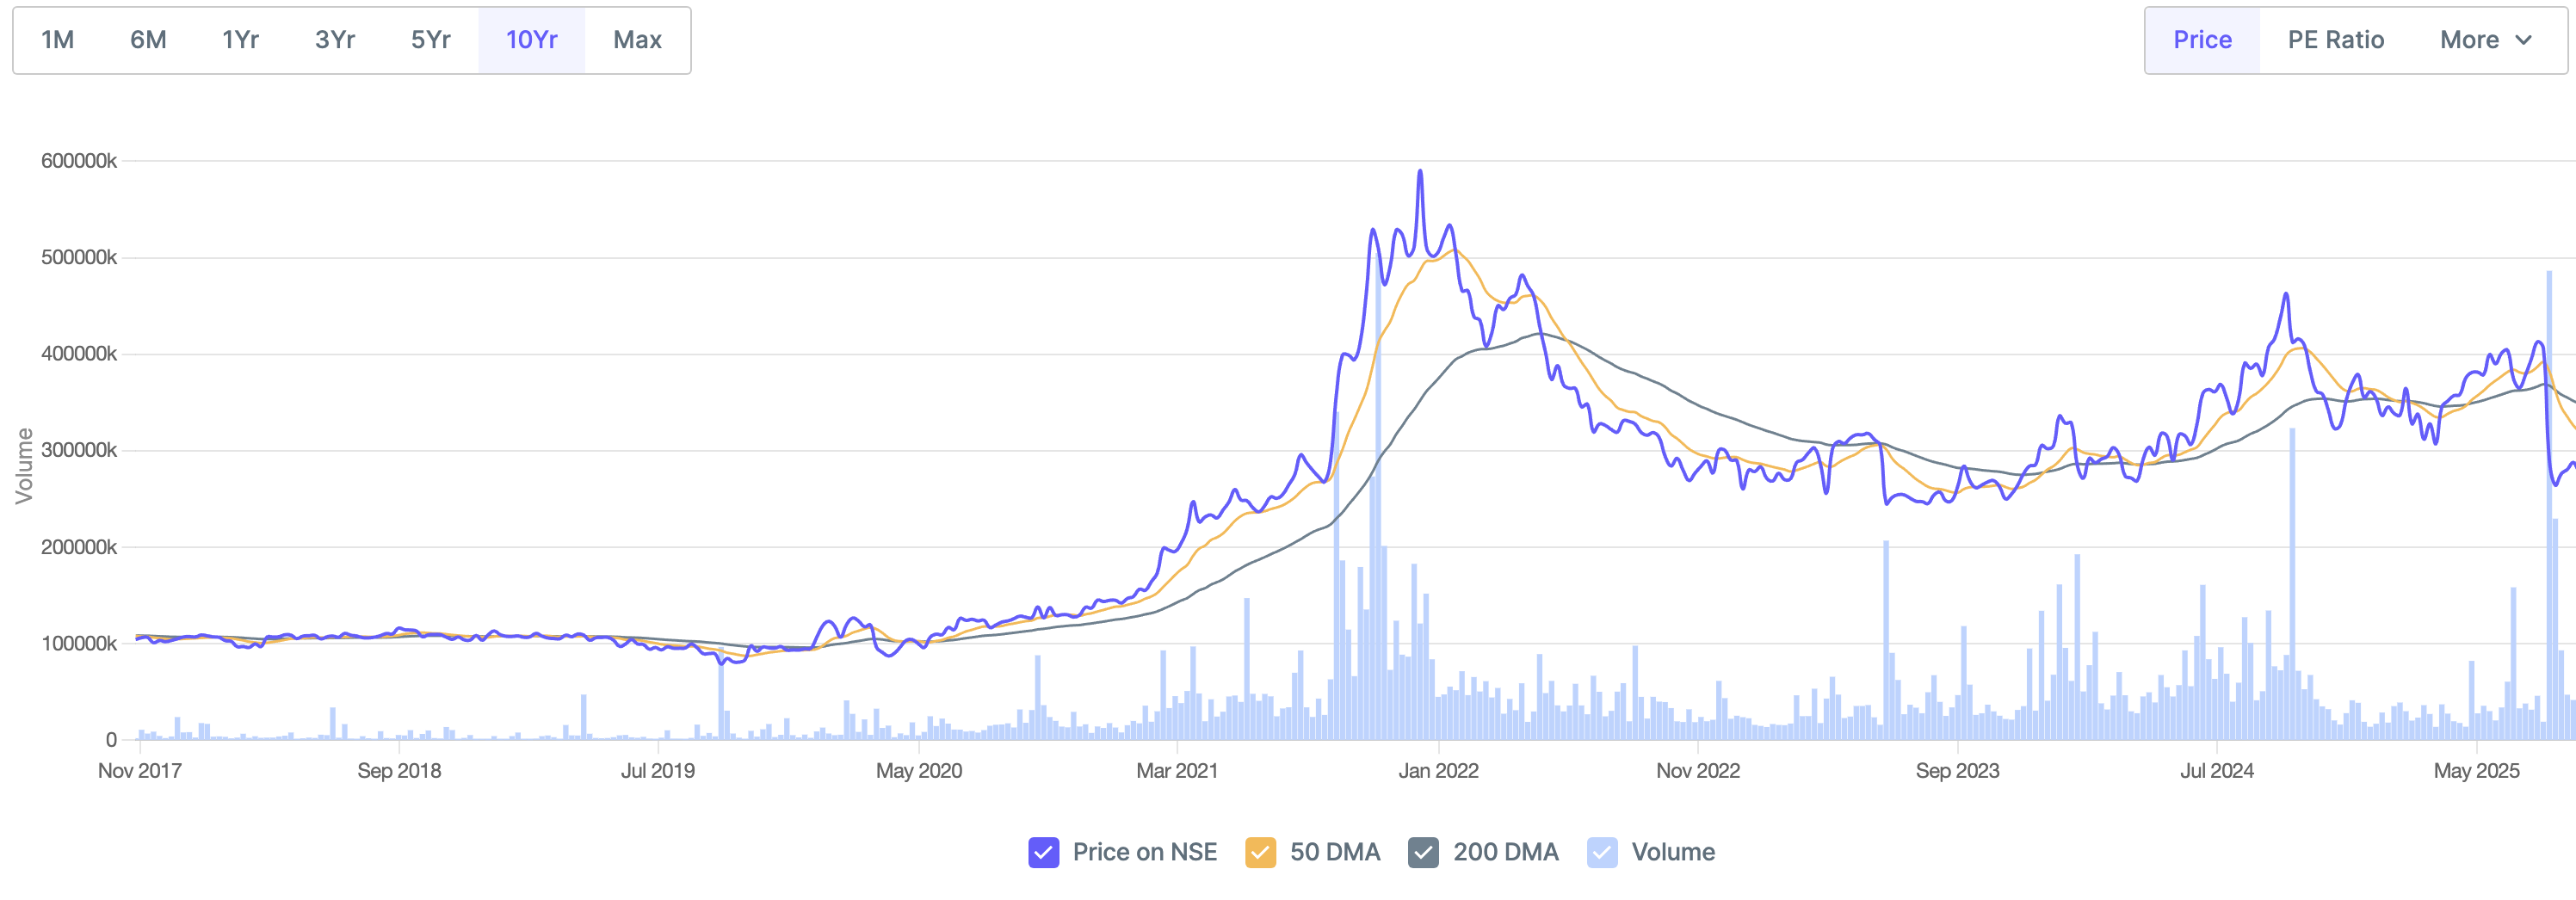
Until 2022, it was a darling of both institutional and retail investors - a rare Indian platform business with exceptional 80%+ EBITDA margins and 80%+ share in total volumes traded among exchanges. Then came the clouds of regulatory headwinds, the narrative broke, and the stock price halved in a few months.
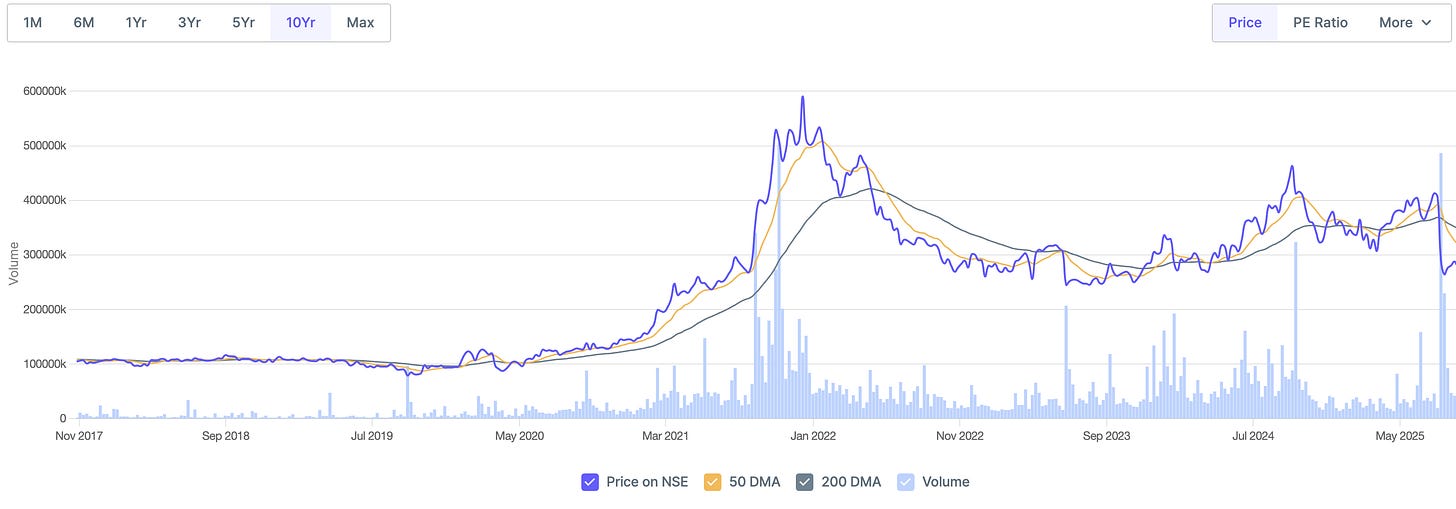
Source: Screener
The bears aren’t wrong about the facts. The bear case is fairly easy to articulate and sounds absolutely logical -
“IEX is a monopoly exchange about to lose its monopoly. Market coupling (loss of price discovery) will let participants trade on any exchange with the same price. IEX’s 95% market share will collapse. The competitive advantage is gone. Game over. Sell.”
So why write a deep dive on a company that seems destined for mediocrity? Because I believe the bears are missing the nuance of how the grid is evolving.
Before we look at the stock, we have to look at the grid.
Disclaimer: I may hold positions in the companies/sectors discussed. This analysis is purely educational; I’ve been wrong before, and outcomes are uncertain. Please don’t construe this as investment advice.
Inside the Grid
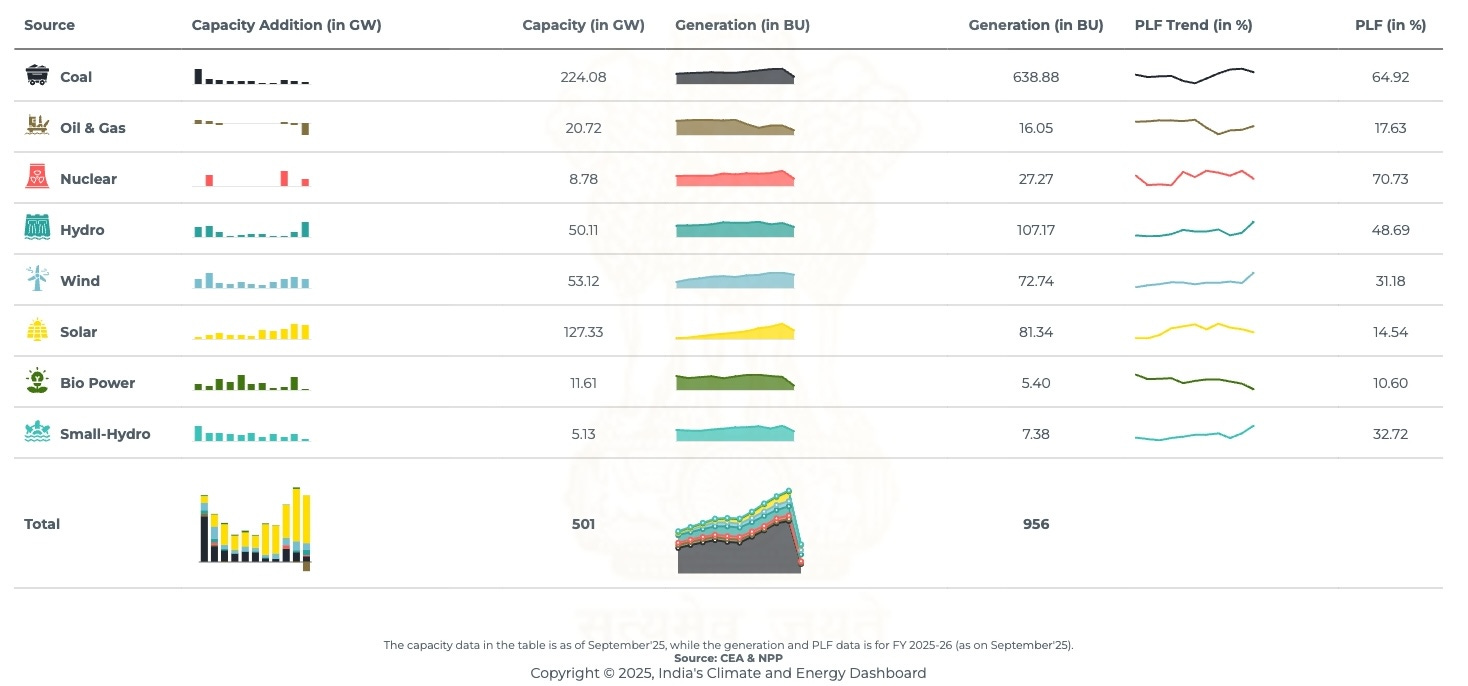
India’s installed power capacity stands at 501 GW as of September 2025.
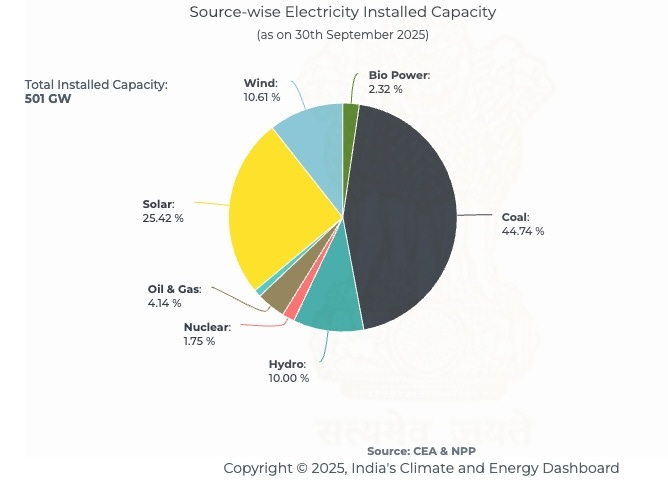
Capacity additions over the past seven years have been dominated by renewables . Approximately 120 GW was added between FY19 and FY25, with solar leading at 84 GW, followed by wind at 16 GW.
India’s installed capacity is expected to reach 700-710 GW by FY30, requiring net additions of 230 GW over five years. As per CRISIL’s estimates, over 80% of this, i.e, ~190 GW will come from renewable sources (excluding large hydro).
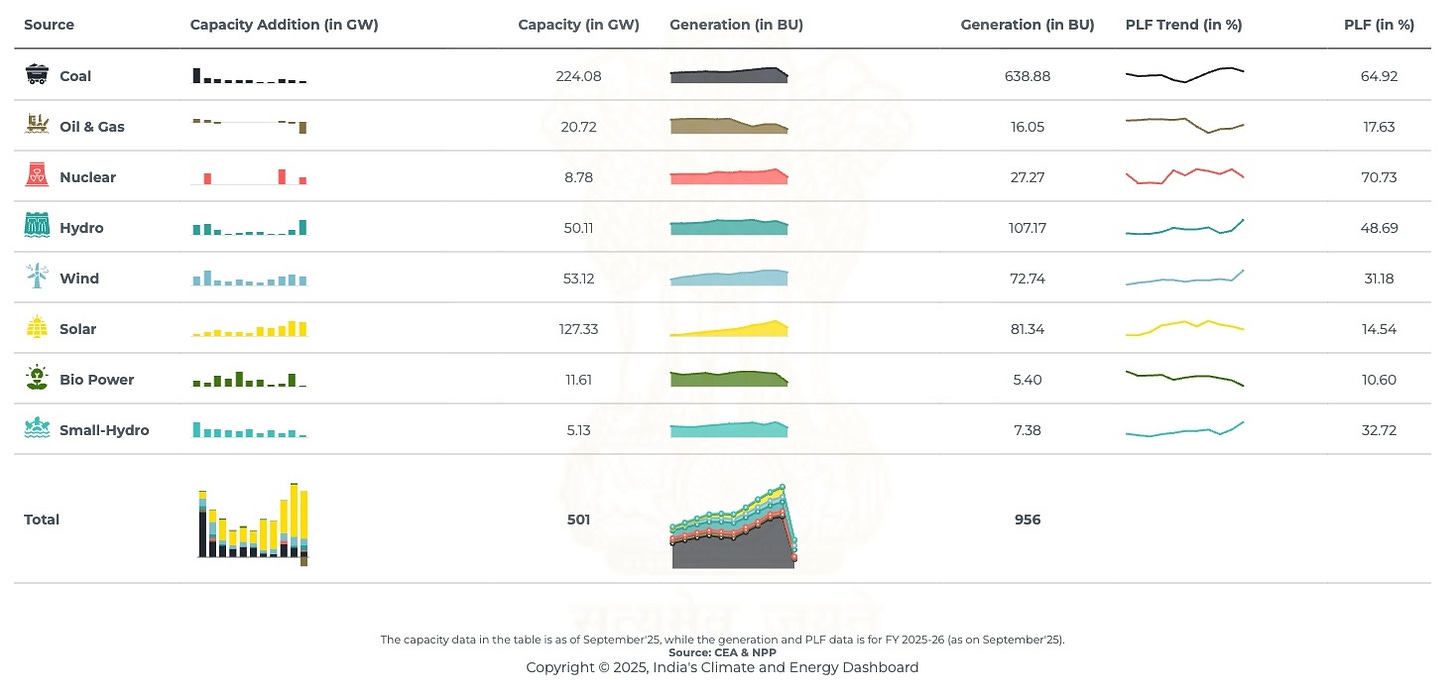
But capacity is not generation. A gigawatt of solar capacity is not equivalent to a gigawatt of coal capacity in terms of actual electrons delivered to the grid. Consider Solar power - while it contributes about a quarter of the installed capacity, it accounts for only 8.5% of actual generation.
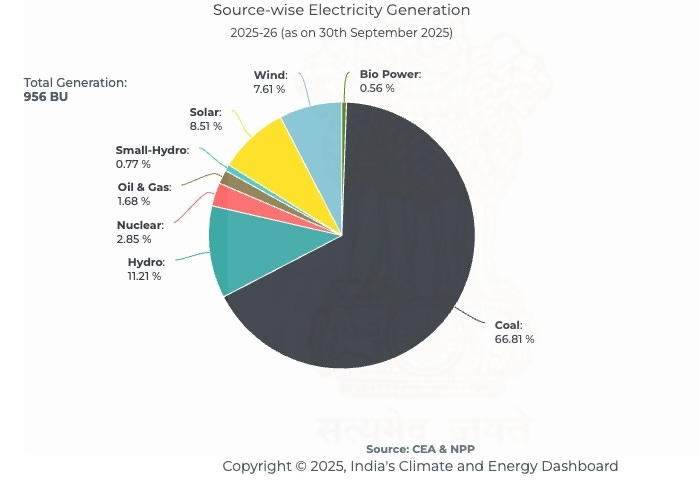
This is why it’s crucial to consider plant load factor (PLF), which is the ratio of actual electricity generated to the maximum possible if the plant ran at full capacity around the clock.
Nuclear runs at 70-80% PLF, coal at 55-75%, hydro at 30-40%, and solar at 15-25%. Solar’s plant load factor is inherently low because the sun shines only during daytime.
This distinction matters because variable renewables’ share in the grid has risen from 5.6% in FY16 to nearly 14% today . Solar and wind are clean, abundant, and increasingly cost-competitive. But they share a fundamental problem: the sun doesn’t shine at night, and the wind doesn’t blow on command. Hence the term intermittent.
Extreme weather events compound this uncertainty as experienced this year amid extended monsoon around the country.
This intermittency makes the lives of grid operators difficult. Balancing supply and demand in real-time, managing transmission infrastructure, and ensuring power availability when consumers need it most become challenging. Unreliability has been the fundamental barrier to renewables fully replacing conventional thermal power (also called baseload).
To replace one reliable gigawatt of coal, you do not build one gigawatt of solar. You must build three or four gigawatts of solar, plus wind, plus storage, to hope to match the reliability of the fossil fuel you are replacing.
These challenges can be somewhat addressed through Firm and Dispatchable Renewable Energy (FDRE). In simple terms, you add a huge battery (energy storage systems) in the mix to store and draw power. This reduces the problem of unreliability. Let’s see how:
Consider a typical day.
- In the morning, solar is ramping up slowly while demand surges as people wake up and head to work. The battery discharges to fill the gap.
- During afternoon, sun’s blazing at full power but demand is moderate, so the battery charges with excess generation.
- In the evening, solar drops to near zero when demand is peaking, so the battery discharges again.
- At night, wind continues generating while demand is lowest. The battery may charge if wind exceeds requirements.
FDRE/Hybrid power is important for power distribution companies (Discoms) because they want stable power. They expect that reliability of RE should come close to a conventional, reliable power plant
- Firm Power: Power that is always available (Baseload reliability).
- Dispatchable Power: Power that can be ramped up or down on demand.
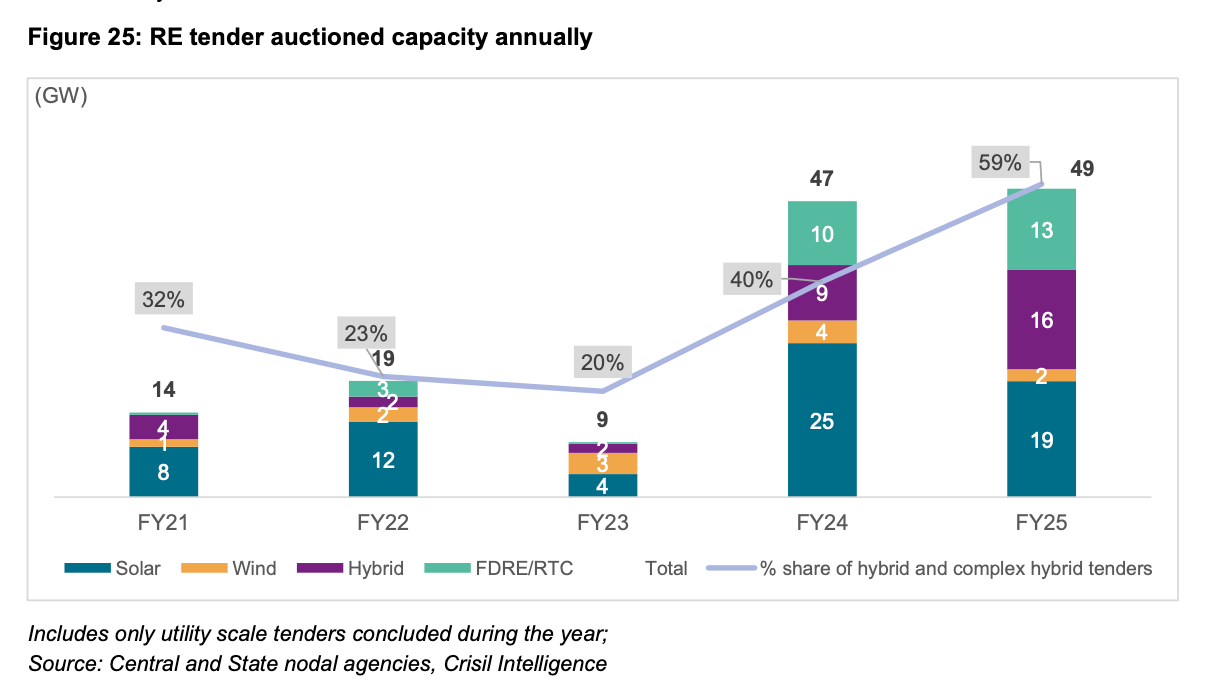
The share of hybrid and complex RE tenders (like FDRE) has jumped from 32% in FY21 to 59% in FY25.
How FDRE Contracts Work? On a typical day, Discoms present their energy requirements at intervals of 15 minutes (96 times a day). Developers must meet a 90% Demand Fulfillment Ratio (DFR) on a monthly basis. The penalty for missing this is severe: 1.5x the PPA tariff of the undelivered energy.
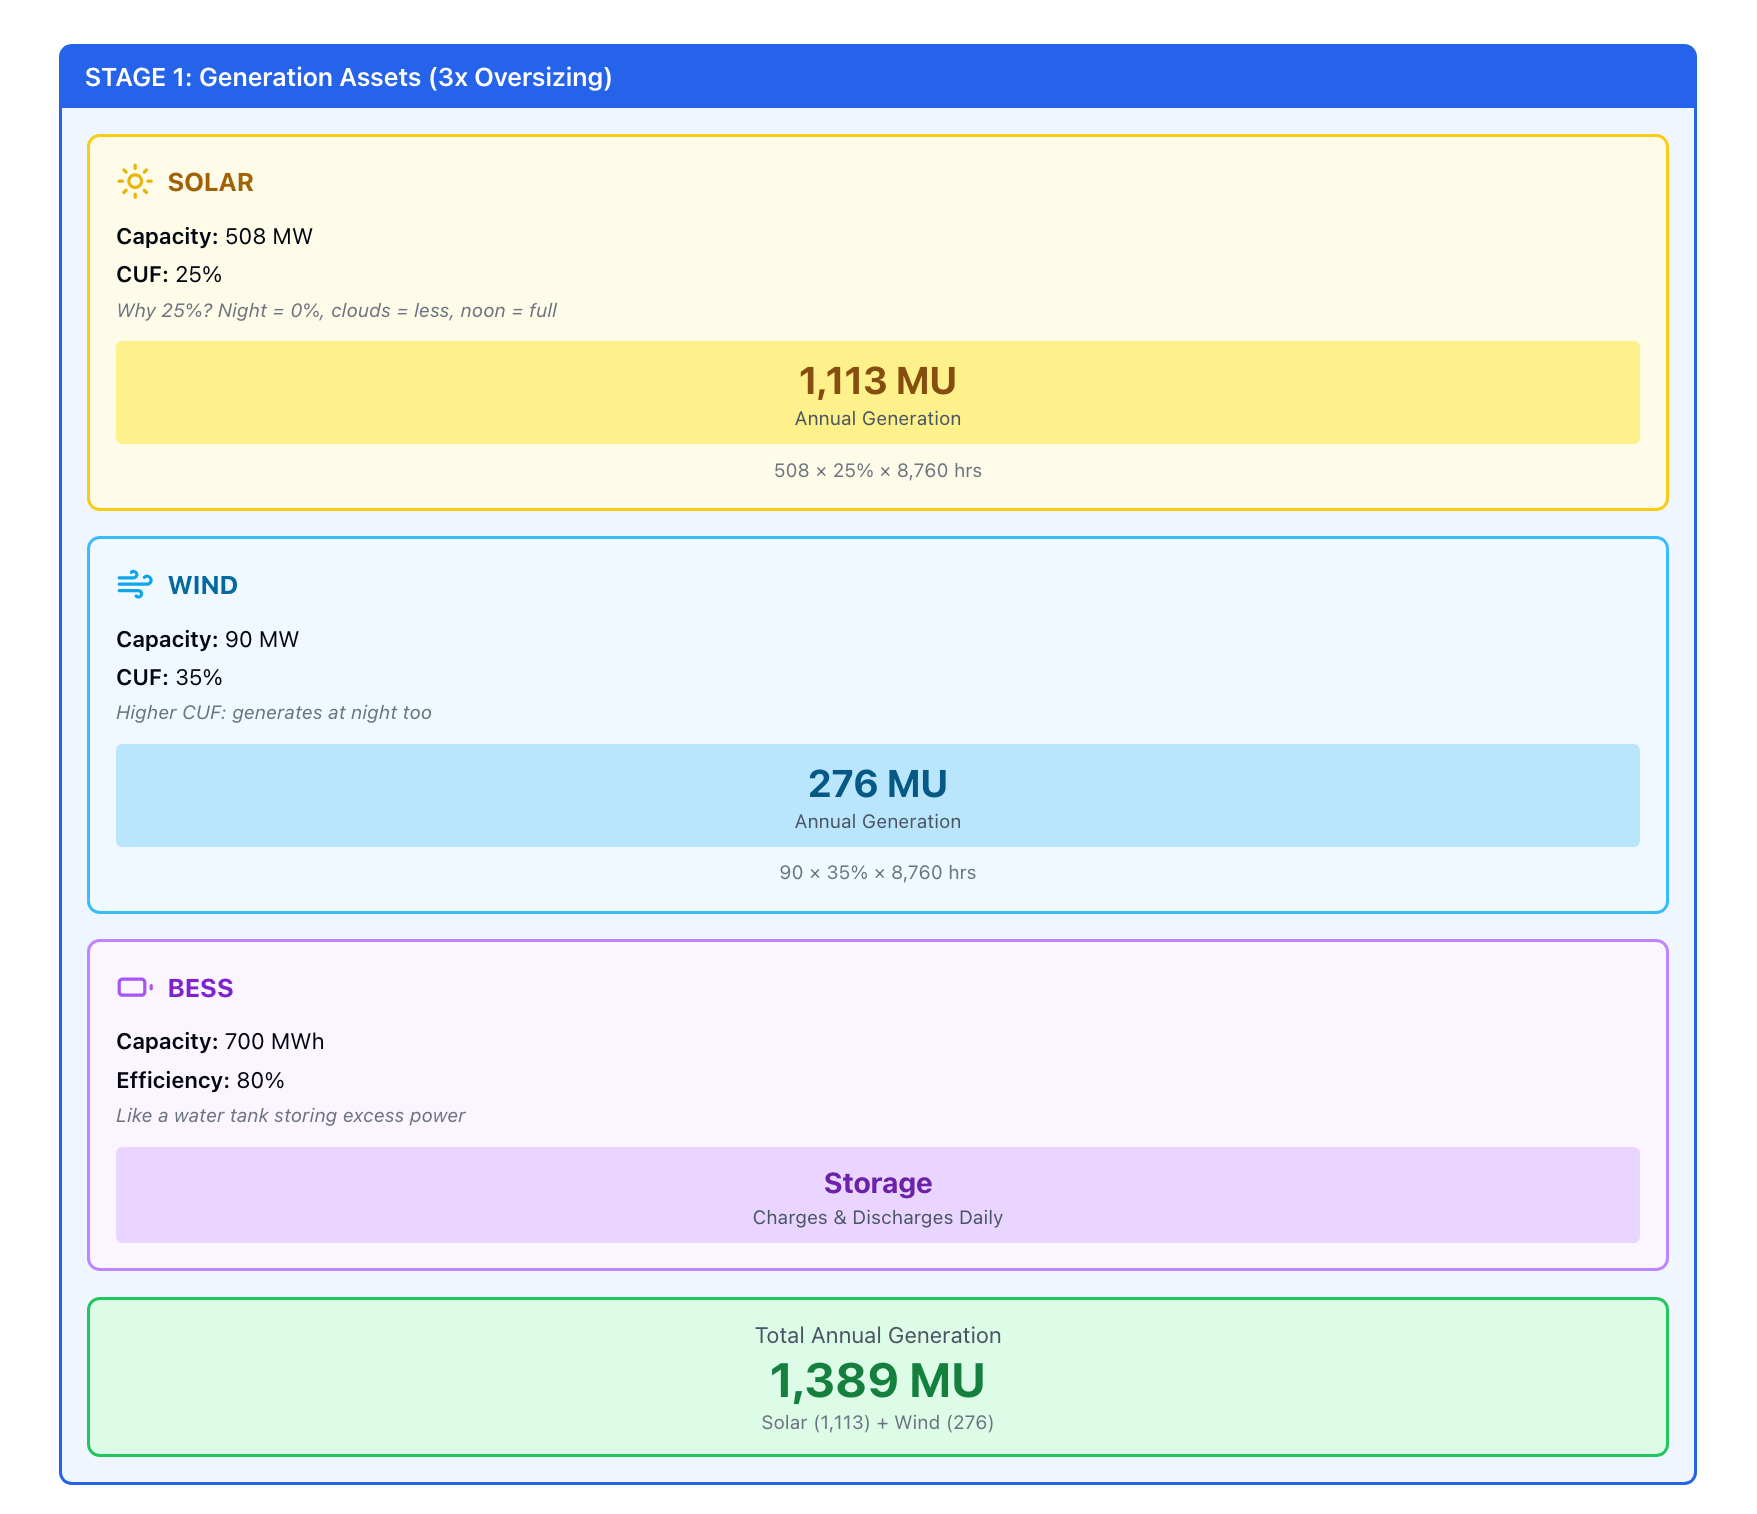
Now, let’s assume that you’re a developer who is building a FDRE project to deliver 250MW (contracted capacity). Since you already know that renewable energy is intermittent, and you don’t want to pay the penalties, you decide to install more capacity.
- Solar: 508 MW
- Wind: 90 MW
- Battery: 700 MWh
Generation
There are 8,760 hours in a year (365 days × 24 hours). Here’s what each component produces:
- Solar Generation: 508 MW × 25% × 8,760 hours = 1,113 MU per year (On average, producing 127 MW every hour, all year long)
- Wind Generation: 90 MW × 35% × 8,760 hours = 276 MU per year (On average, producing 31.5 MW every hour, all year long)
Battery: 700 MWh
This is the project’s reservoir: think of it as a giant tank that stores excess electricity when generation exceeds demand, then releases it when the grid needs power but the sun isn’t shining.
Total Generated = 1,389 MU per year
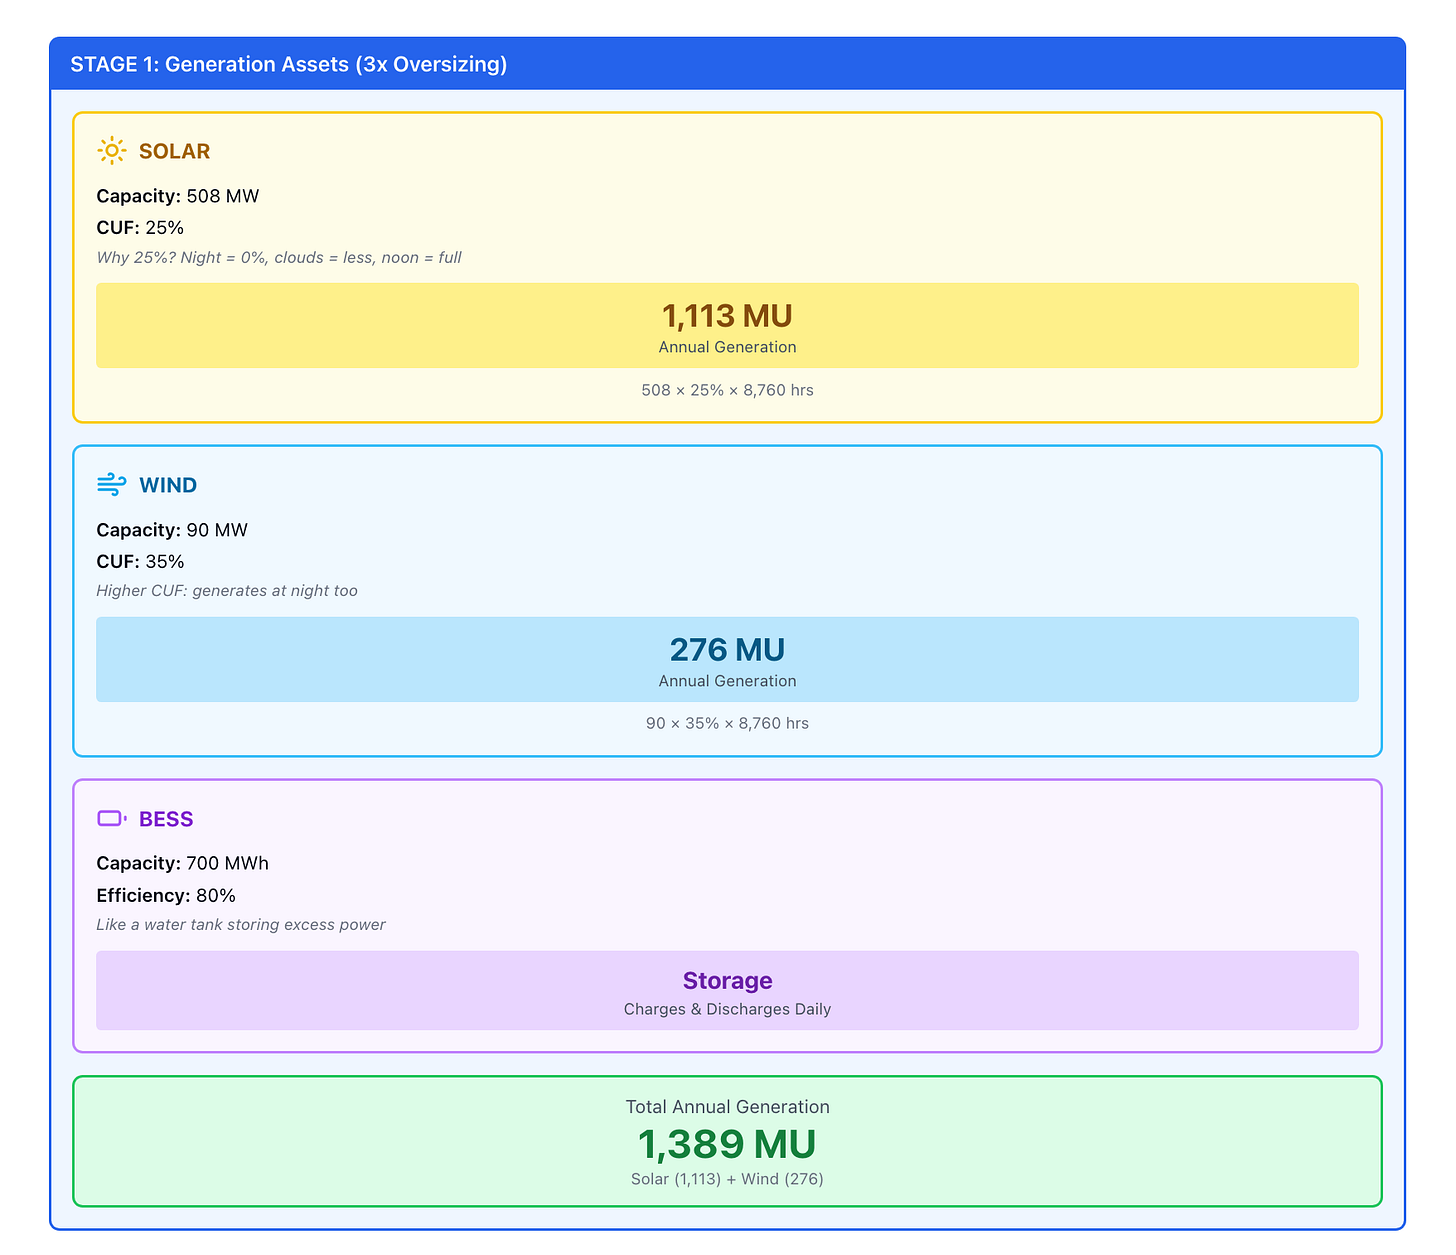
Generated using Claude.ai
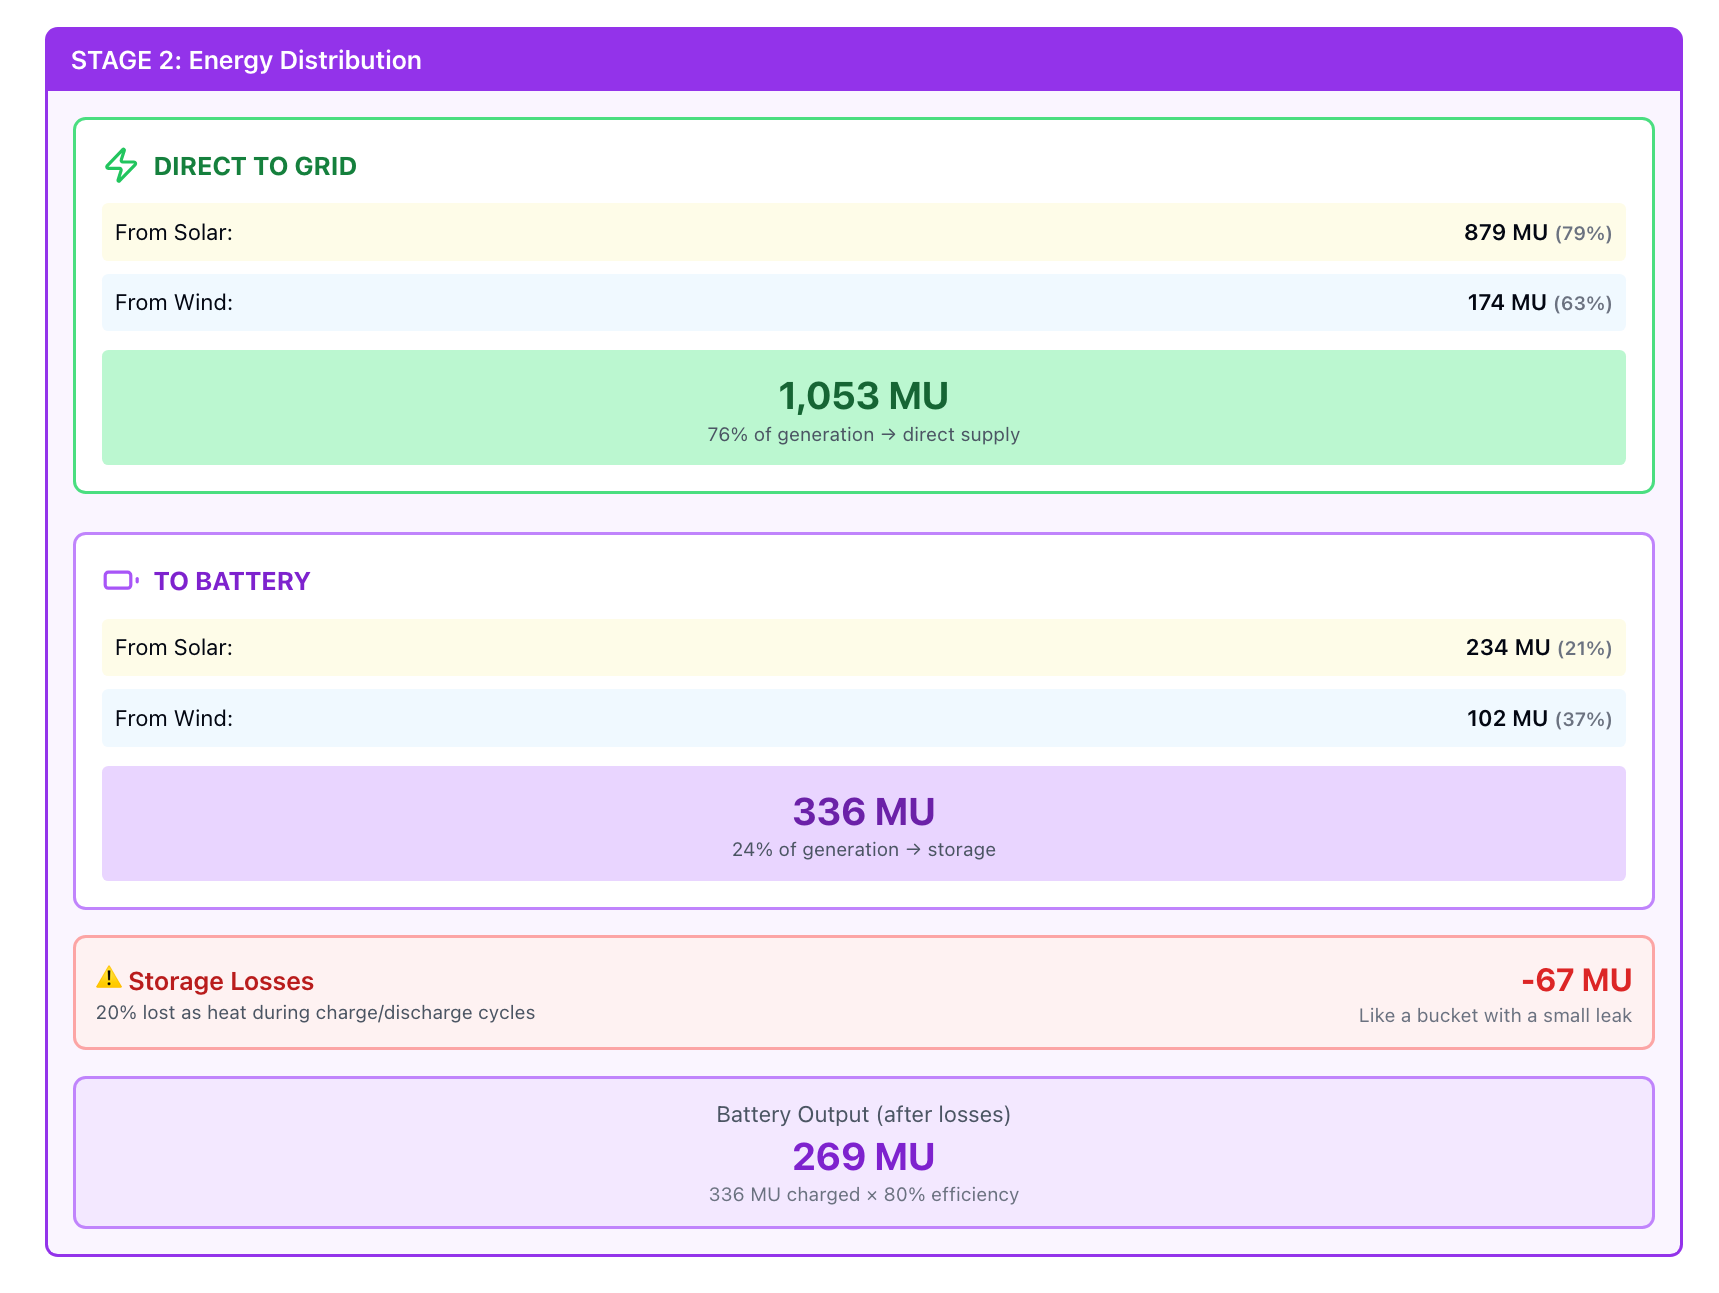
Distribution
Not all generated energy goes directly to the grid. Around a quarter is routed for battery charging.
Why does wind contribute proportionally more to storage (37% of its output) compared to solar (21%)? Wind generation often peaks during nighttime hours when demand is low, requiring more storage. Solar generation aligns better with daytime demand, allowing more direct supply.
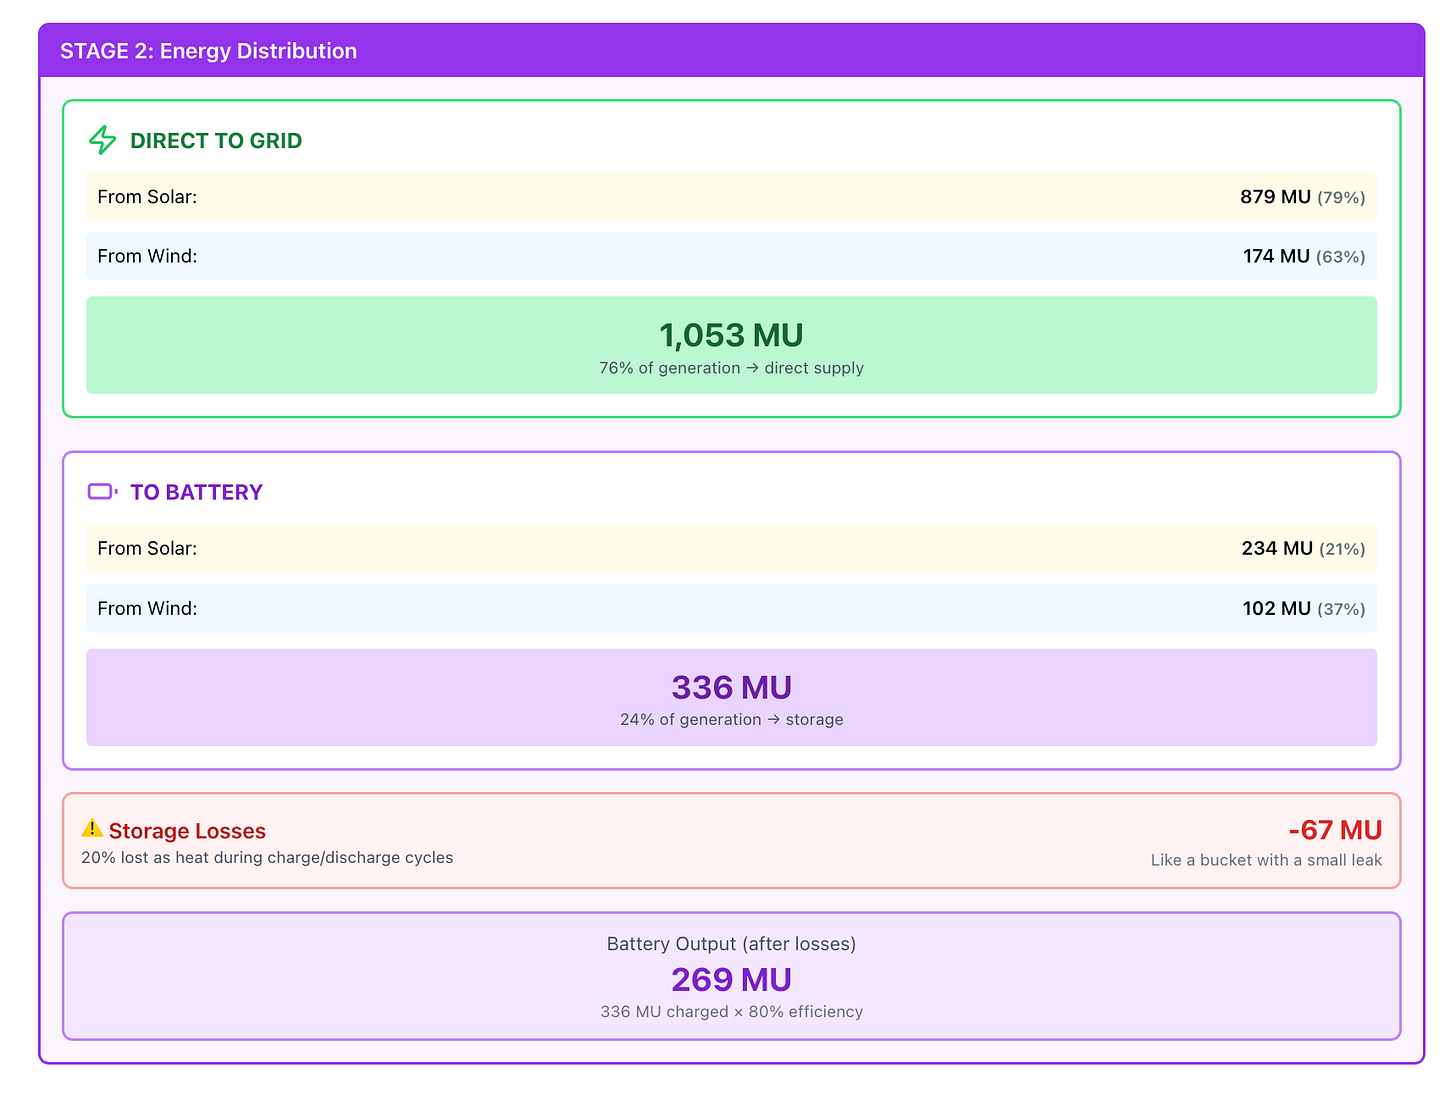
Generated using Claude.ai
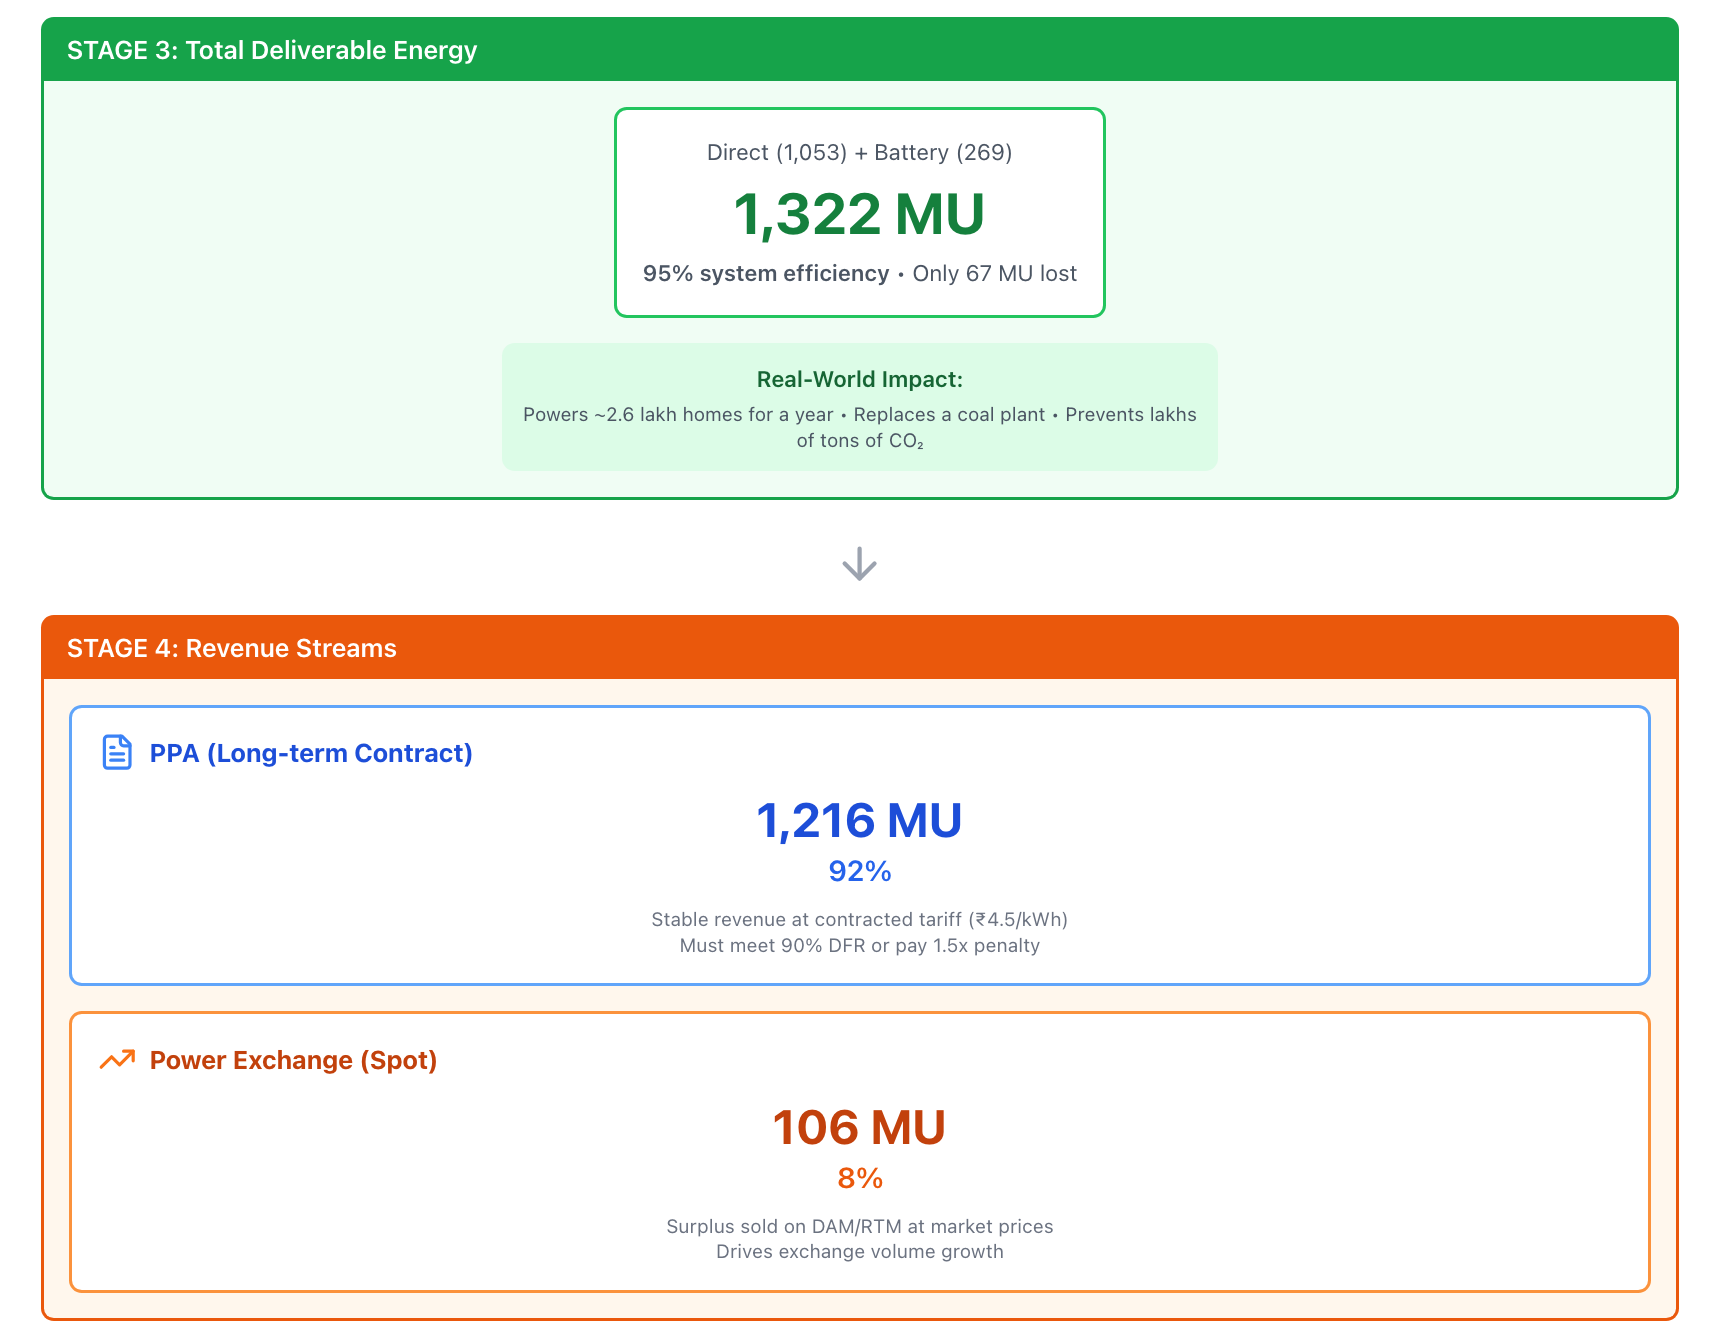
Deliverable Energy
The project sells roughly 92% through long-term PPAs and 8% on the power exchange at spot prices. That 8% sold on spot markets isn’t incidental, it’s structural.
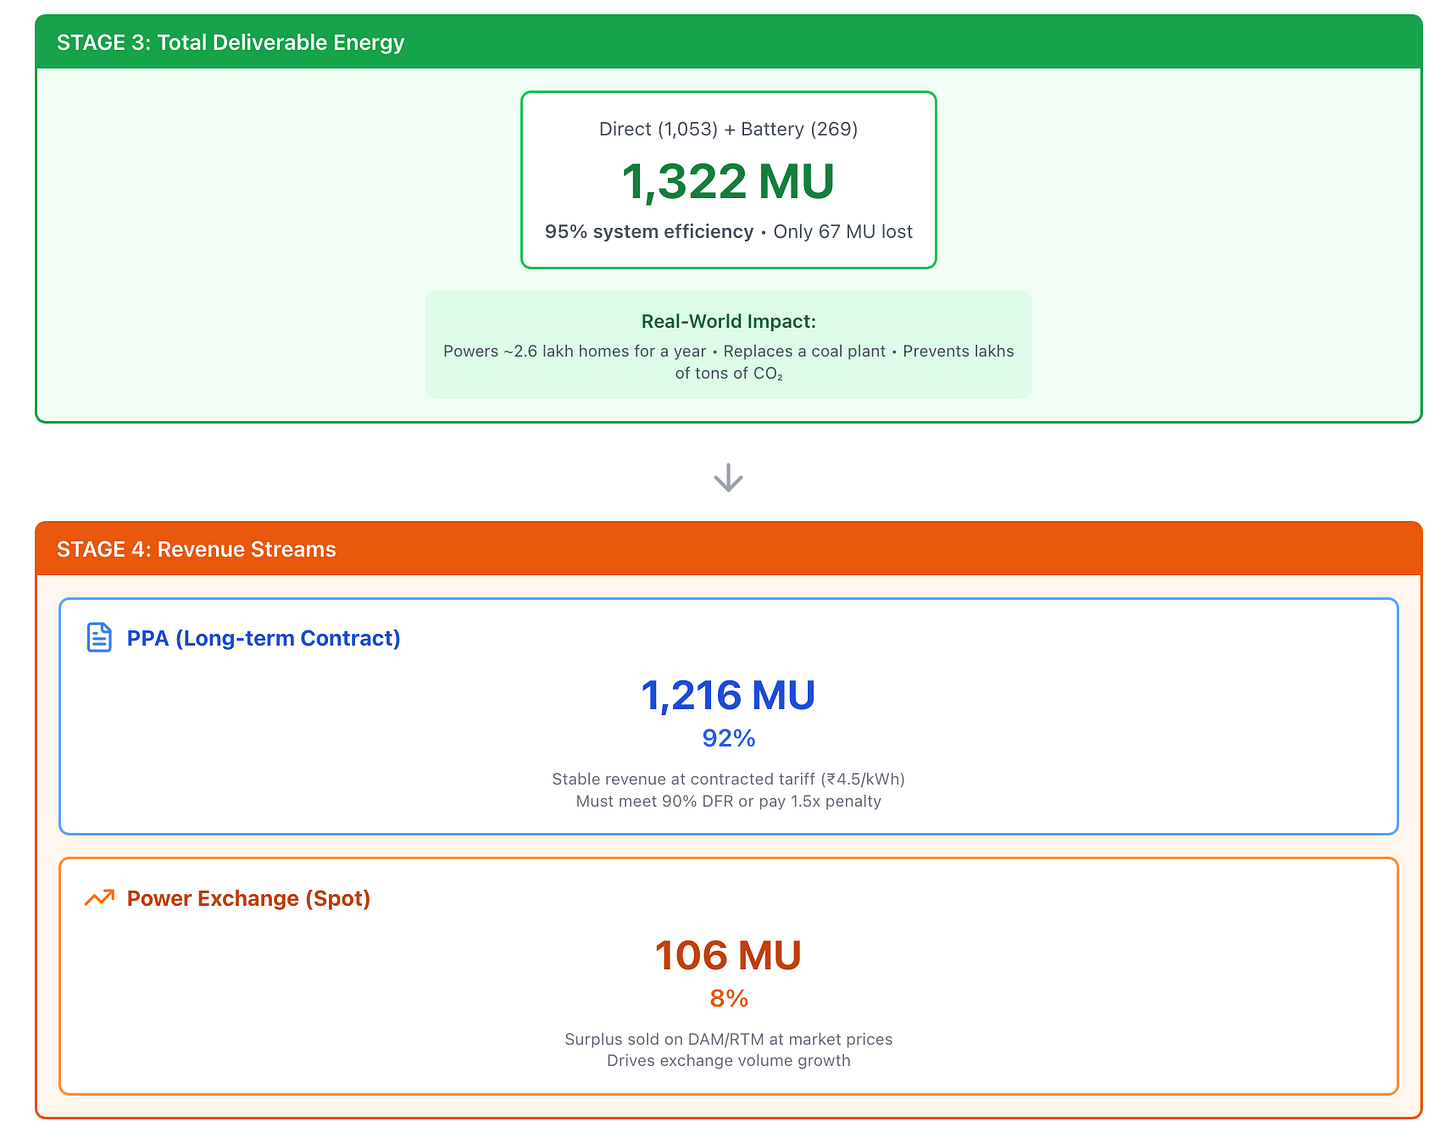
Generated using Claude.ai
I hope you’re still with me.
The Flywheel Spins
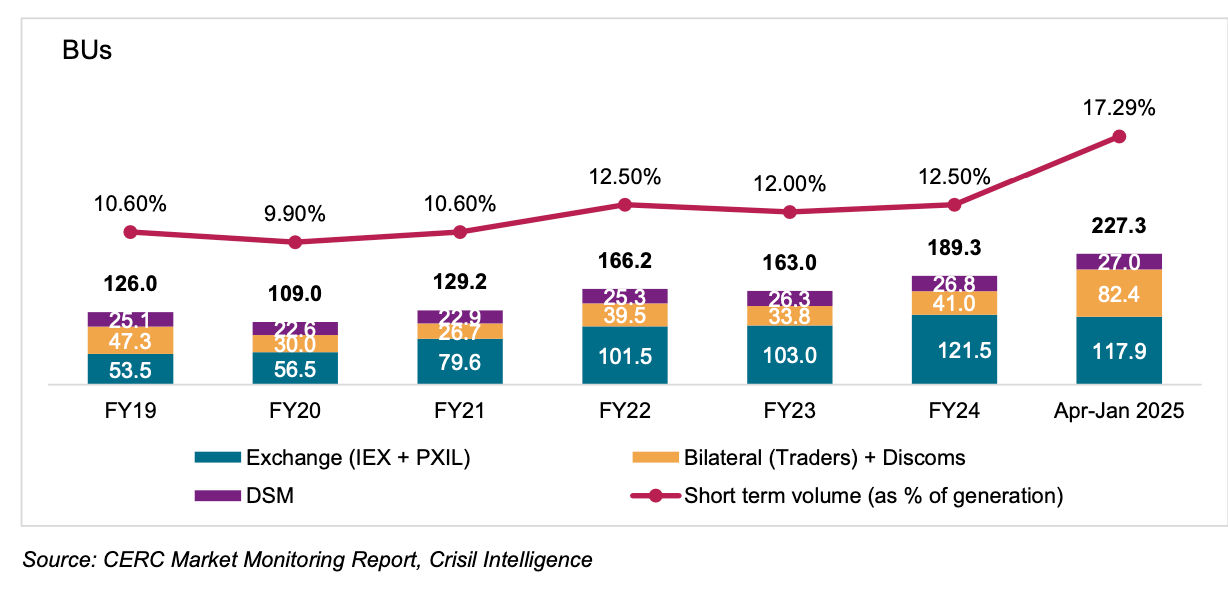
Approximately 87% of electricity in India is transacted through power purchase agreements (PPAs). PPAs are long-term contracts (15-25 years) between generators and distribution companies that provide revenue certainty for project financing but offer little flexibility. The remaining 13% trades in short-term markets, which comprise three channels:
- Bilateral contracts negotiated directly between buyers and sellers (typically for weeks or months),
- Deviation settlement mechanism (DSM) charges for real-time imbalances between scheduled and actual generation, and
- Power exchanges
The share of transactions through power exchanges has grown at 18% CAGR - from 54 BU in FY19 to 122 BU in FY24.

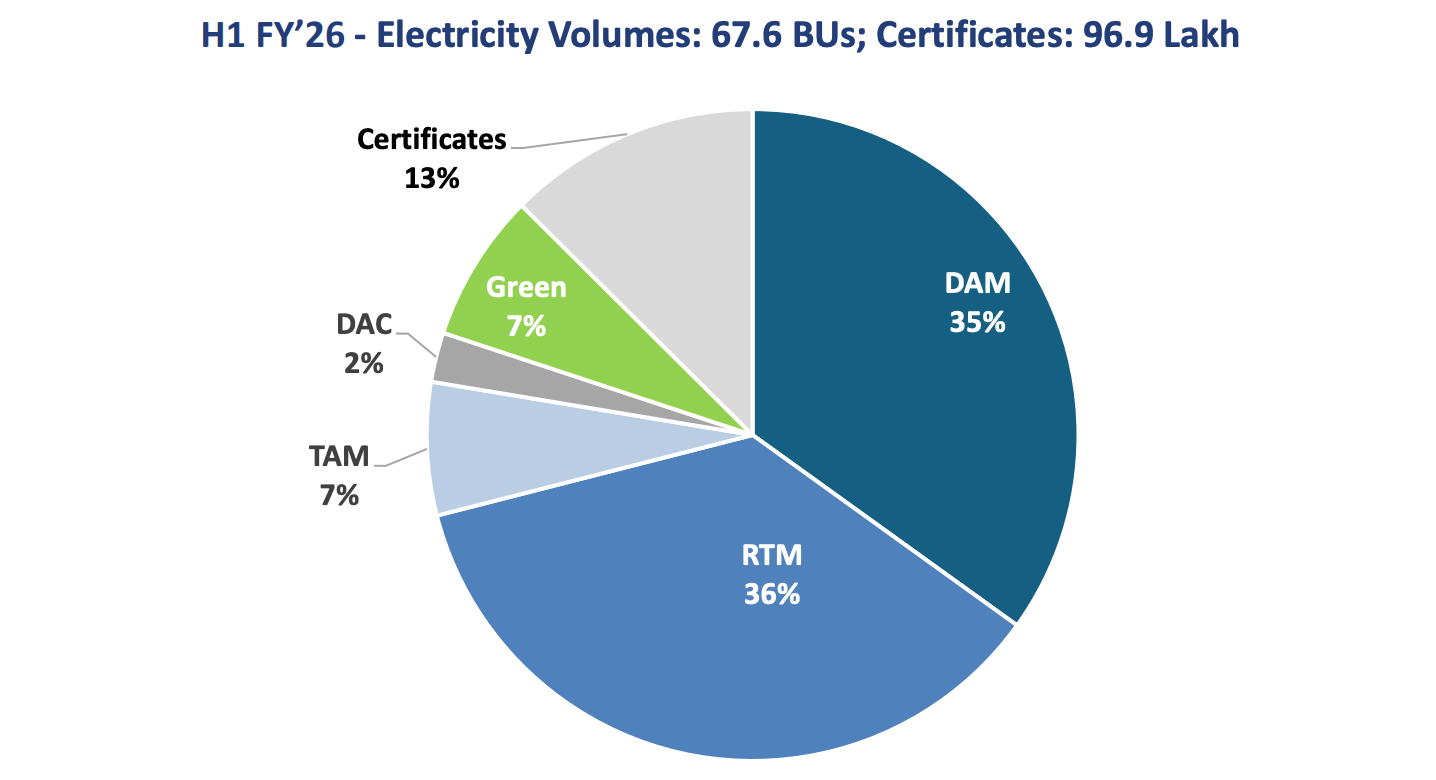
IEX is the leading power exchange. When a power plant in Gujarat has excess electricity at 2 PM because it’s sunny and demand is low, and a factory in Tamil Nadu needs power at that moment, IEX connects them. The plant sells, the factory buys, and IEX takes 4-5 paise clip per unit traded. That’s the crux of IEX’s business model. IEX operates across multiple market segments, each serving different trading needs.
- The Day-Ahead Market (DAM) is the foundational product—participants bid a day in advance for delivery in 15-minute time blocks the following day.
- The Real-Time Market (RTM), launched in 2020, allows trading just one hour before delivery, enabling generators and discoms to balance deviations from their day-ahead positions.
- The Term-Ahead Market (TAM) facilitates contracts ranging from intraday to 11 days ahead for participants seeking slightly longer horizons.
- Beyond electricity, IEX operates the Green Day-Ahead Market for renewable energy with explicit green attributes, and runs auctions for Renewable Energy Certificates (RECs) and Energy Saving Certificates (ESCerts) that help obligated entities meet regulatory compliance. The company also holds a majority stake in IGX, the Indian Gas Exchange.

Source: IEX Investor Presentation, Q2FY26
What makes electricity trading extraordinary is a physical constraint: electricity must be consumed the instant it’s produced . You can’t store it economically at scale . You can’t ship it in a truck. Supply and demand must balance every second, or the system collapses. This constraint creates continuous trading opportunities.
IEX is a classic two-sided platform exhibiting strong network effects. Each additional trader increases value for all other participants, creating a self-reinforcing feedback loop :
- More buyers attract more sellers (better prices, faster execution)
- Deeper liquidity attracts more traders (tighter spreads, lower transaction costs)
- Higher volumes enable better price discovery and more reliable clearing
- Better execution attracts even more participants
Pulak Prasad, the founder of Nalanda Capital, describes this phenomenon in What I Learned About Investing from Darwin through Naukri’s dominance in job platforms: “Given Naukri’s dominance, if you are a job seeker in India, you would almost certainly post your résumé there. If you are a company trying to hire, you are almost compelled to subscribe to Naukri because it has the most extensive and diverse pool of candidates.”
He continues: “Naukri is number one because it is number one .” (emphasis mine). This isn’t circular logic: it’s how platforms work. The leader accumulates advantages that become self-reinforcing. Market concentration in platform businesses is a feature, not a bug.
IEX’s dominance follows the same logic. If you’re a power seller, you list on IEX because that’s where the buyers are. If you’re a buyer, you trade on IEX because that’s where the deepest liquidity exists. IEX has near-monopoly in its key segments.
Regulators don’t like that.
Elephant in the room: Market coupling
What is Coupling? Currently, IEX discovers one price, and PXIL (the competitor) discovers another. Coupling means an external agency (led by Grid India) aggregates bids from all exchanges to discover a single national price. This effectively kills the “liquidity moat” IEX has in DAM segment.
The concept of coupling has been under discussion for some time. Expert groups recommended it in 2016, pilots ran in RTM and DAM in 2022-23, and the Central Electricity Regulatory Commission (CERC), the regulator, issued its order in 2025. Until July 2025, the matter was still being debated. Now the writing is on the wall—it’s no longer a matter of if, but when.
Some experts have questioned the motive of enforcing market coupling. A former IAS officer Raj Pratap Singh bluntly observes in his comment to CERC: “Regulatory intervention to change market design to increase volume of non-performing power exchanges is highly unjustified.” CERC itself accepts the same in Section 1.6 of the discussion paper: “the power exchanges with lower liquidity have been advocating for market coupling. ”
CERC, the regulator, looked at three exchanges, saw unequal market shares, and assumed regulatory intervention was required. They possibly overlooked the economic reality of winner-takes-most dynamics in platform businesses. Other Indian exchanges too, demonstrate the power law: NSE has held 90% market share for over 15 years, MCX sustains 95% share despite NCDEX competition. Liquidity begets liquidity.
In a recent seminar on Market Coupling and Electricity Derivatives, organised by MDI Gurgaon, Mr. S R Narsimhan (former CMD of Grid India) said “coupling had been under discussion since 2008 when congestion management emerged as a problem. Expert groups recommended it in 2016, pilots were run in RTM and DAM in 2022–23, and finally CERC issued its order in 2025. The pilots showed that DAM coupling offered only marginal welfare gains (around 0.3 percent) , while RTM+SCED coupling could deliver savings of up to ₹500 crore per month. Despite this, the regulator decided to start with DAM coupling .”
While the rationale for coupling is unclear, the implementation timeline by January 2026 looks ambitious. Prof. René Aïd, Professor of Economics at Université Paris Dauphine, France, sharing the European experience at the same webinar, emphasized that Europe took 10-12 years to achieve market coupling across 25+ countries, with challenges in harmonizing rules and governance. India, with a centralized structure, could move faster, though six months (by January 2026) is very challenging.”
The operational requirements are substantial. The CEO of PXIL - notably, the proponent and biggest beneficiary of coupling - outlined them himself: “standardized bid formats, settlement systems between exchanges, fungible collateral, and a joint governance council with CERC, Grid India, and exchanges .”
Read that again - essentially, CERC will have to regulate not only Grid India (Market Coupling Operator) and the exchanges, but itself. This is a herculean task, in my view.
There’s another crucial detail. Market coupling only applies to DAM. CERC’s July 2025 order explicitly states that coupling of Real-Time Market will be considered at a later stage, based on experience from DAM coupling. Why? Because RTM coupling is much harder technically. DAM trades 24 hours ahead, providing time to run complex matching algorithms. RTM trades 1 hour ahead, requiring near-real-time matching. BESS operators need sub-15-minute execution while coupling systems take 30-60 minutes.
The direction is clear: DAM coupling will happen . But regulatory timelines and operational timelines rarely align. Europe’s experience suggests implementation will take considerably longer than the announced timeline. The more likely outcome is a phased, delayed rollout - giving IEX more runway than the headline suggests.
The Other Side
While the sword of market coupling hangs over IEX’s DAM segment, some developments are structurally positive for non-DAM volumes.
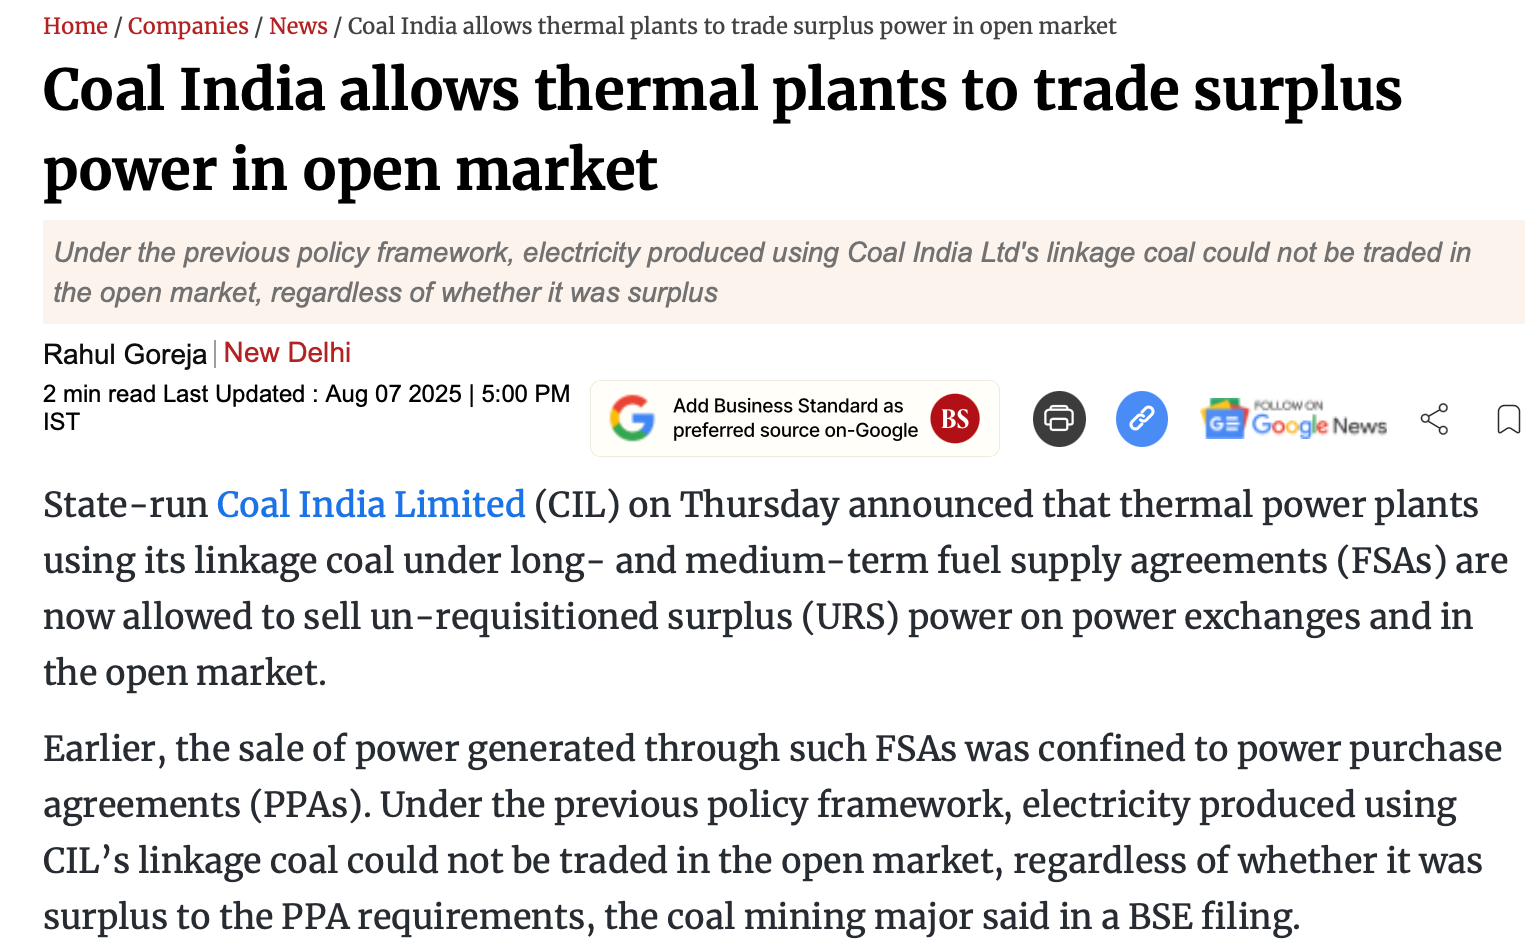
Mandated Supply: The Government of India has mandated that all thermal generating stations must offer unrequisitioned surplus power on exchanges. Subsequently, Coal India allowed open market sale of surplus power under FSA.
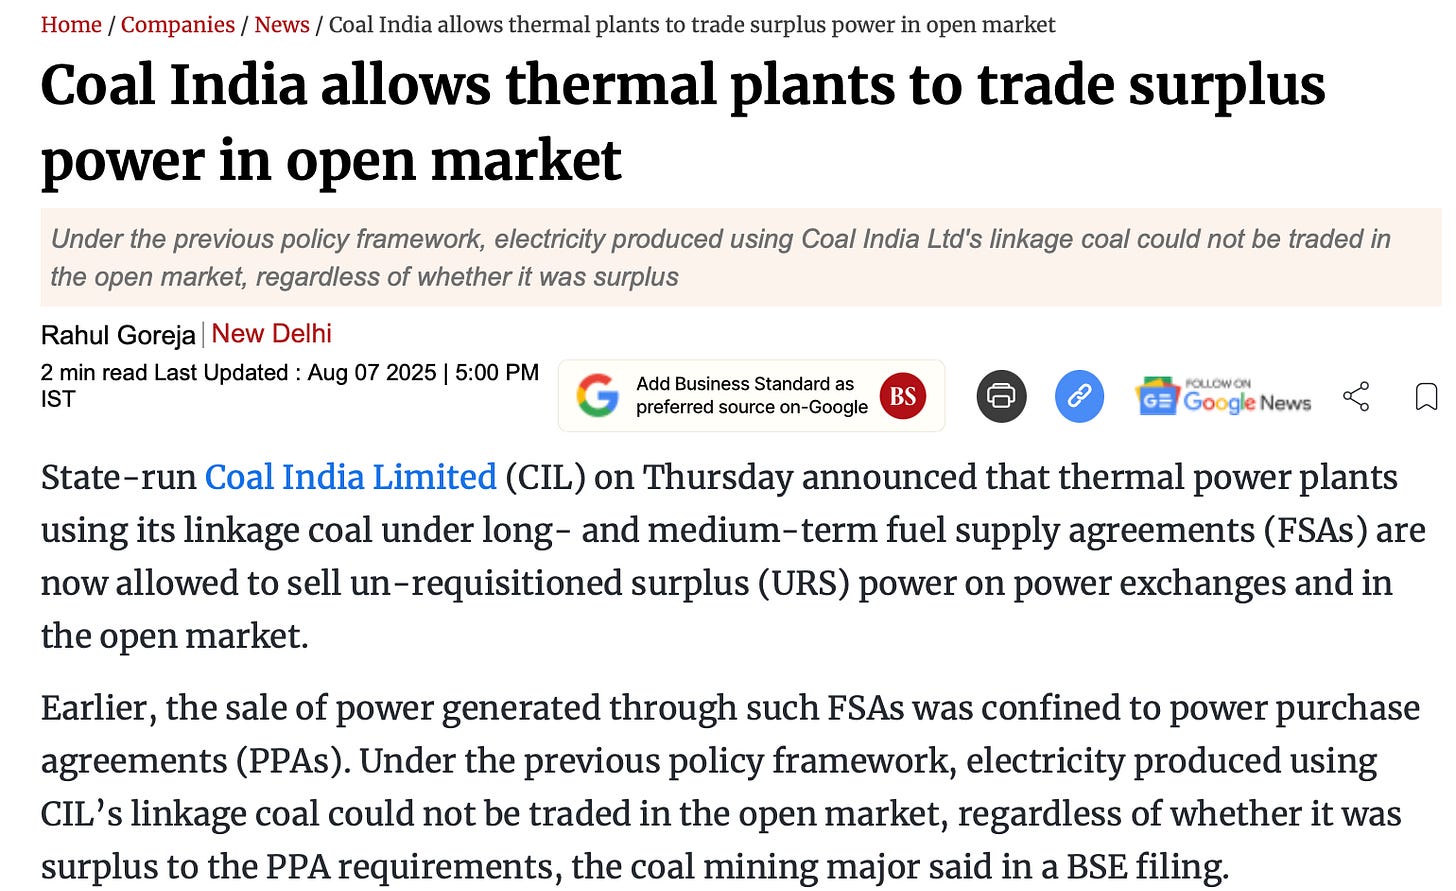
Source: Business Standard
IEX’s management has confirmed the same in its recent quarterly results presentation
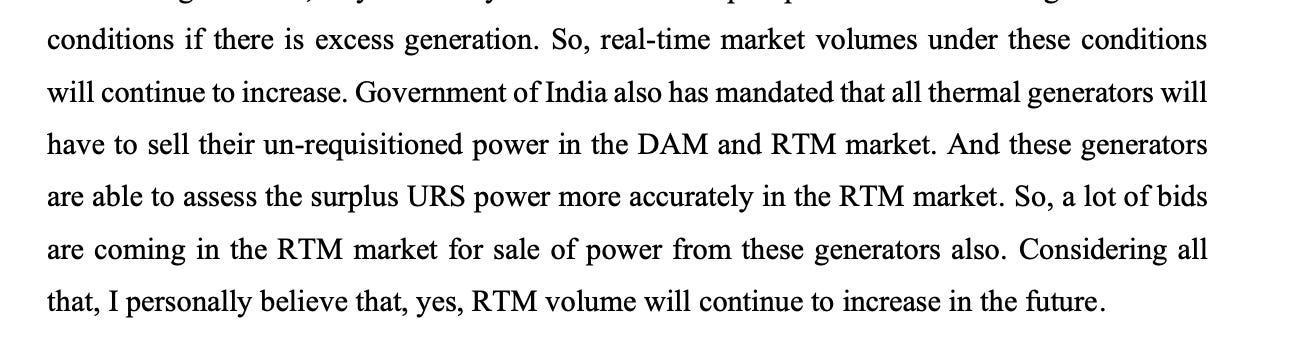
BESS deployment. The Ministry of Power has finalized VGF support for battery storage, with 13,200 MWh awarded and 47 GW targeted by FY32. BESS operators will likely use exchanges. Their buy-low-sell-high arbitrage model is more compatible with power exchanges than bilateral contracts.
FDRE pipeline. Storage-linked tenders grew from 32% of renewable auctions in FY21 to 59% in FY25. Each FDRE project structurally generates surplus that must be sold on exchanges.
The Bet
The investment case for IEX rests on a simple observation: renewable intermittency is a physics problem that creates a structural need for real-time power trading .
Every solar farm that overbuilds to meet FDRE commitments generates surplus that must be sold somewhere . Every BESS operator arbitraging day-night price spreads needs a liquid spot market . Every 15-minute deviation from forecast requires settlement.
IEX is the dominant platform serving this need, with over 80% market share built over 17 years of compounding network effects. The Real-Time Market is growing at a fast clip driven by factors mentioned in the sections above.
The risks are real. Market coupling will compress DAM share. Regulatory uncertainty won’t disappear. Another related risk is apathy among the institutions. When regulators strike, institutional investors often flee regardless of fundamental merit. The reputational and compliance risks of holding a stock under regulatory scrutiny outweigh the potential returns.
However, DAM coupling implementation may not be as swift and smooth as the regulators and bears anticipate.
The question isn’t whether IEX faces headwinds - it does. The question is whether those headwinds are priced in while the structural tailwinds are ignored. The share of DAM volumes in the total volume mix has declined rapidly in the last three years as IEX has successfully launched new products and diversified into other segments.
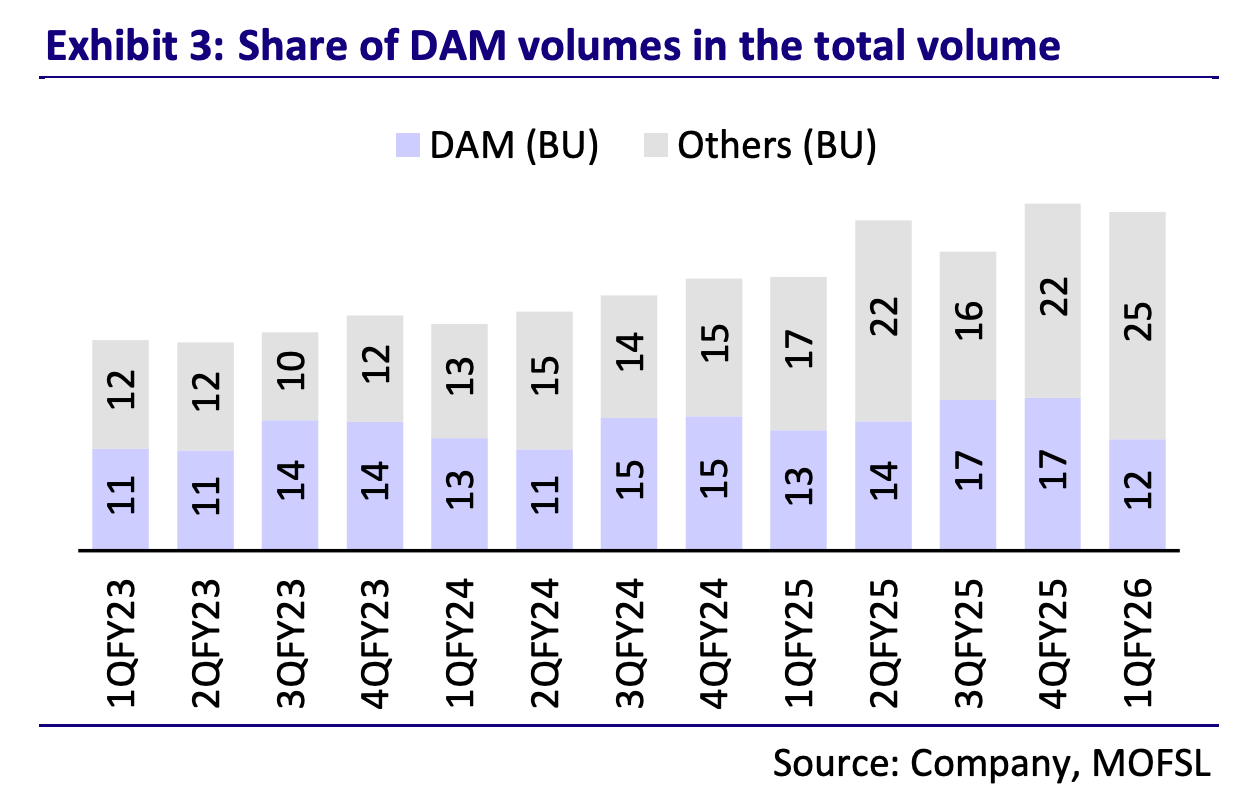
Source: Motlilal Oswal Financial Services
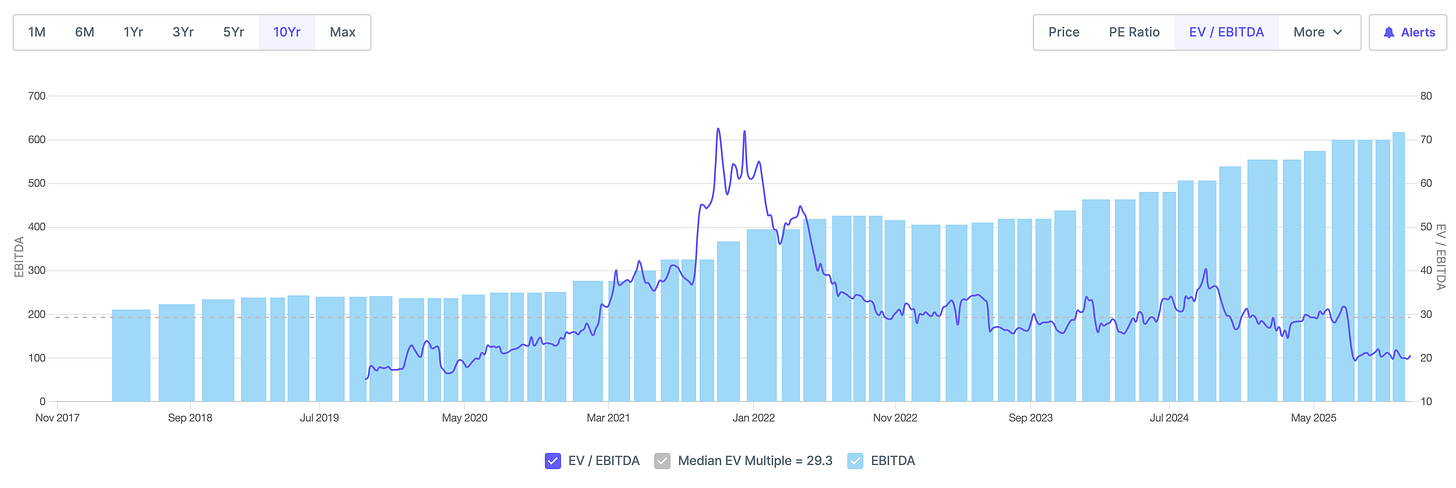
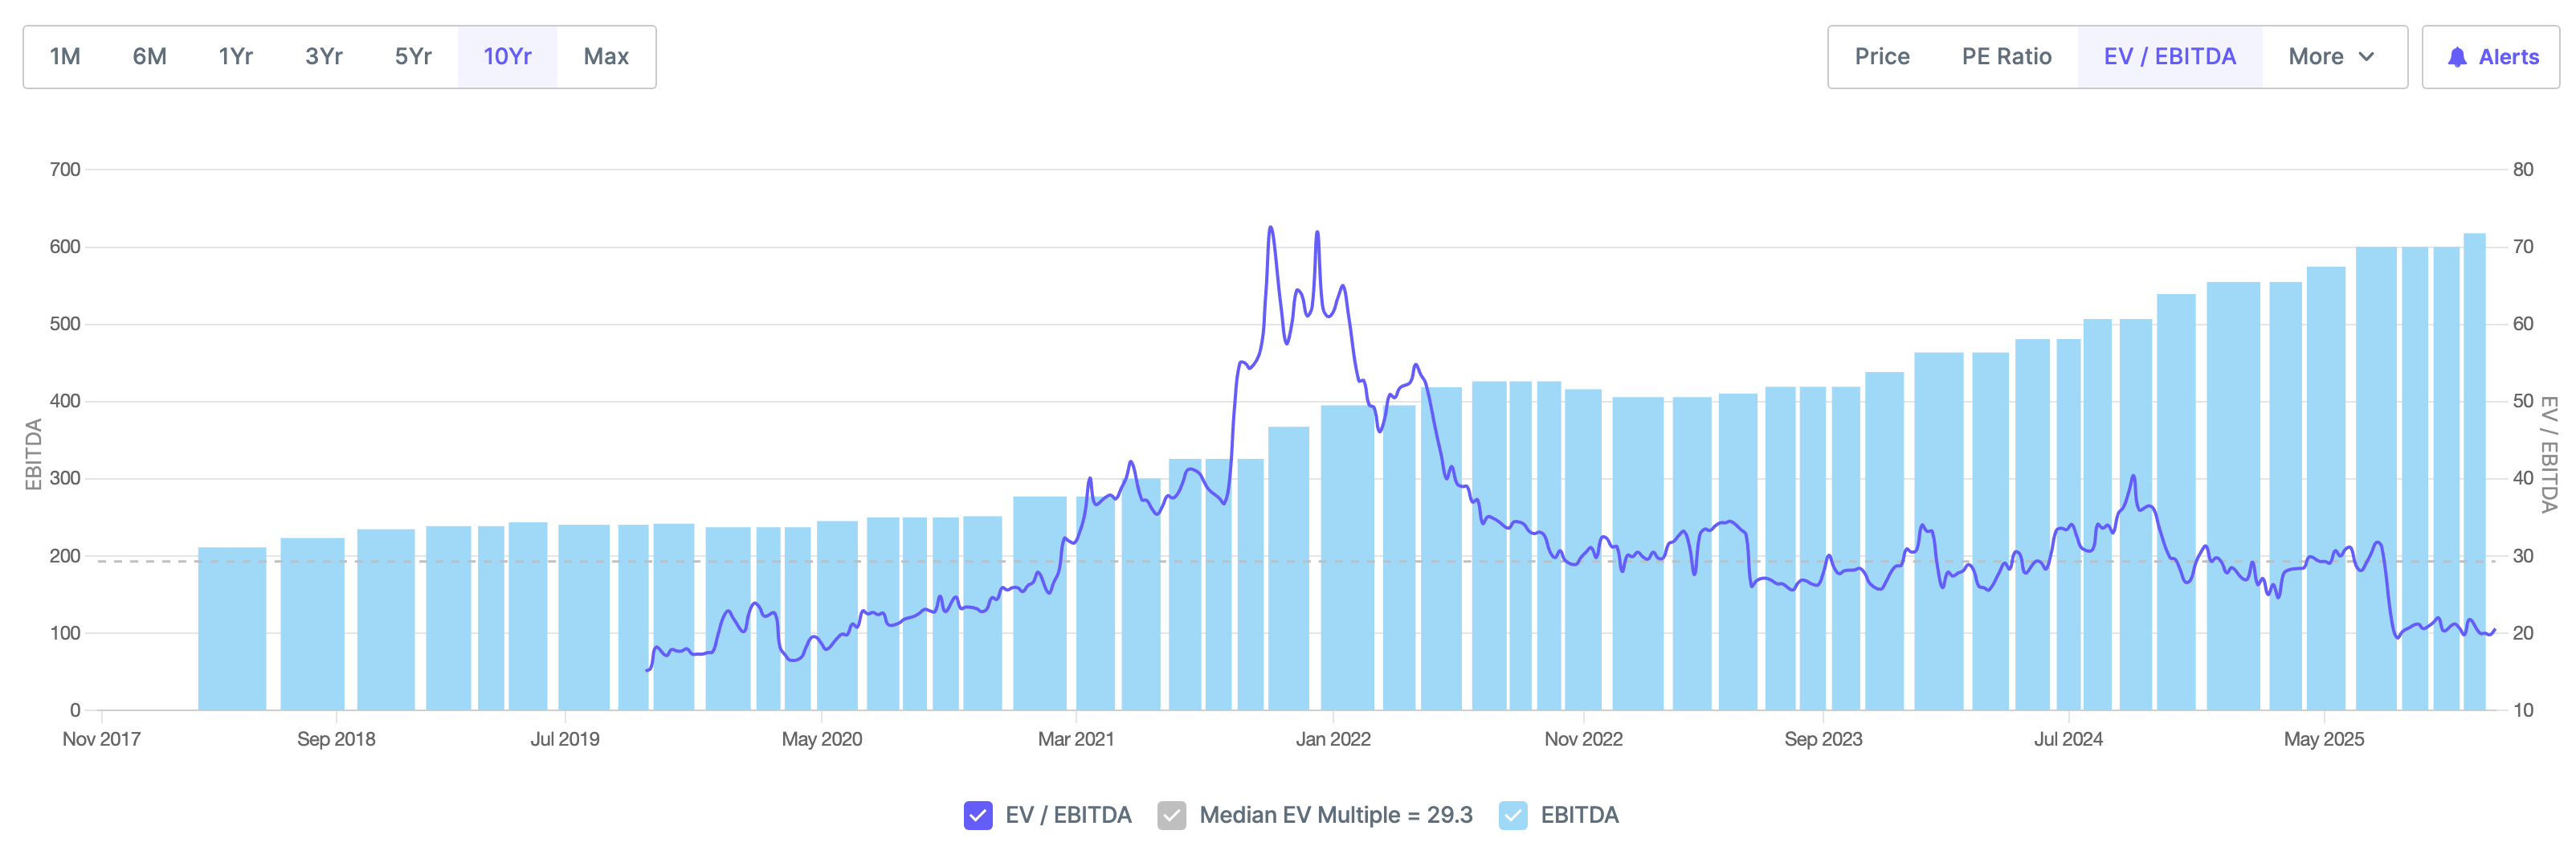
At current price, it’s below its 10-year median EV/EBITDA. It’s not a screaming undervaluation but a more modest proposition: an irreplaceable platform trading at an attractive value. The discount exists because of coupling fears. The question is whether those fears are appropriately sized - or oversized? I believe it’s the latter.
The highest-growth segment (RTM) is exempt from coupling for the foreseeable future. The physical dynamics driving exchange volumes: renewable intermittency, BESS arbitrage, FDRE surplus - are strengthening, not weakening. This creates a favorable asymmetry.
The market is focused on the DAM coupling headline. The RTM growth story is hiding in plain sight.


