
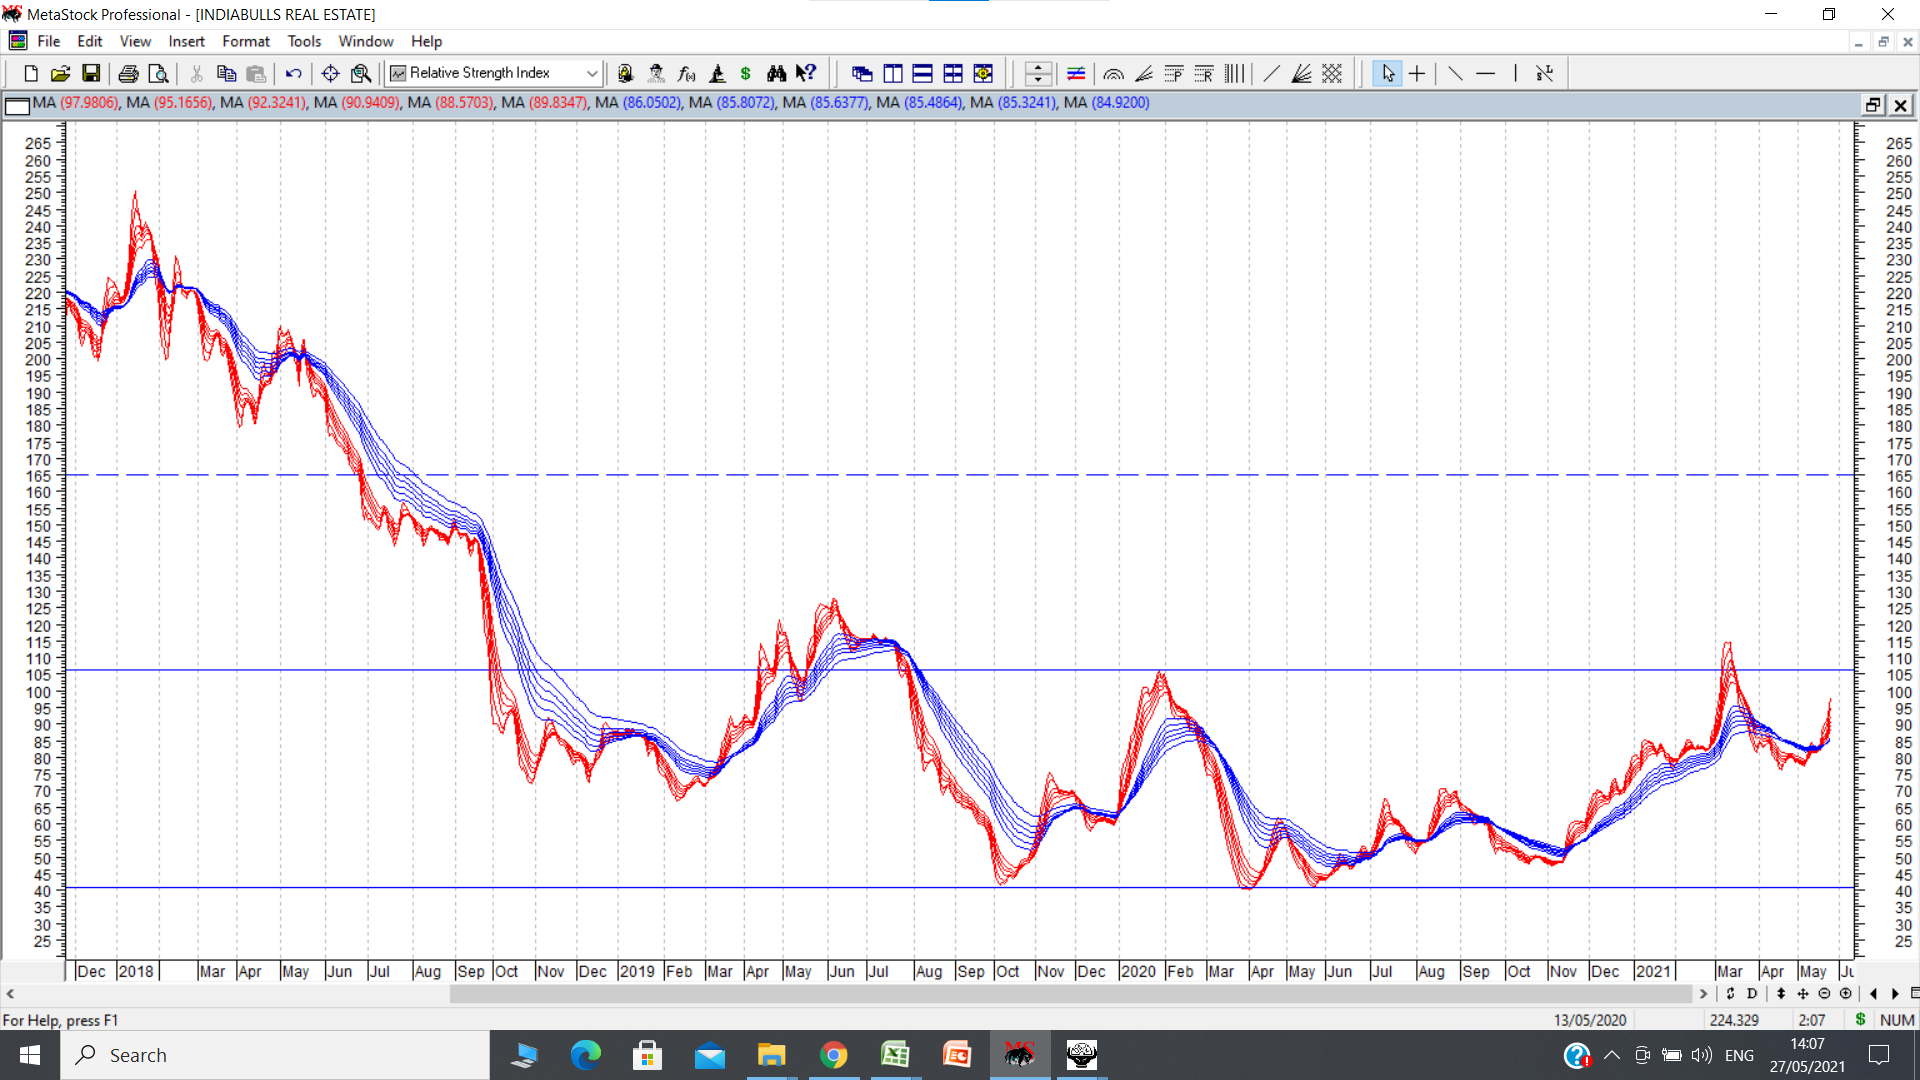
IB real estate daily GMMA chart. Stock price broke out of a double bottom formation with bottoms at 41 and intervening top at 106. Stock price went up sharply to 130 plus and then retraced, retested 200 dema at 72 and started moving up again. It seems retest of double bottom breakout was done. Target of double bottom formation is 165. Target zone marked in dotten line. cmp 101. Fundamentally promoters have changed. Now majority owners are Embassy group and Blackstone group. Samir Gehlaut held 9% stake… disc: invested
16 Likes
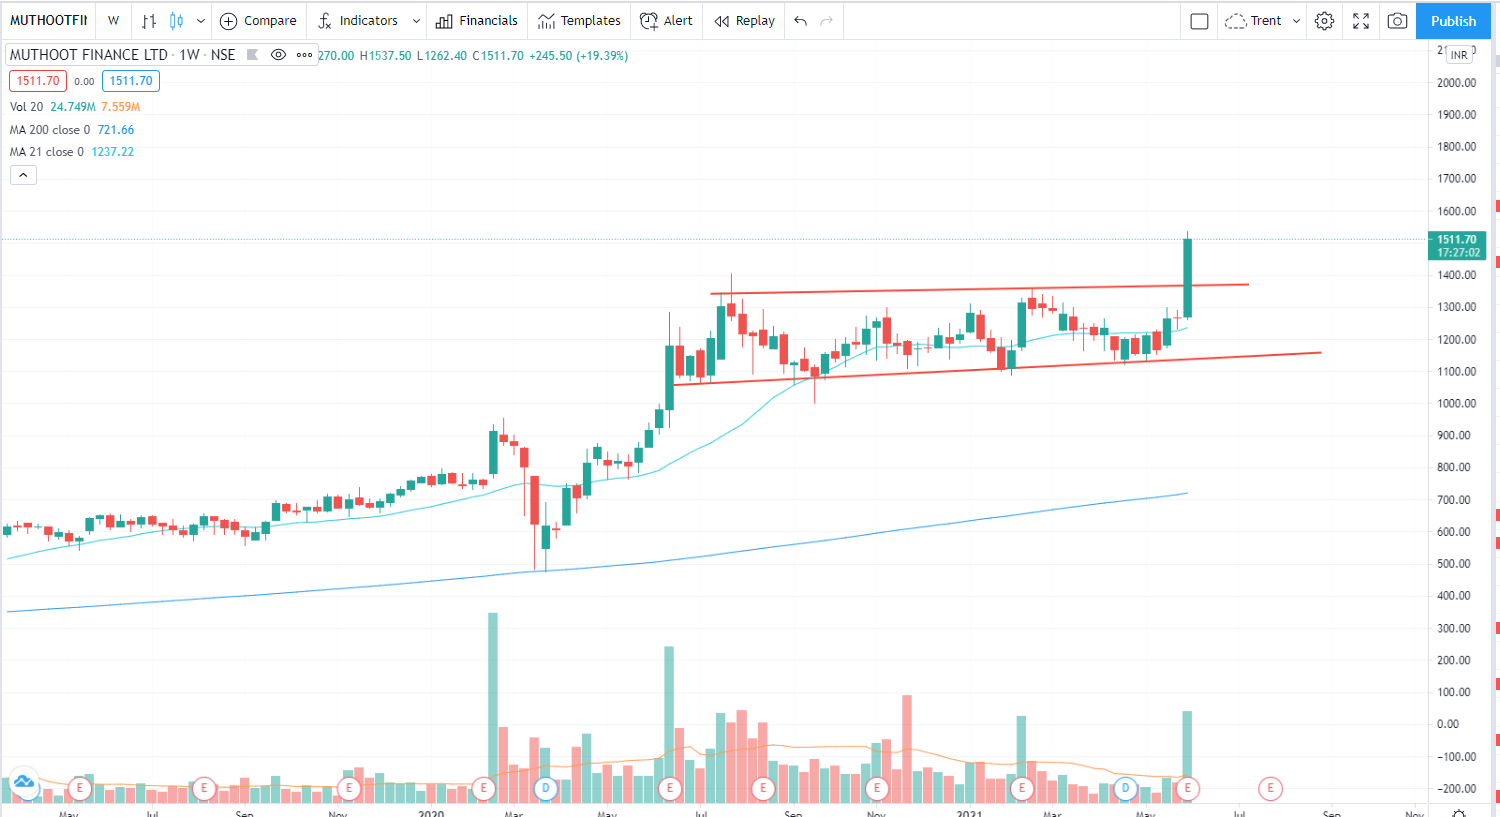
Muthoot Finance breakout post Q4 results declared. Price now at 52 week high (last high price was in July 2020)

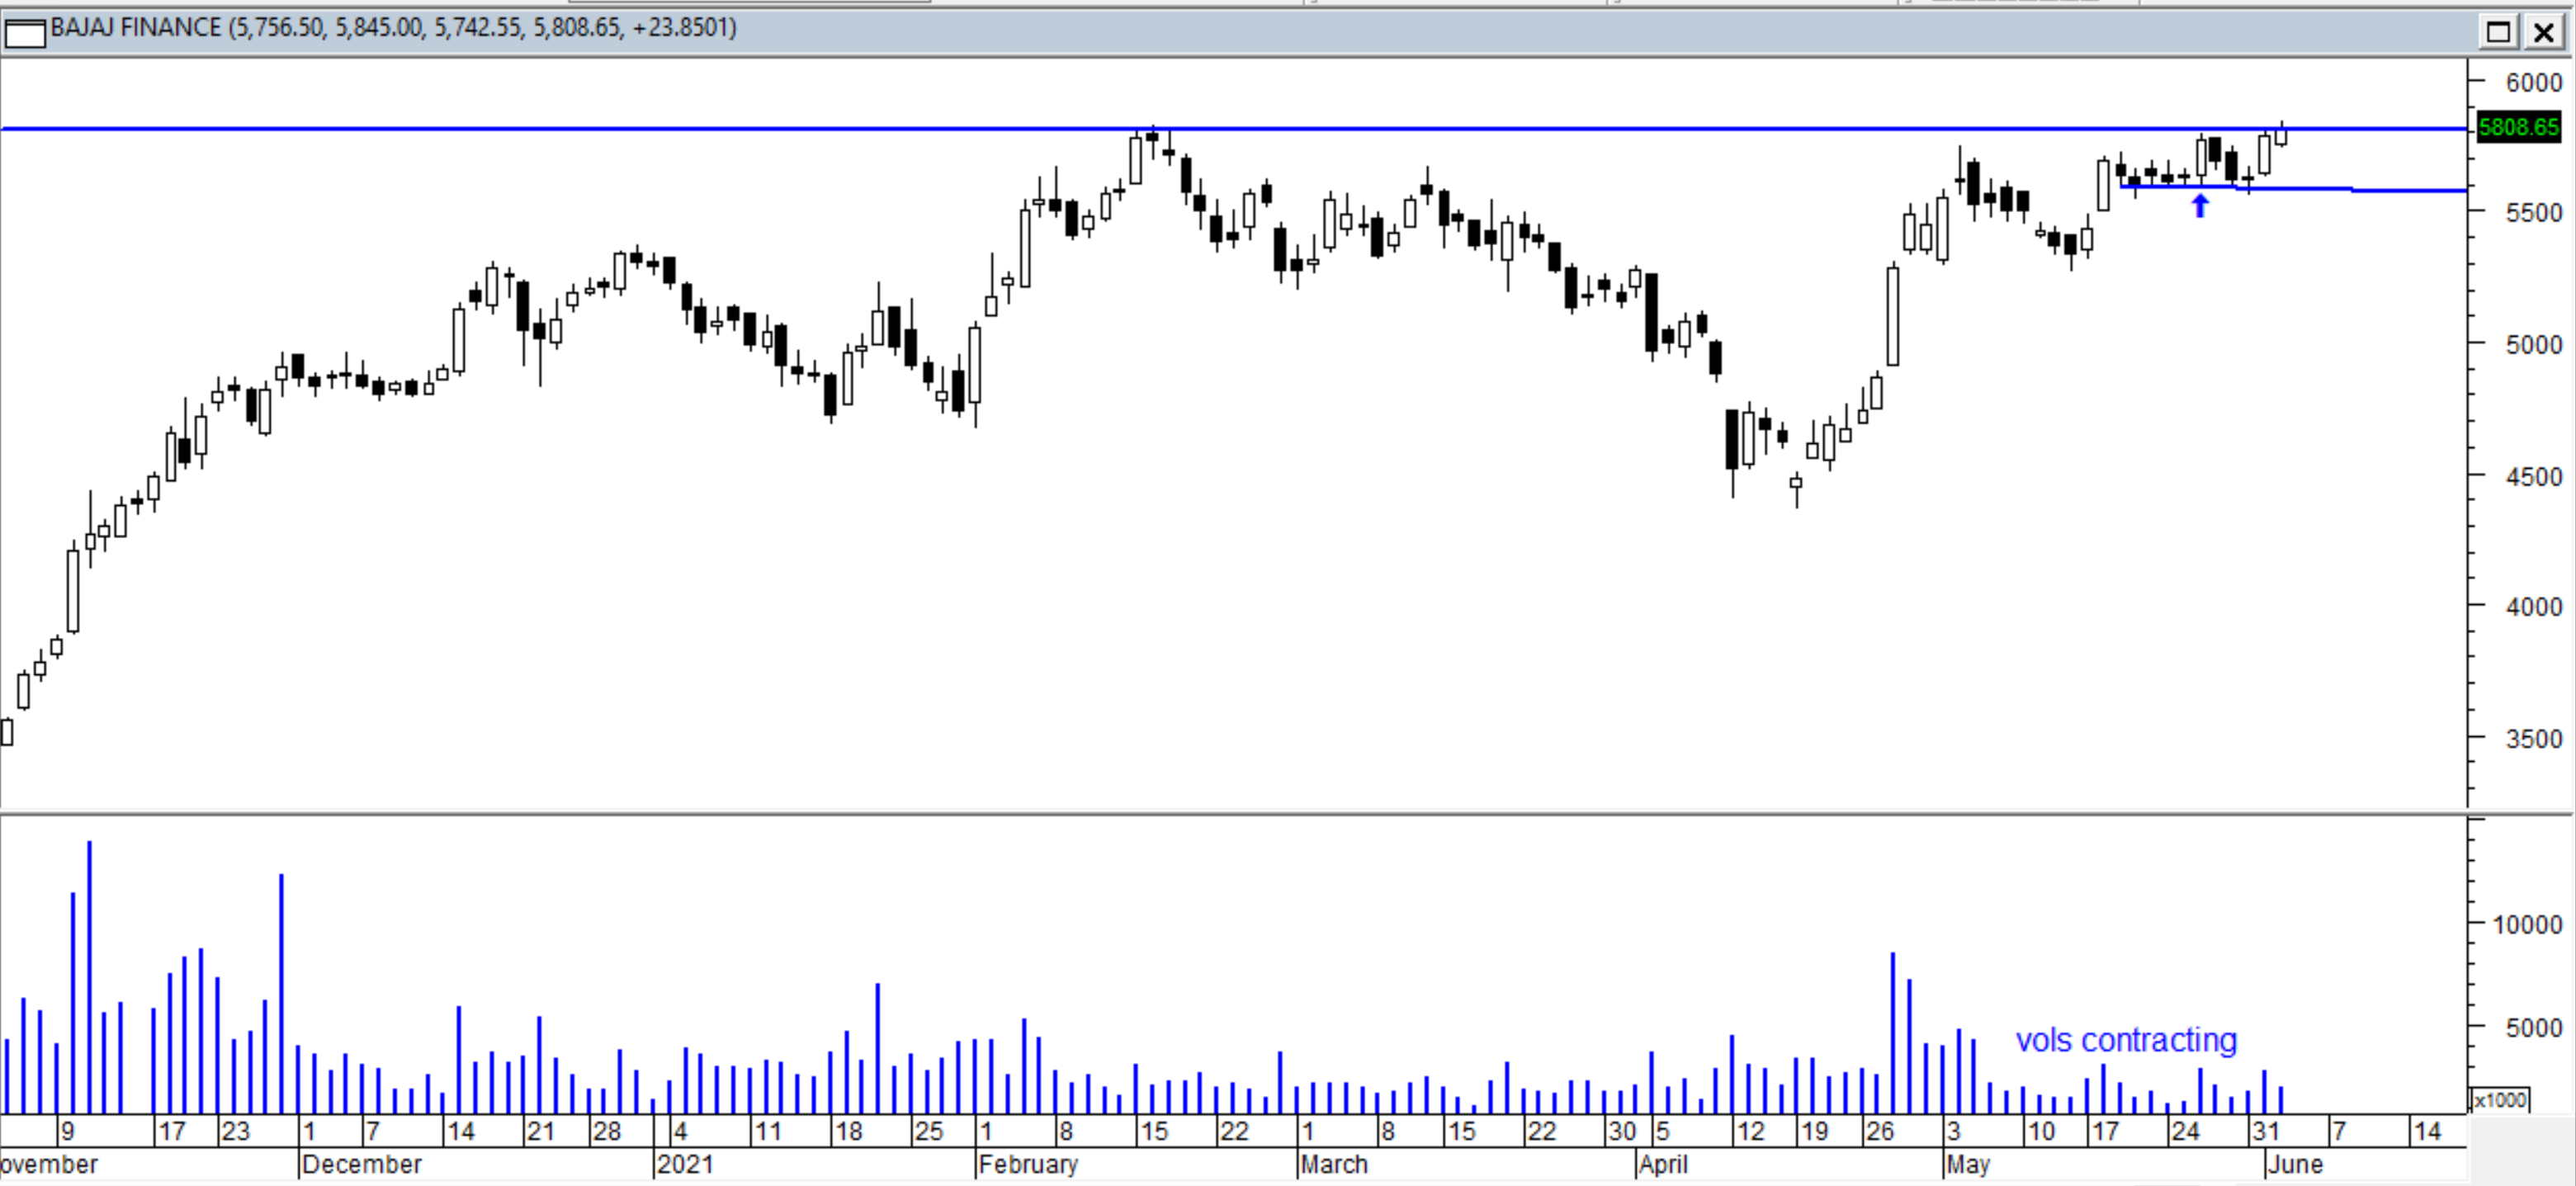
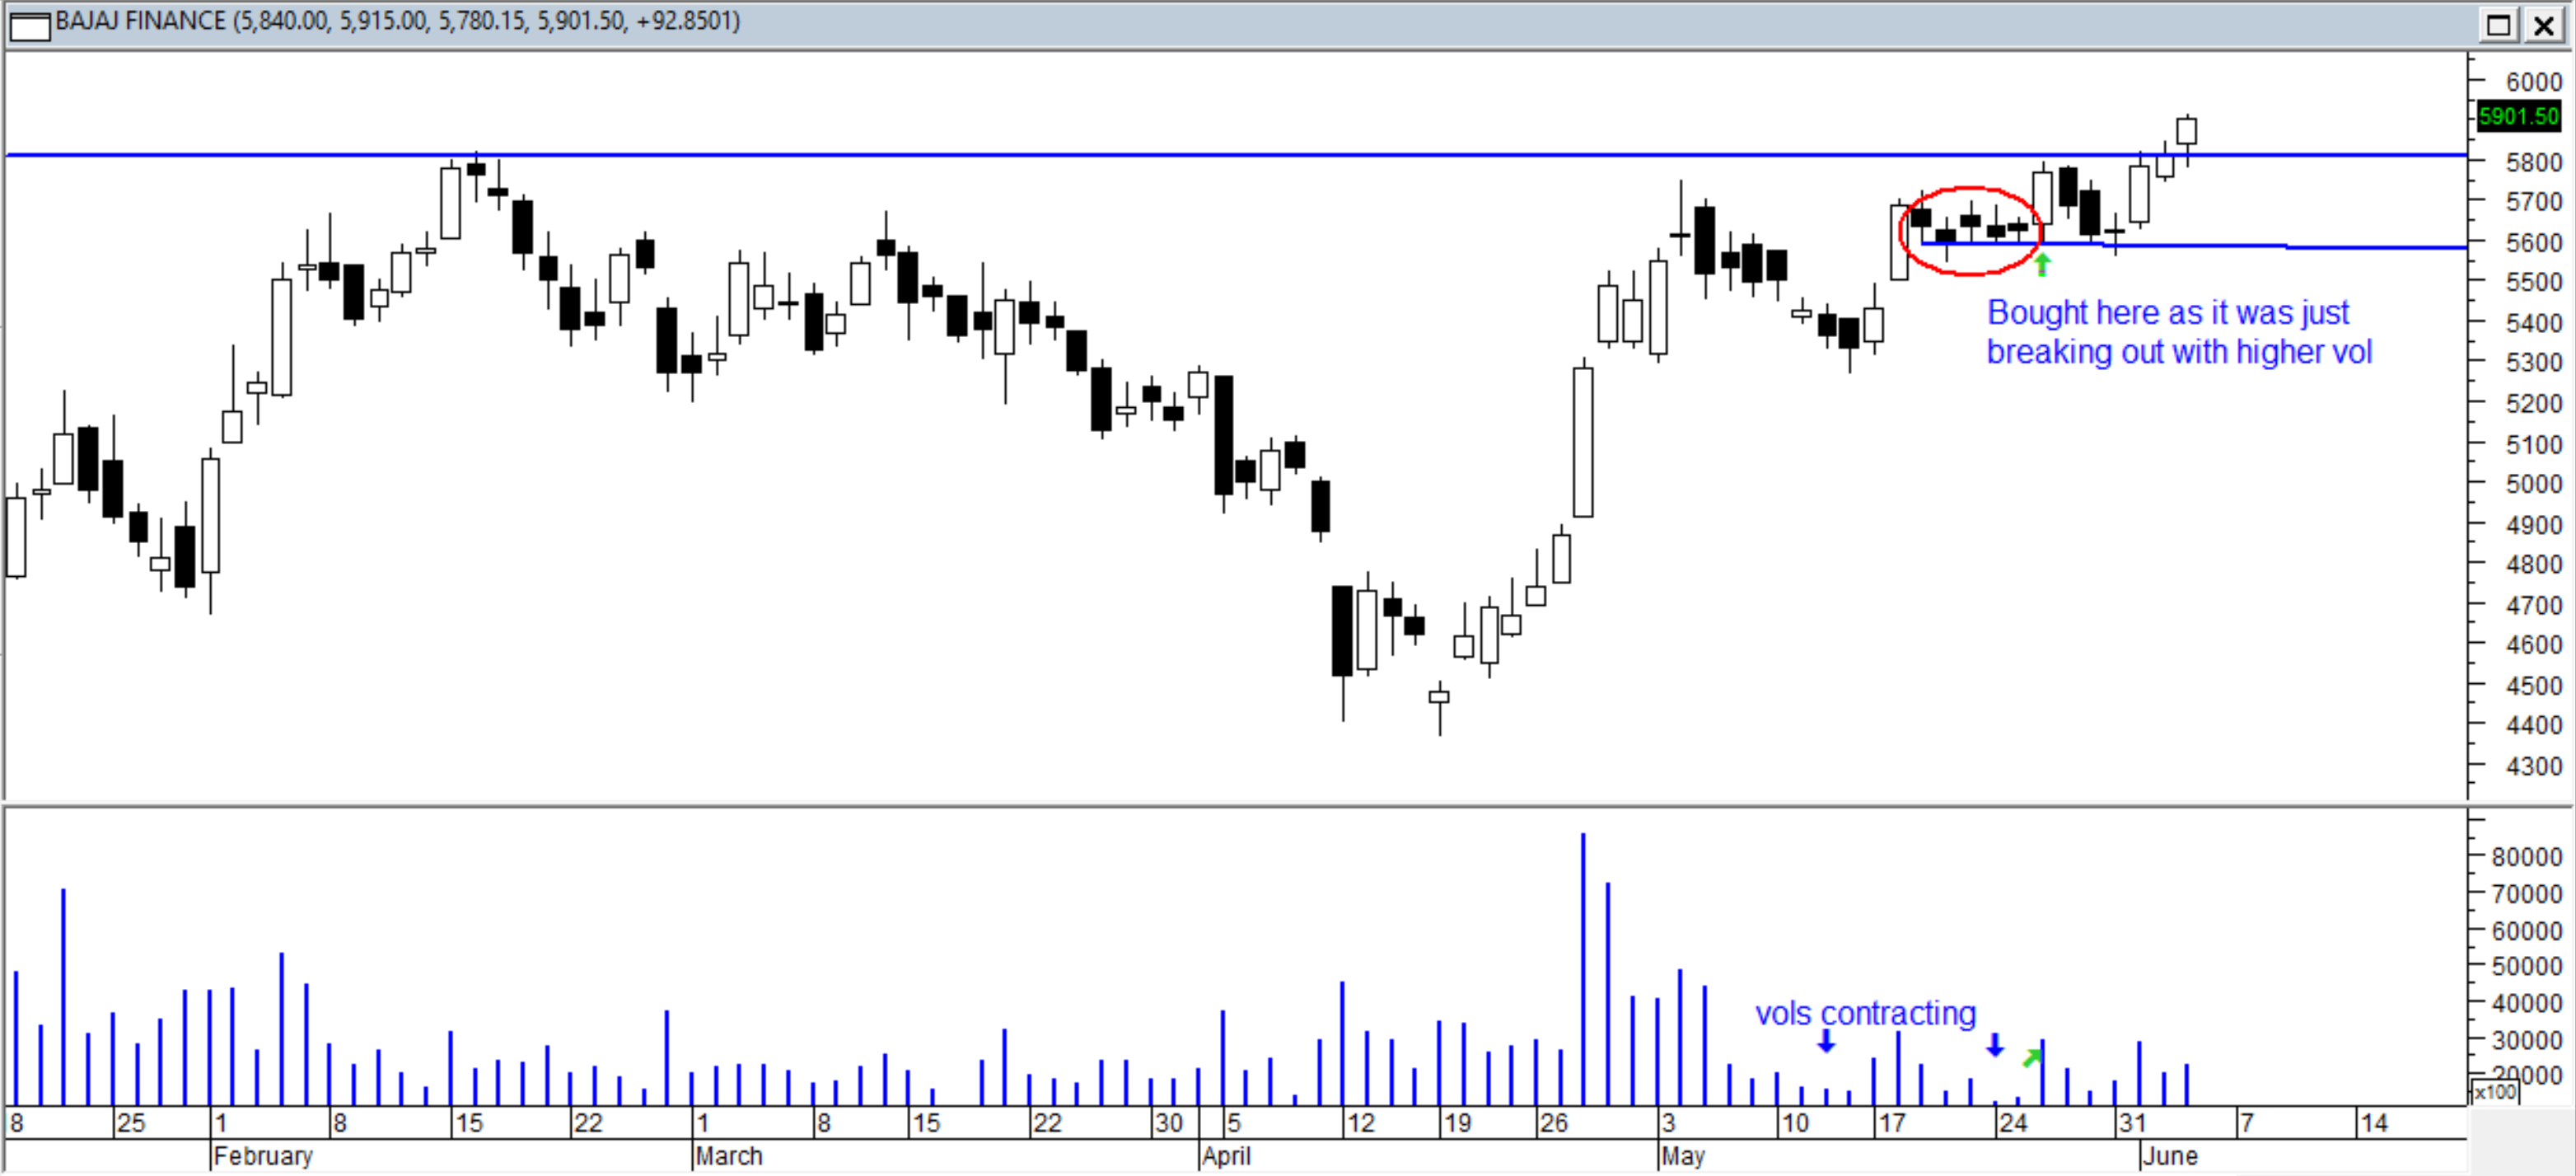
Bajaj Finance Cup and handle near All time highs
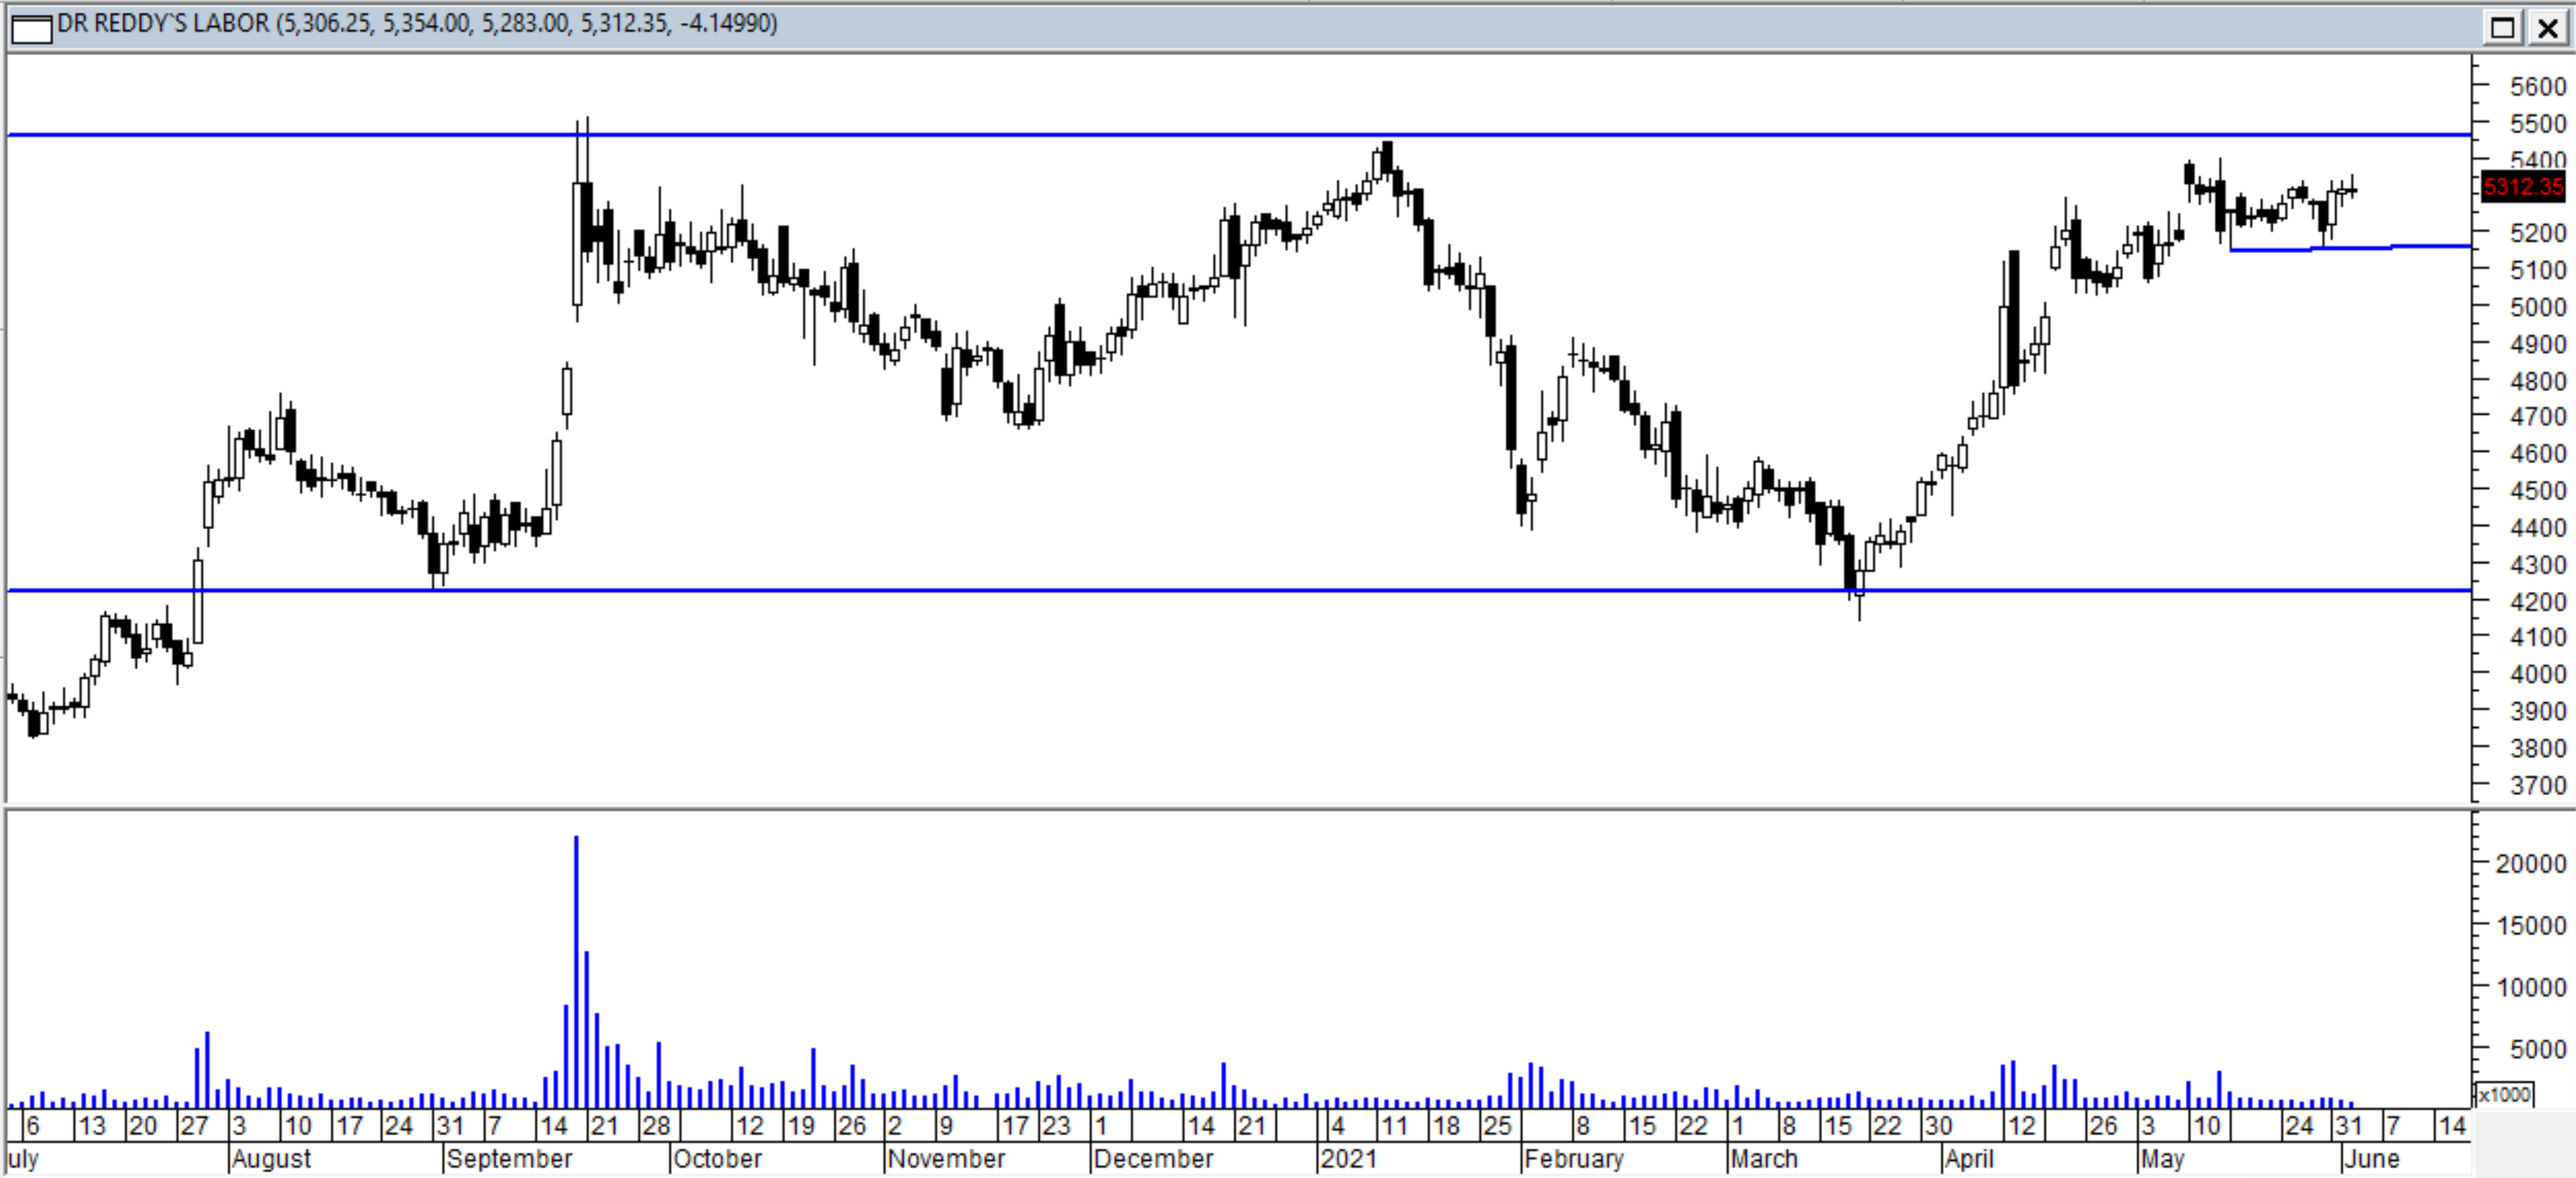
Dr Reddy’s near All time highs
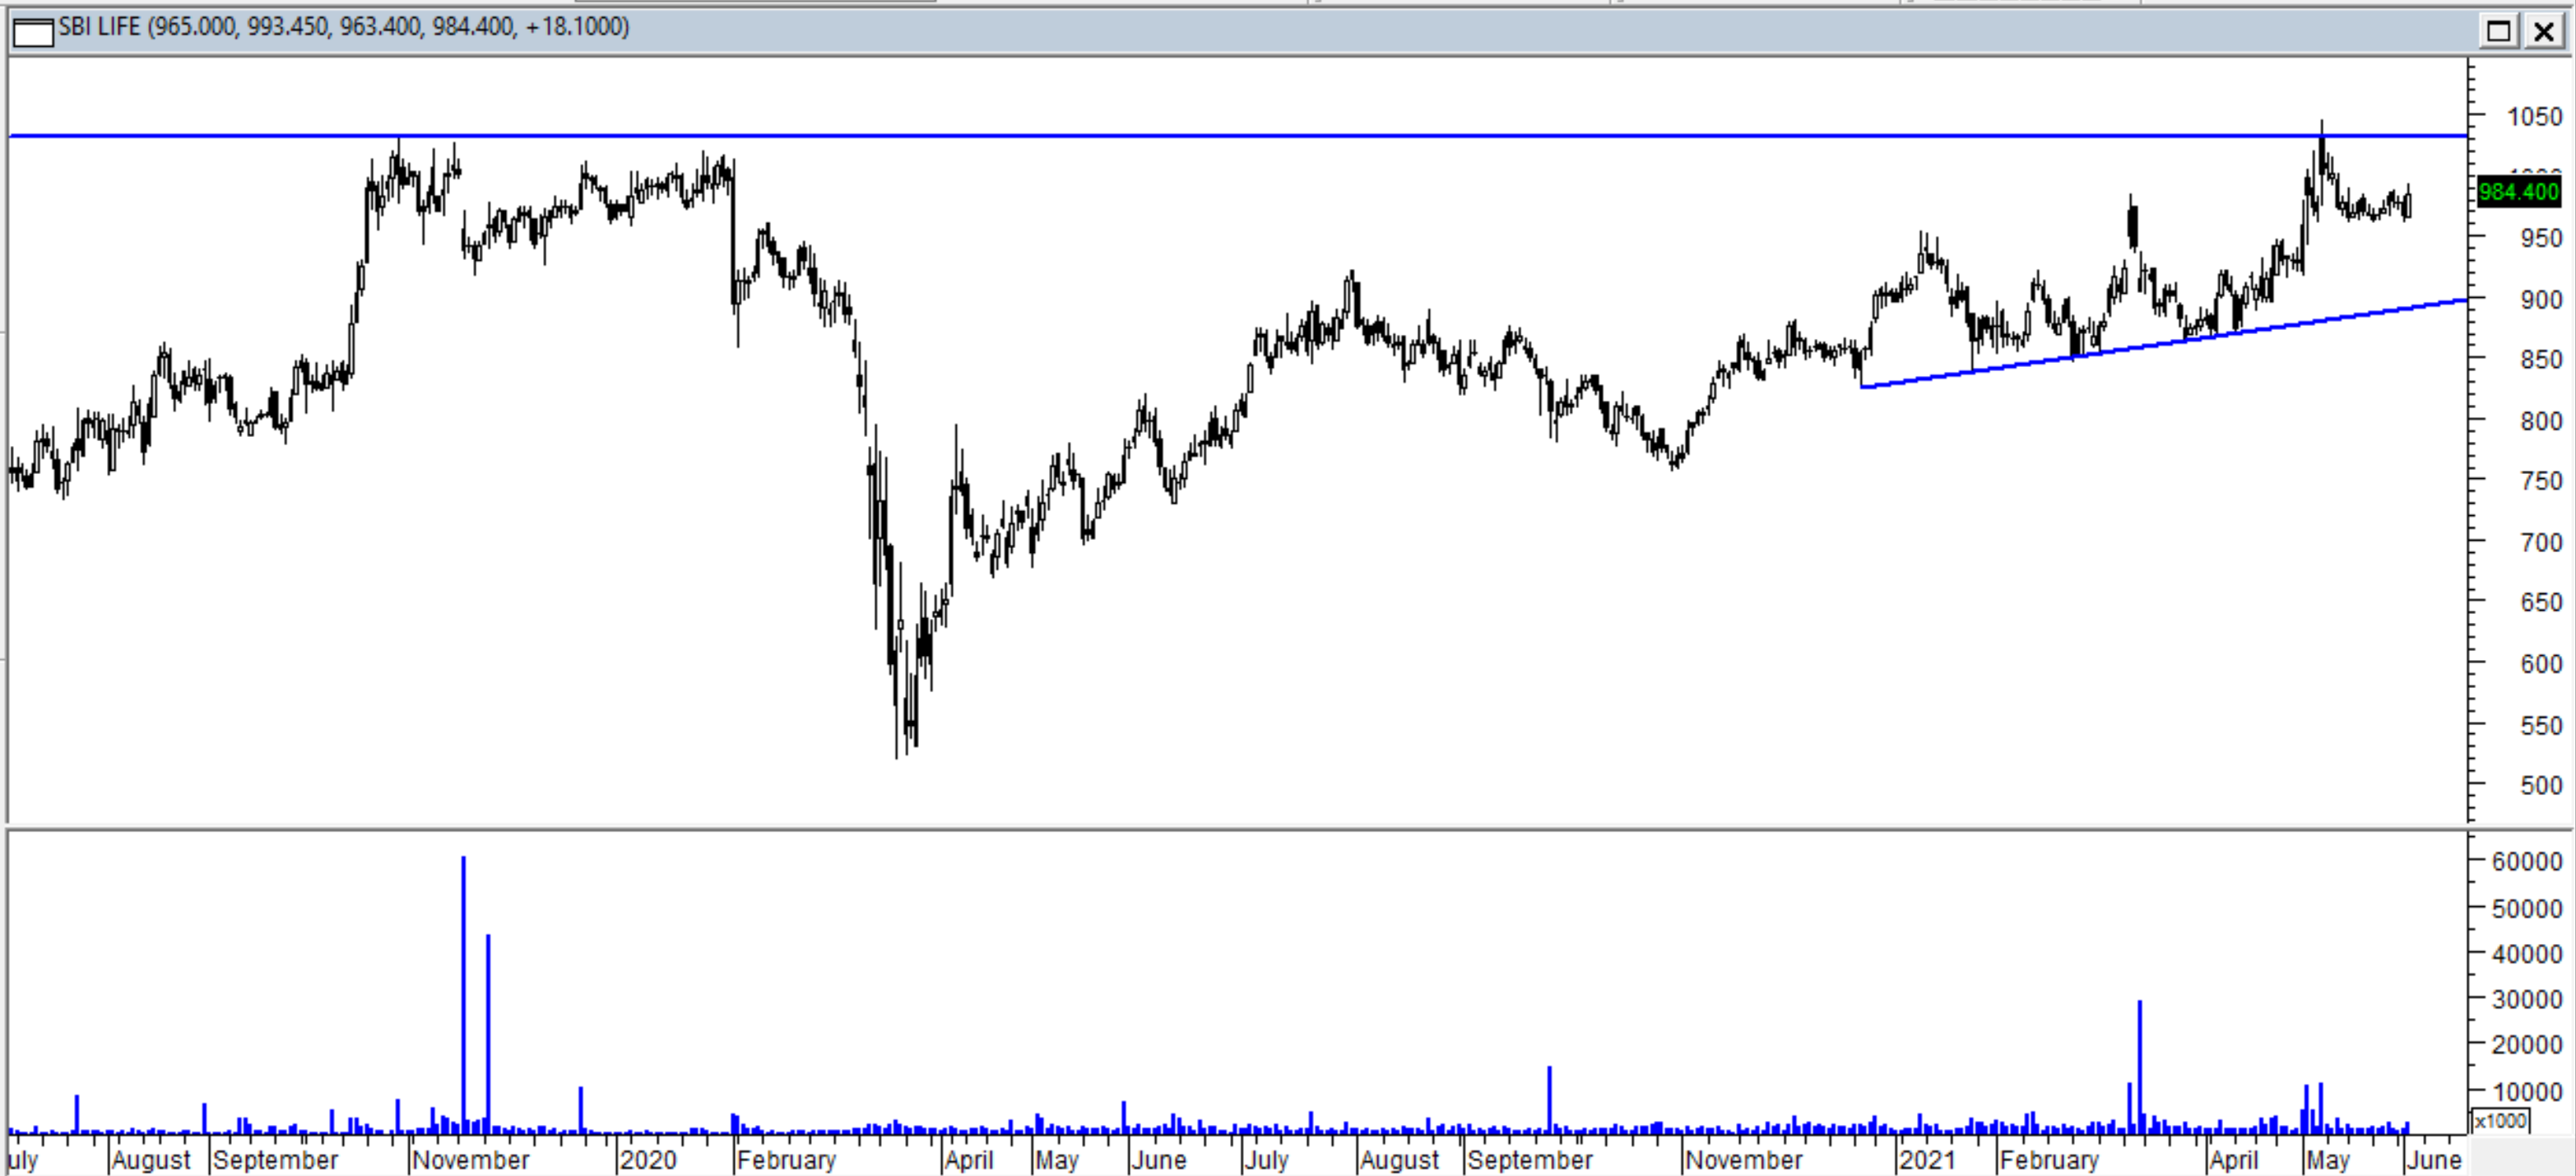
SBI Life is forming a nice cup and handle pattern. Confirmation will be on sustaining above All time high ~1050
3 Likes
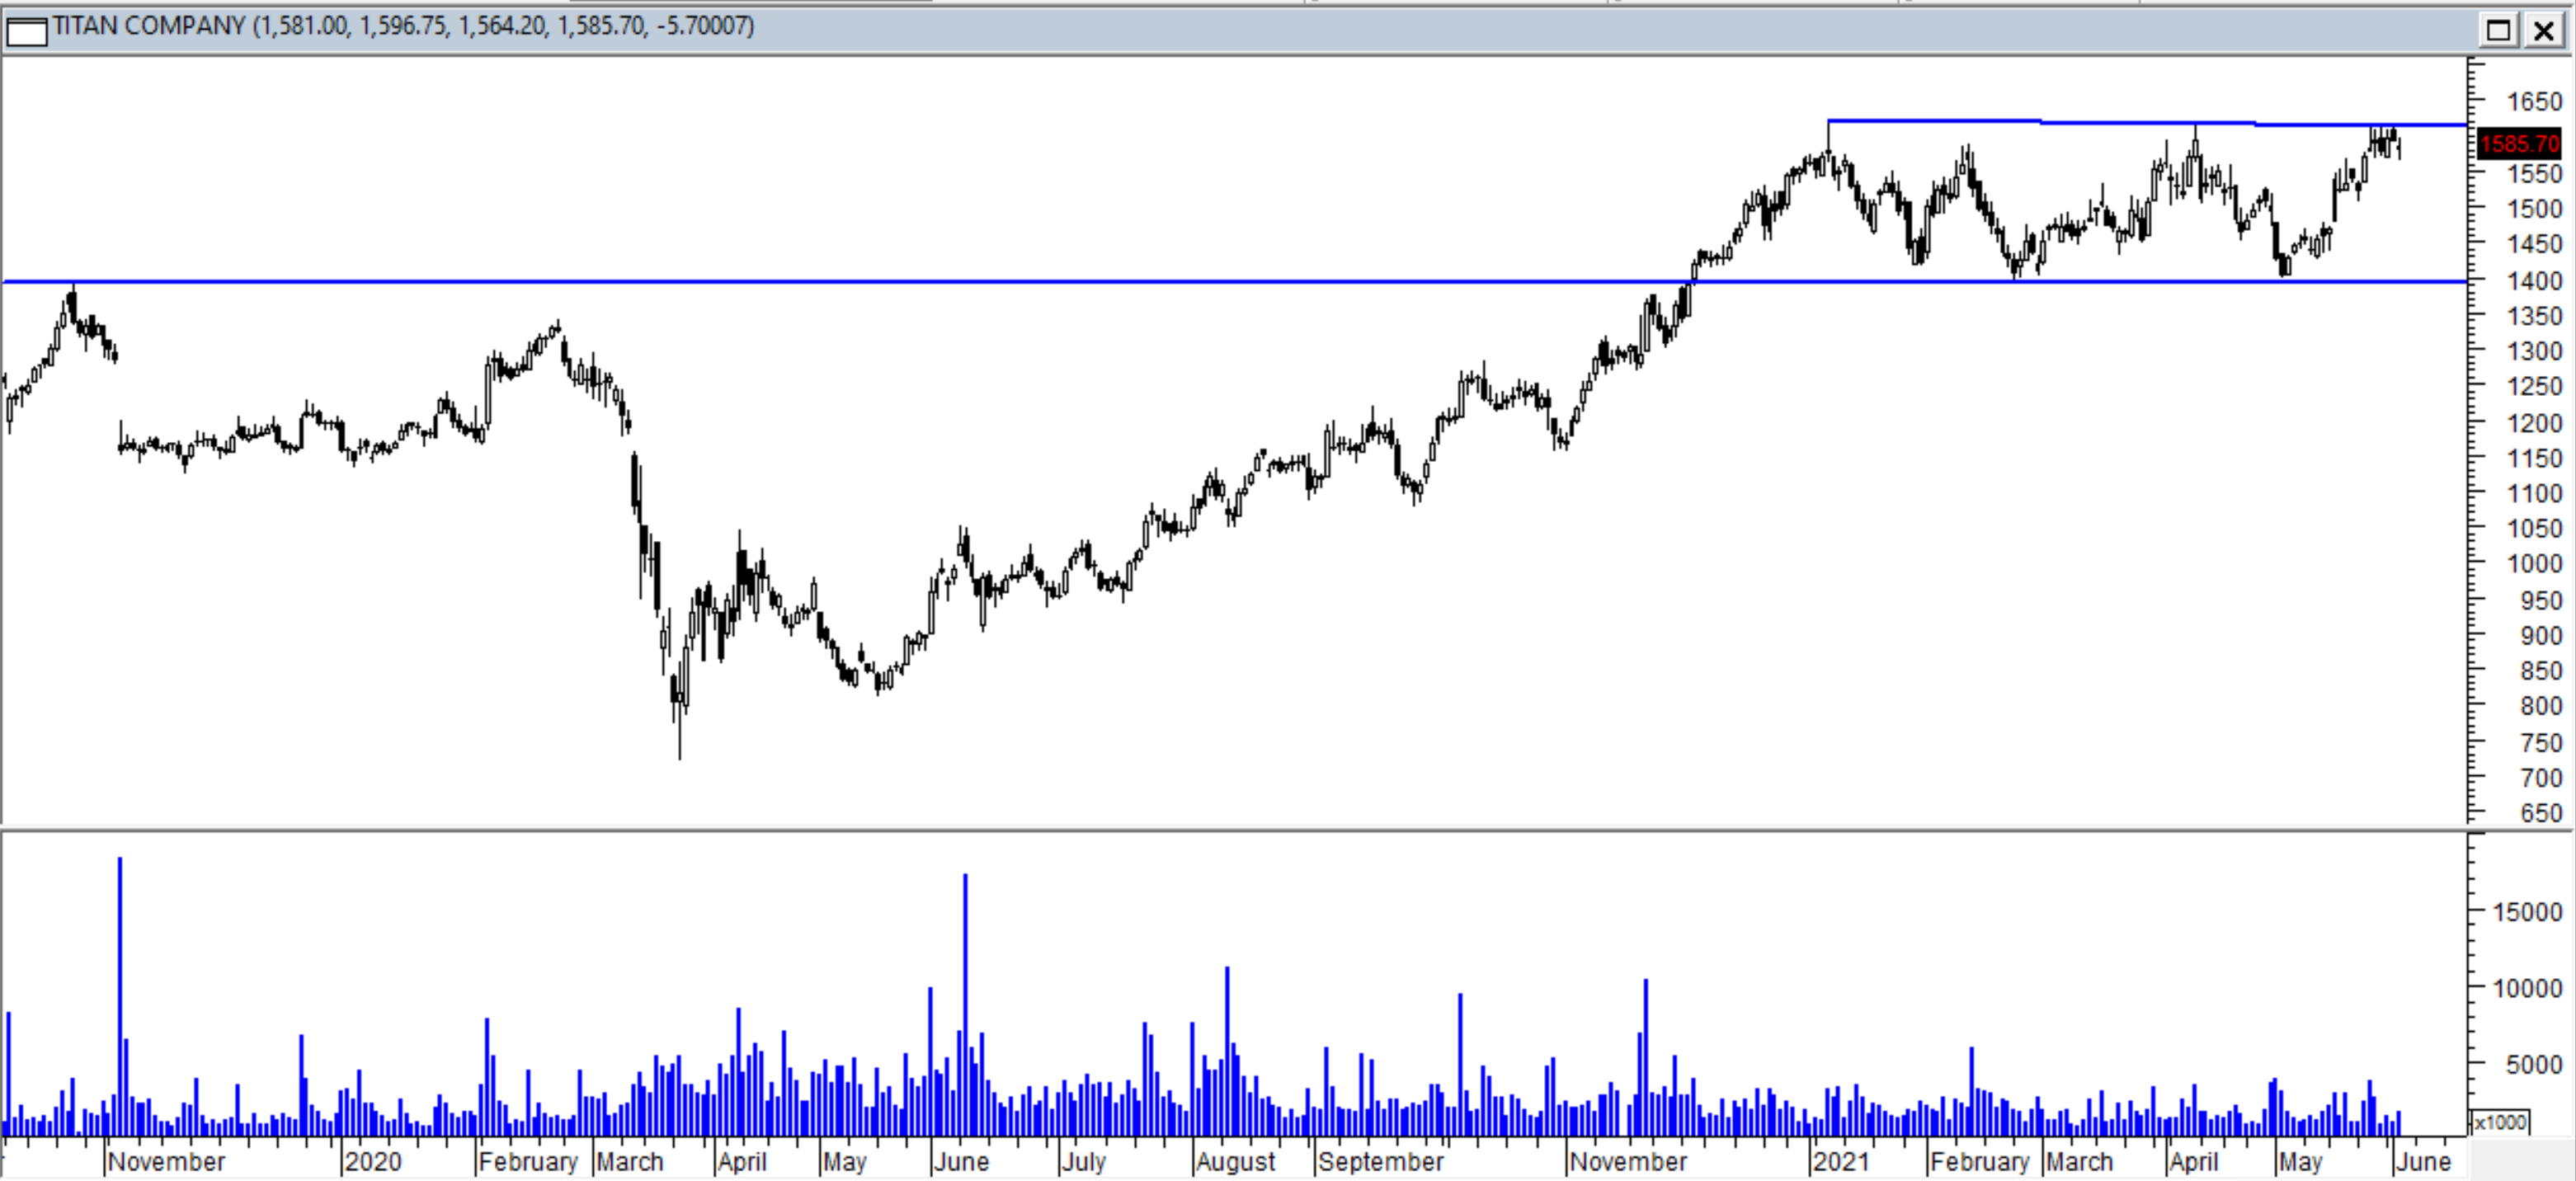
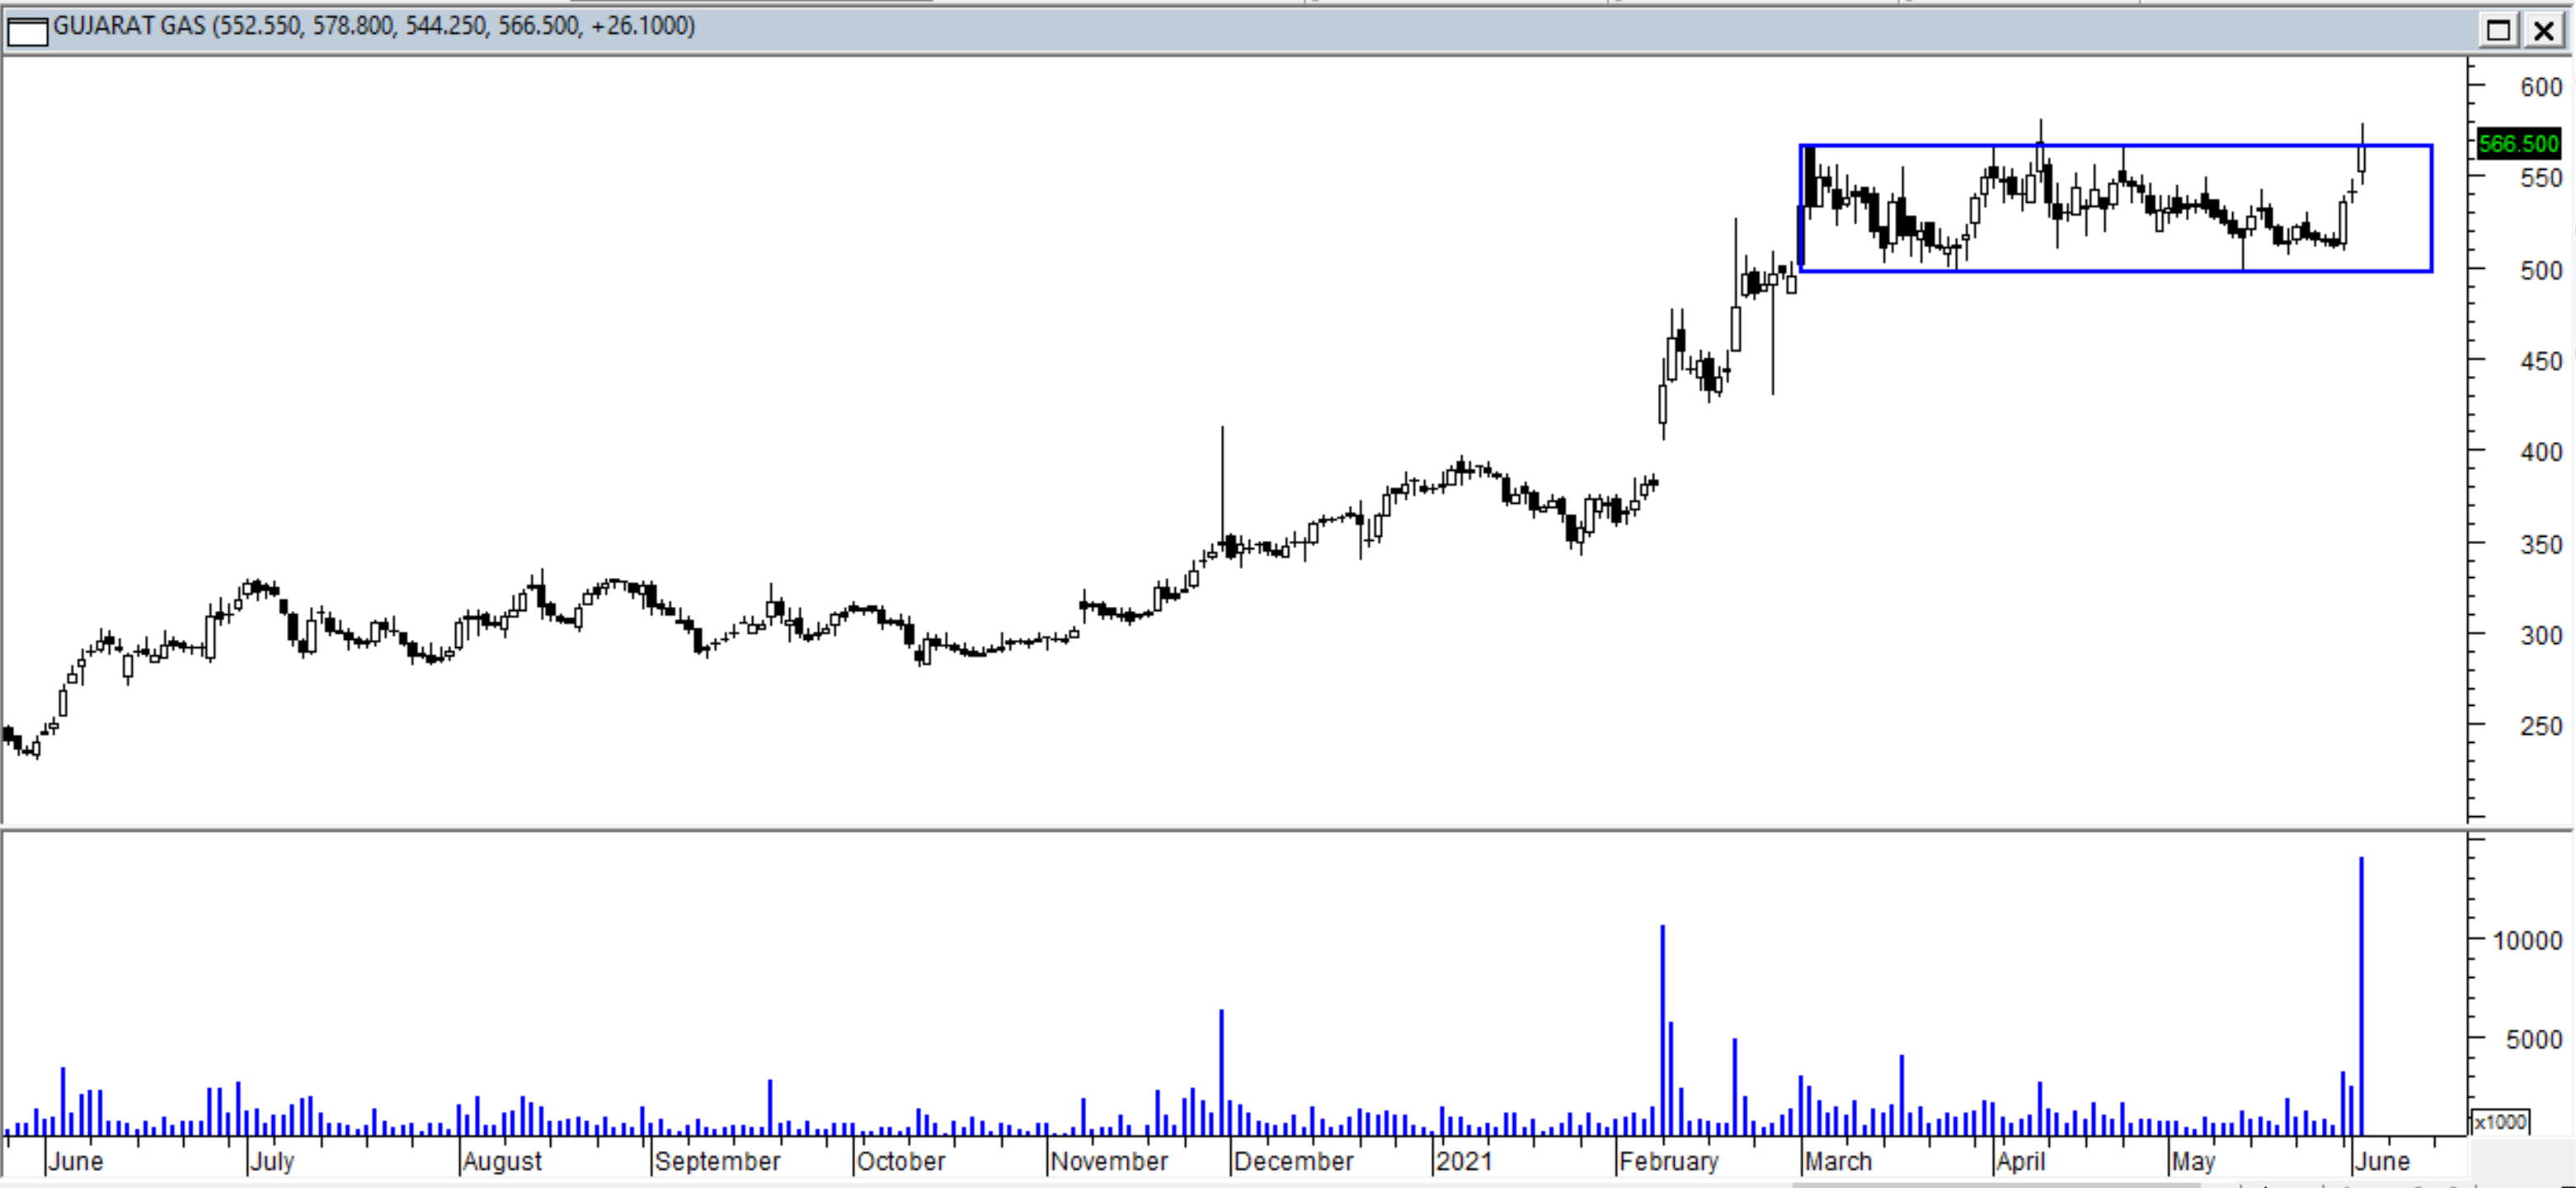
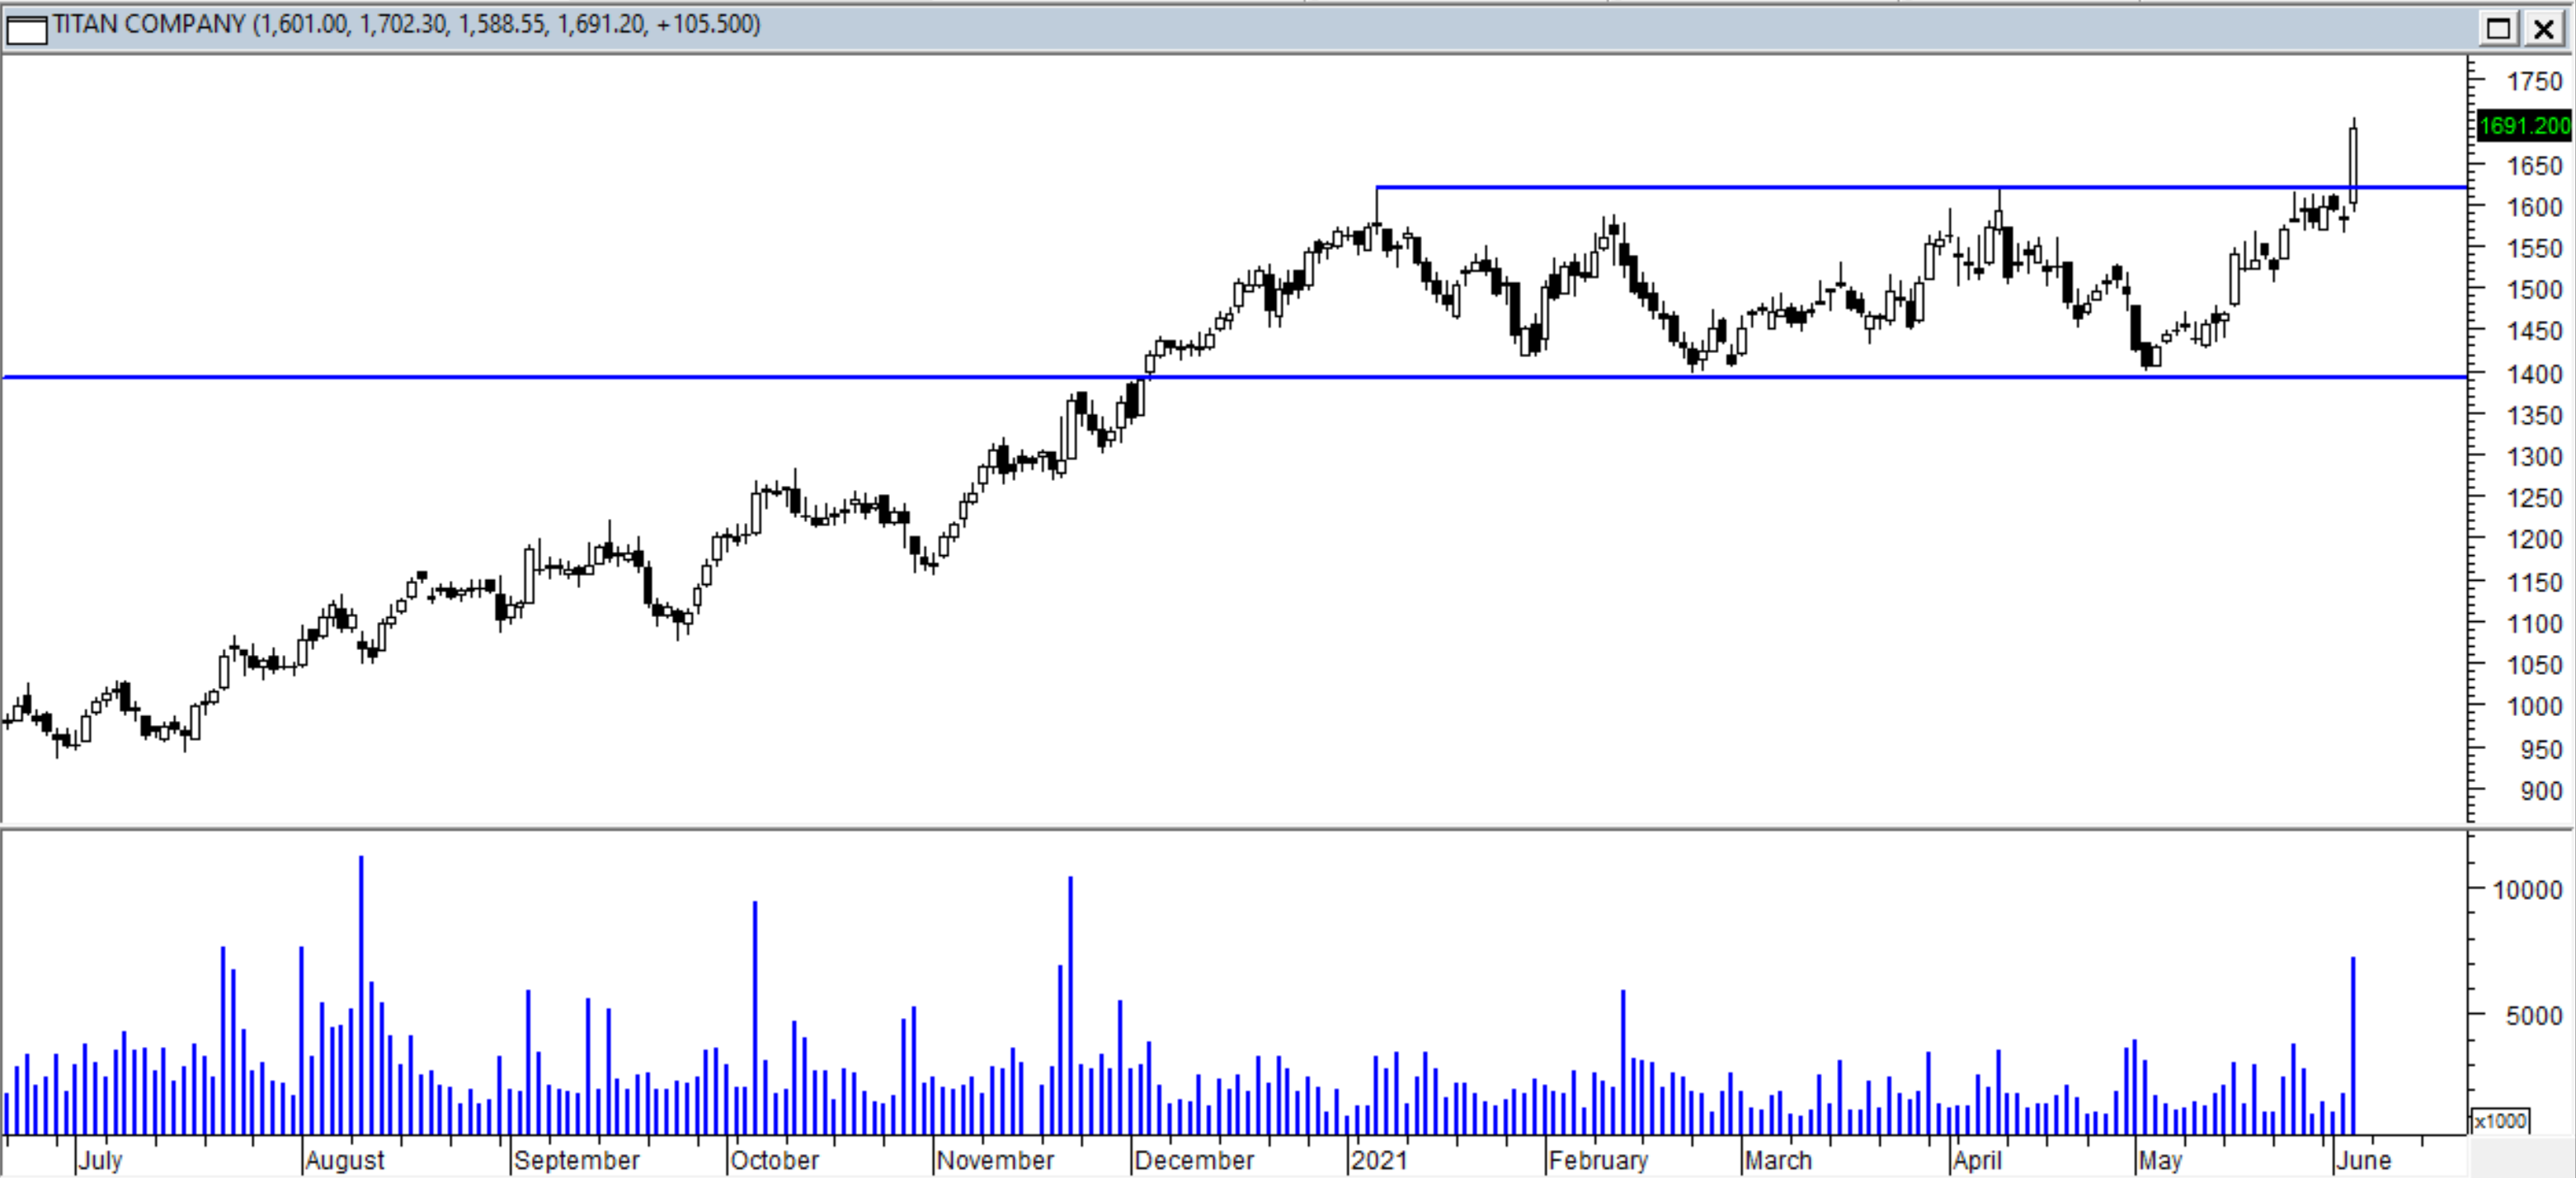
Titan is trading in a channel after breaking out above 1400 level. Lower end of channel is 1400. Currently near All time highs. Breakout confirmation will be above 1600-1620
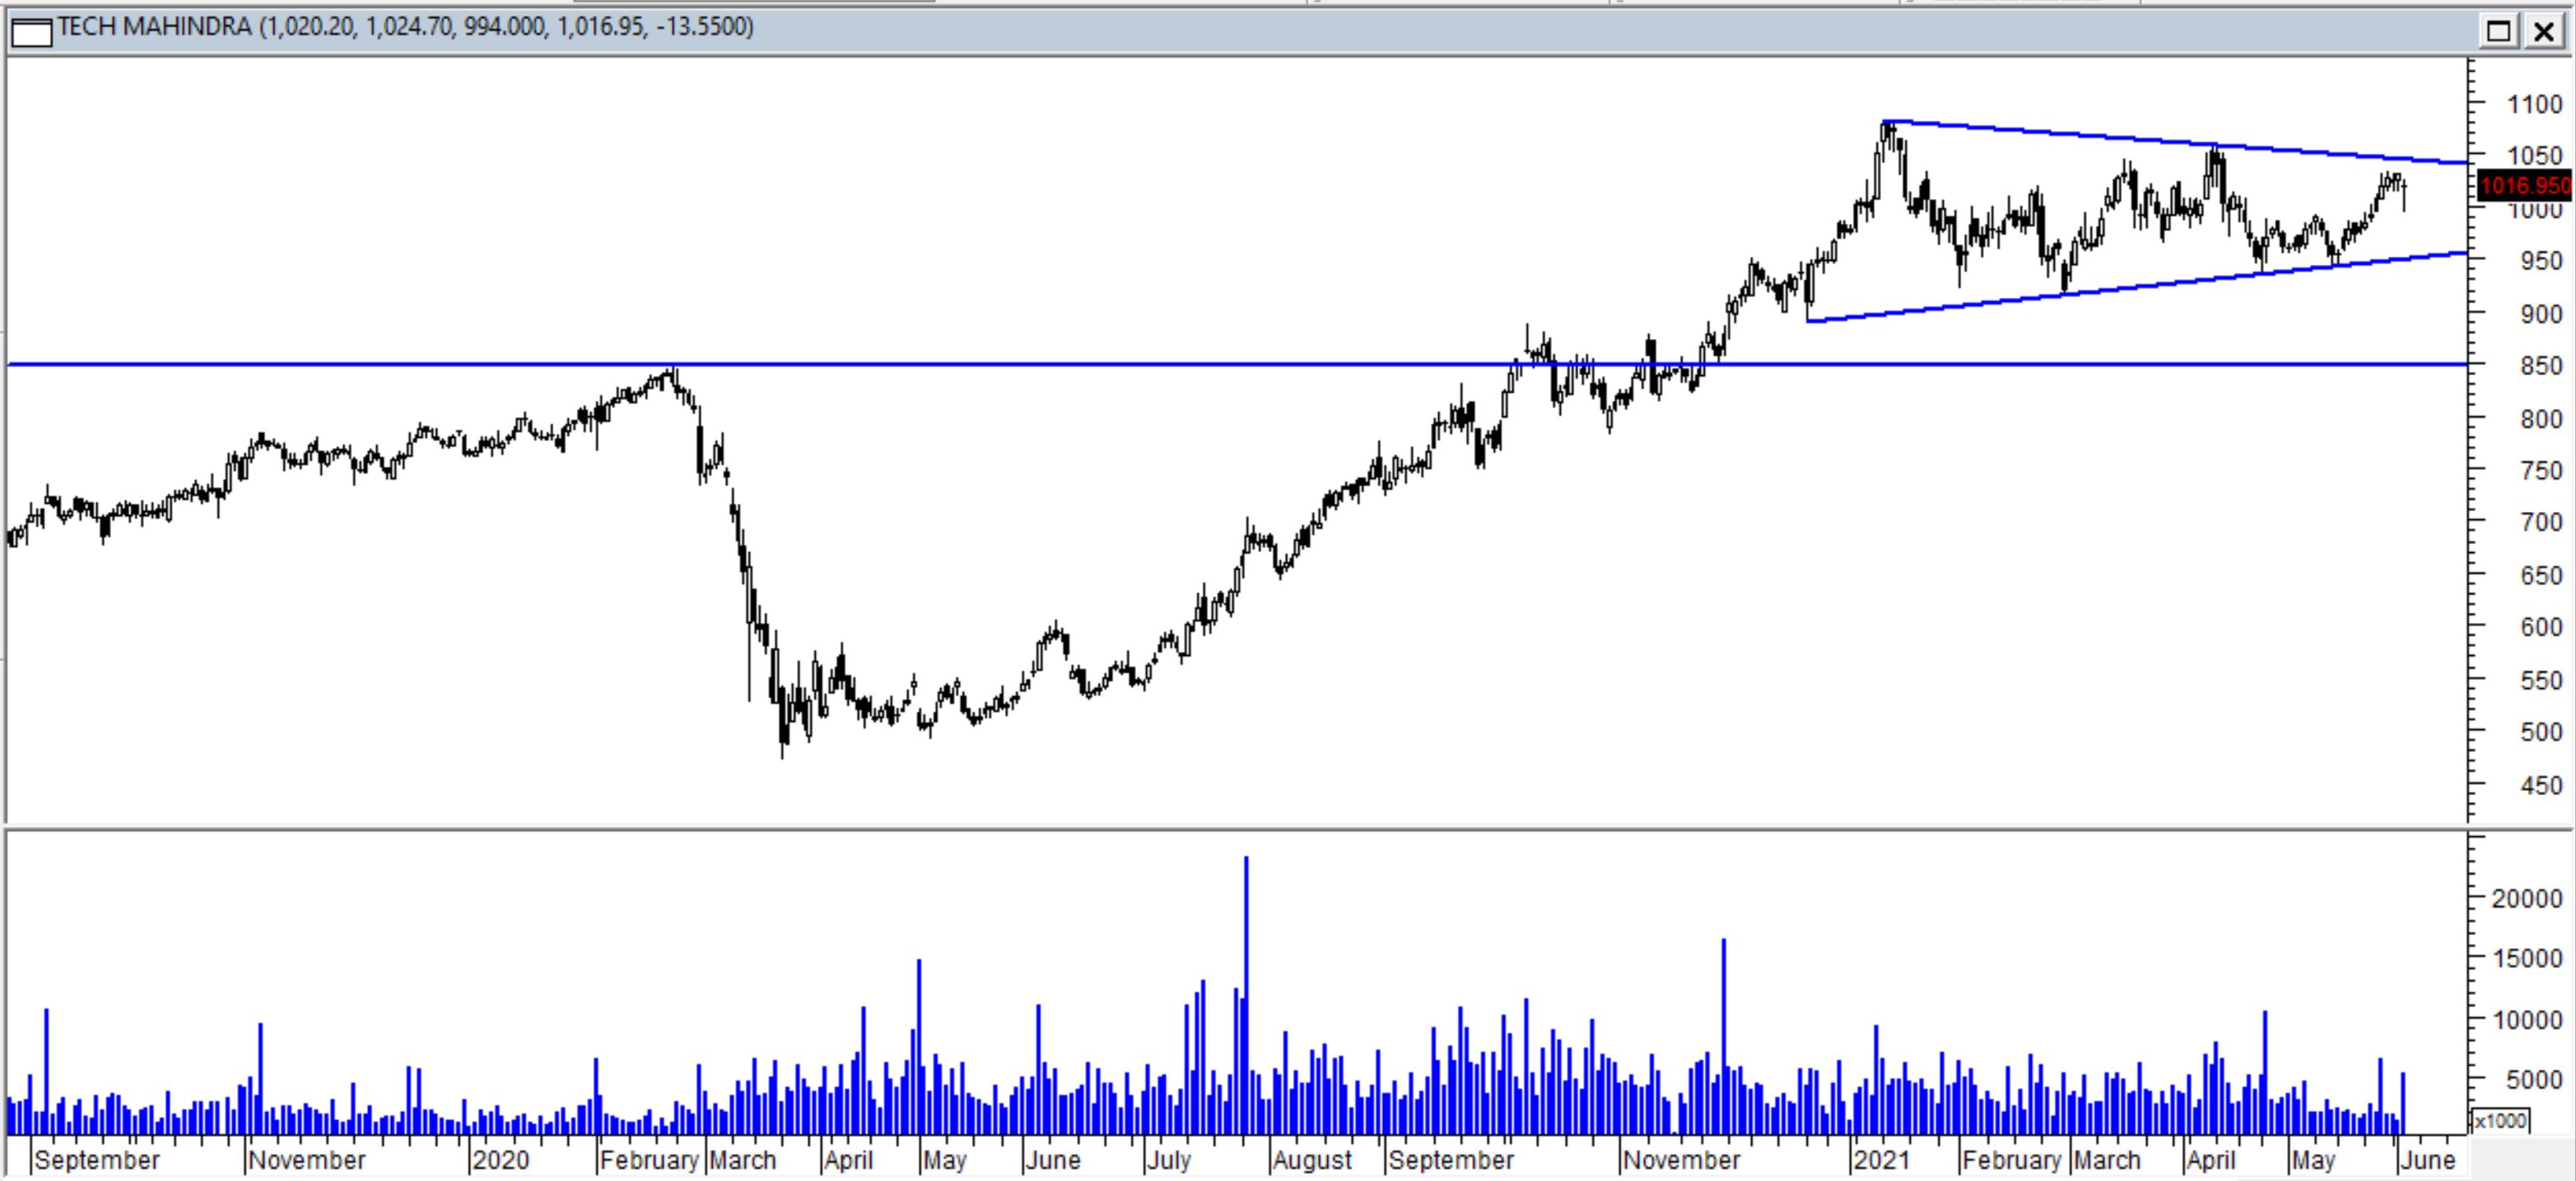
Tech Mahindra in a triangle pattern after breaking out above 850 level. Breakout will be confirmed above 1050-1060
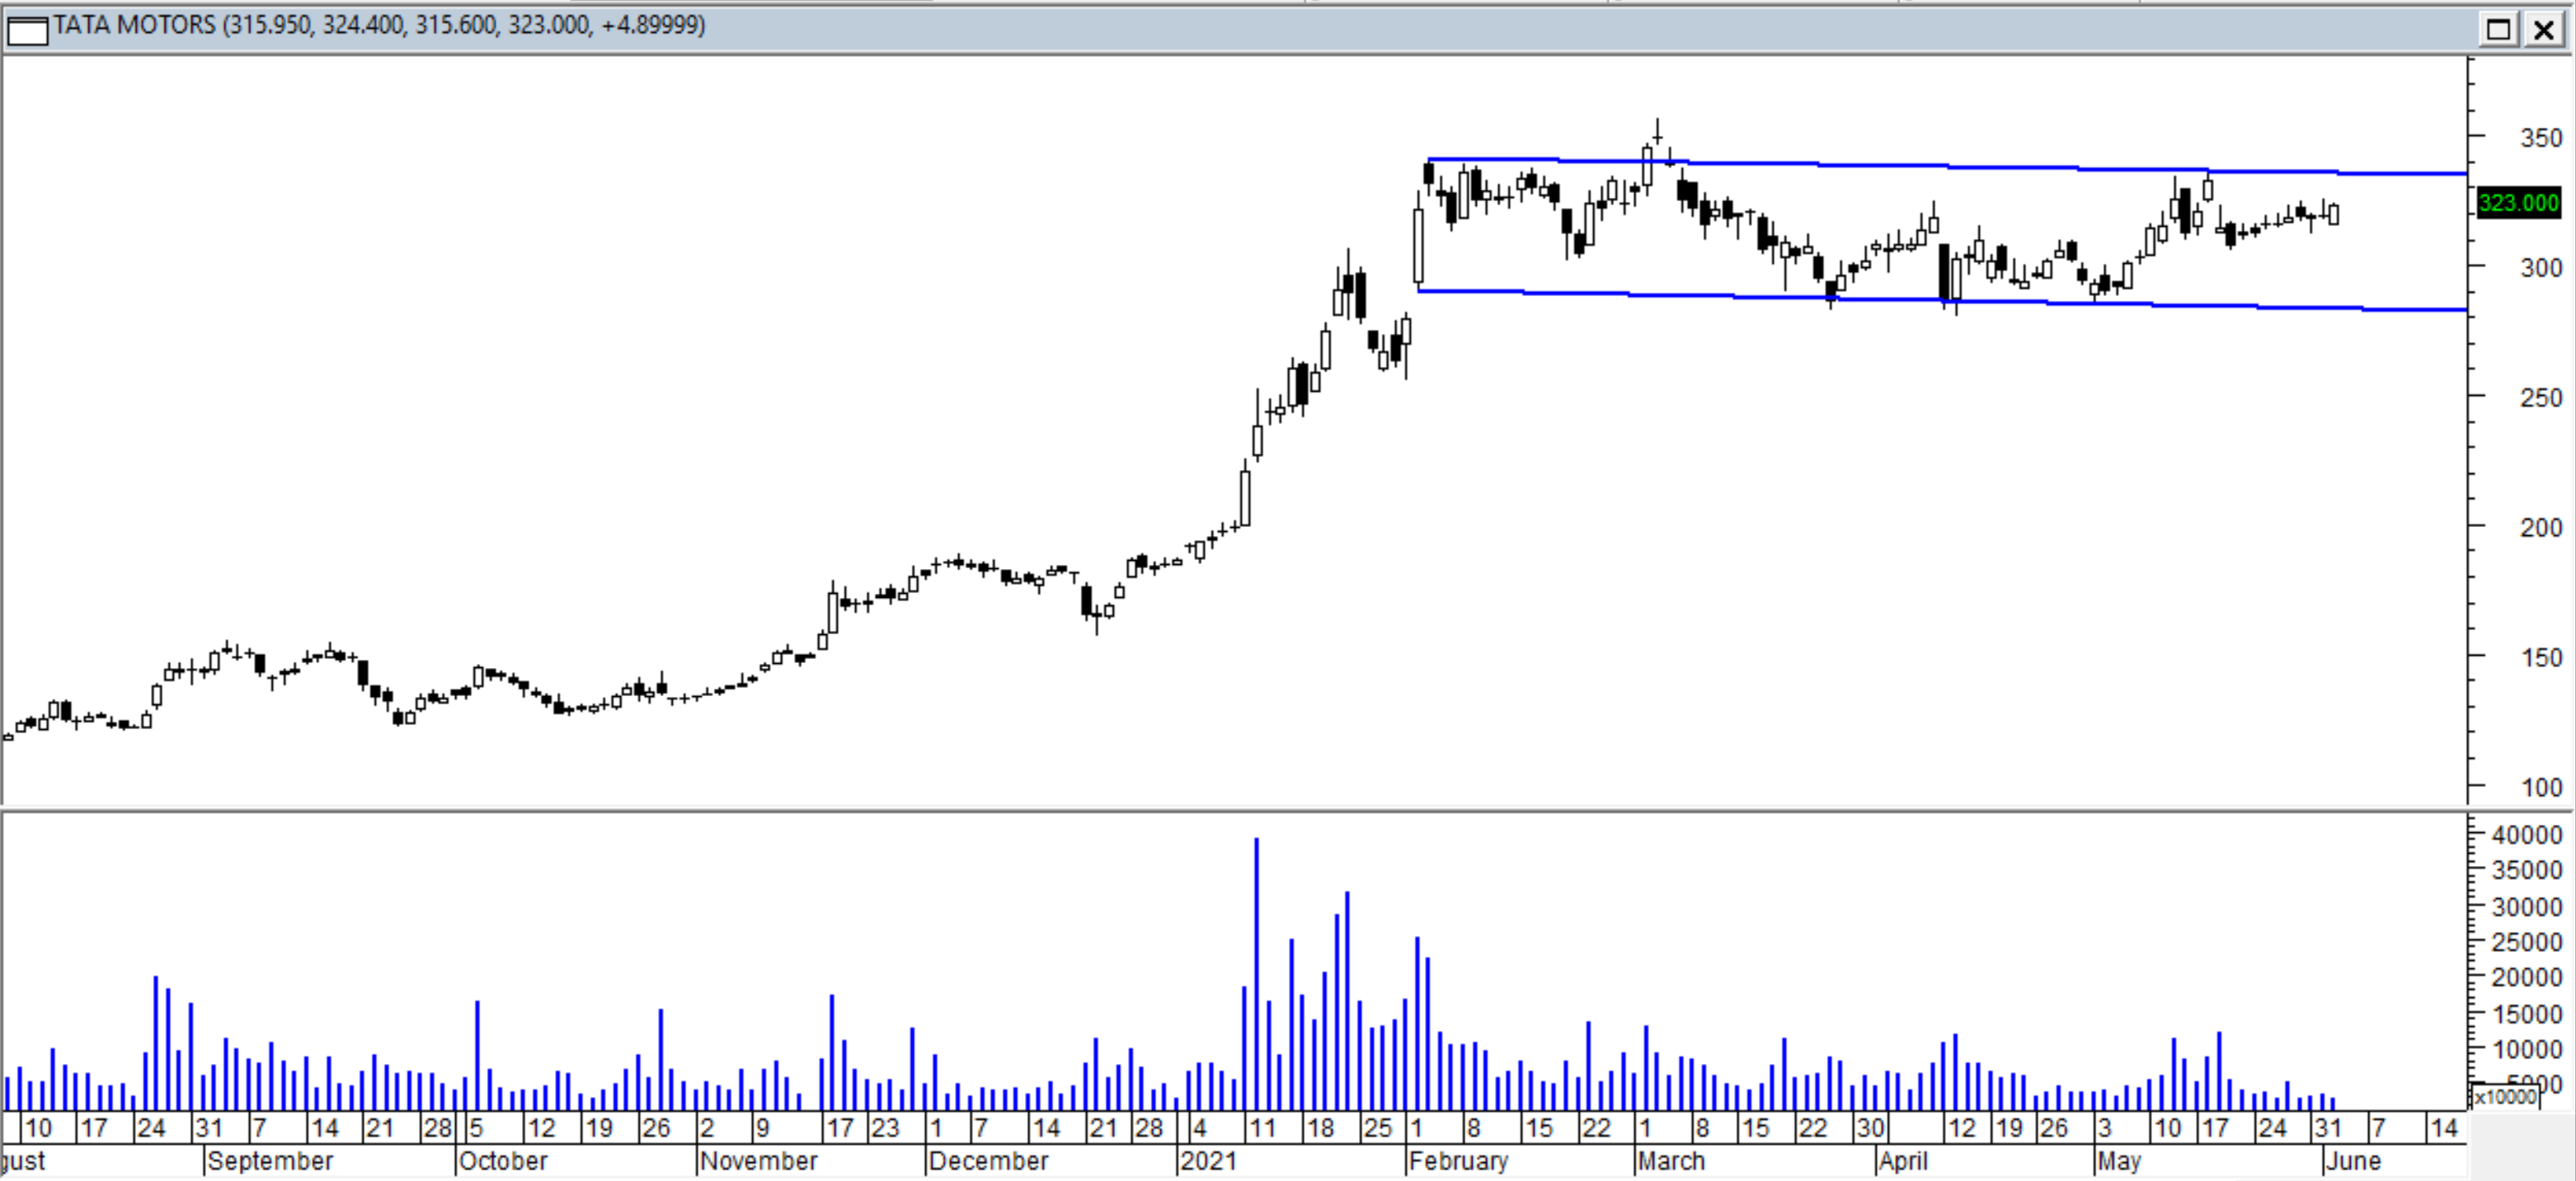
Tata Motors moving in a channel/box for last 4 months after a good rally. Though not textbook flag pattern but similar
5 Likes
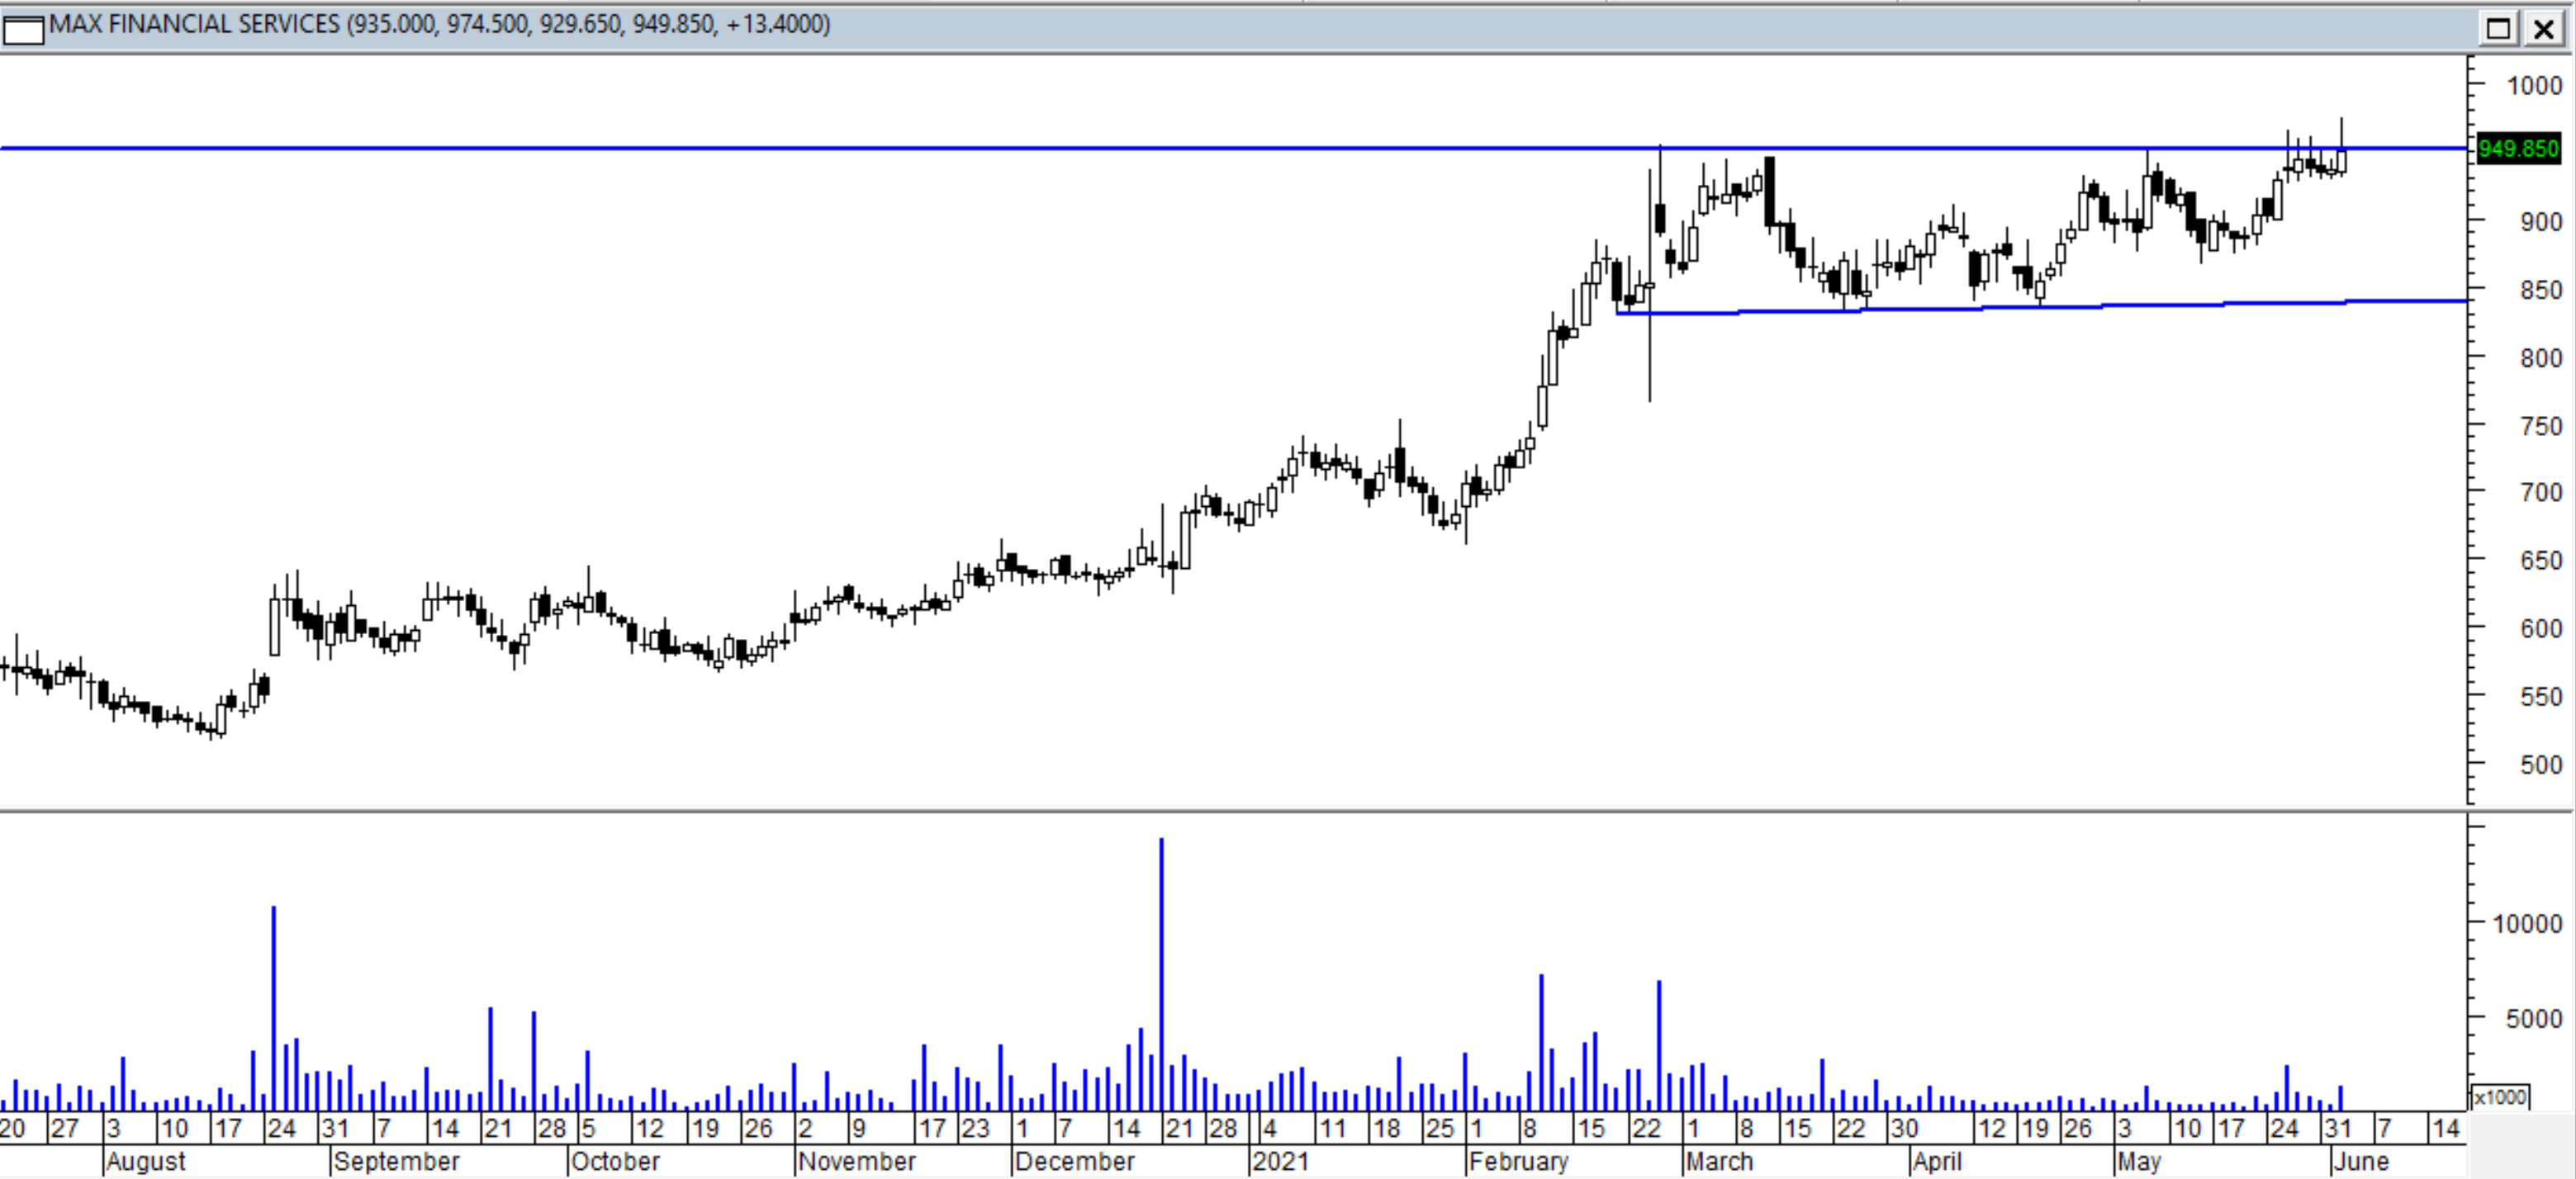
Max financial services cup and handle/ volatility contraction pattern.It has attempted to break out 3-4 times and has been in a narrow range without any weakness. Should clear the hurdle soon.
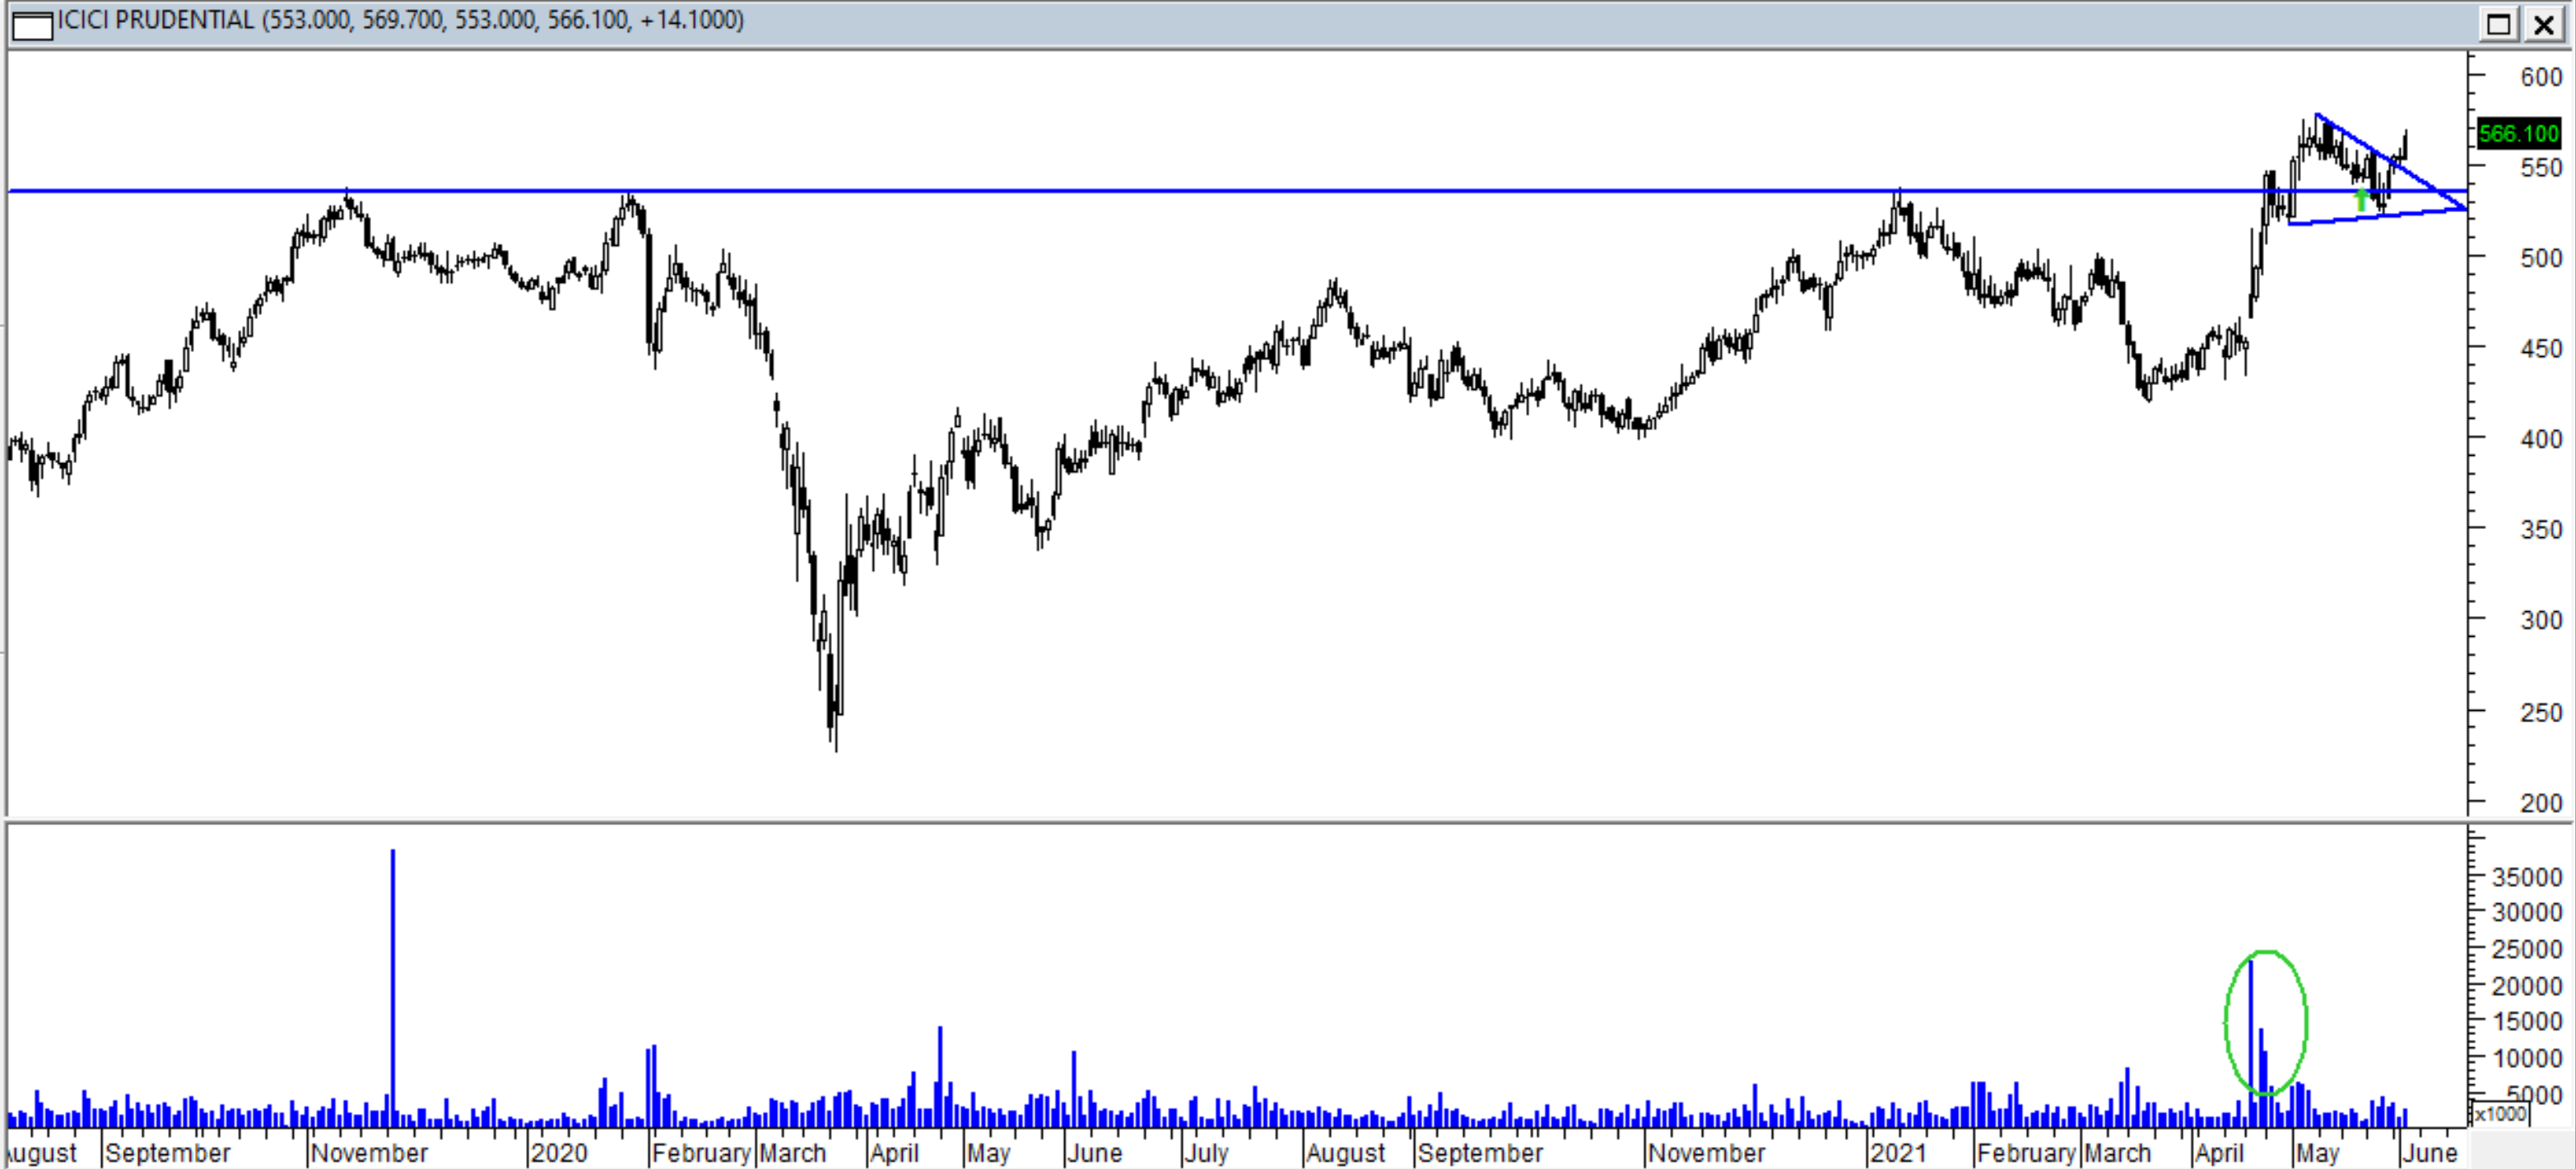
ICICI Pru gave a breakout from textbook Cup and handle pattern. and then gave a retest. It has bounced again. Looks good to clear the recent high of 578 and continue further
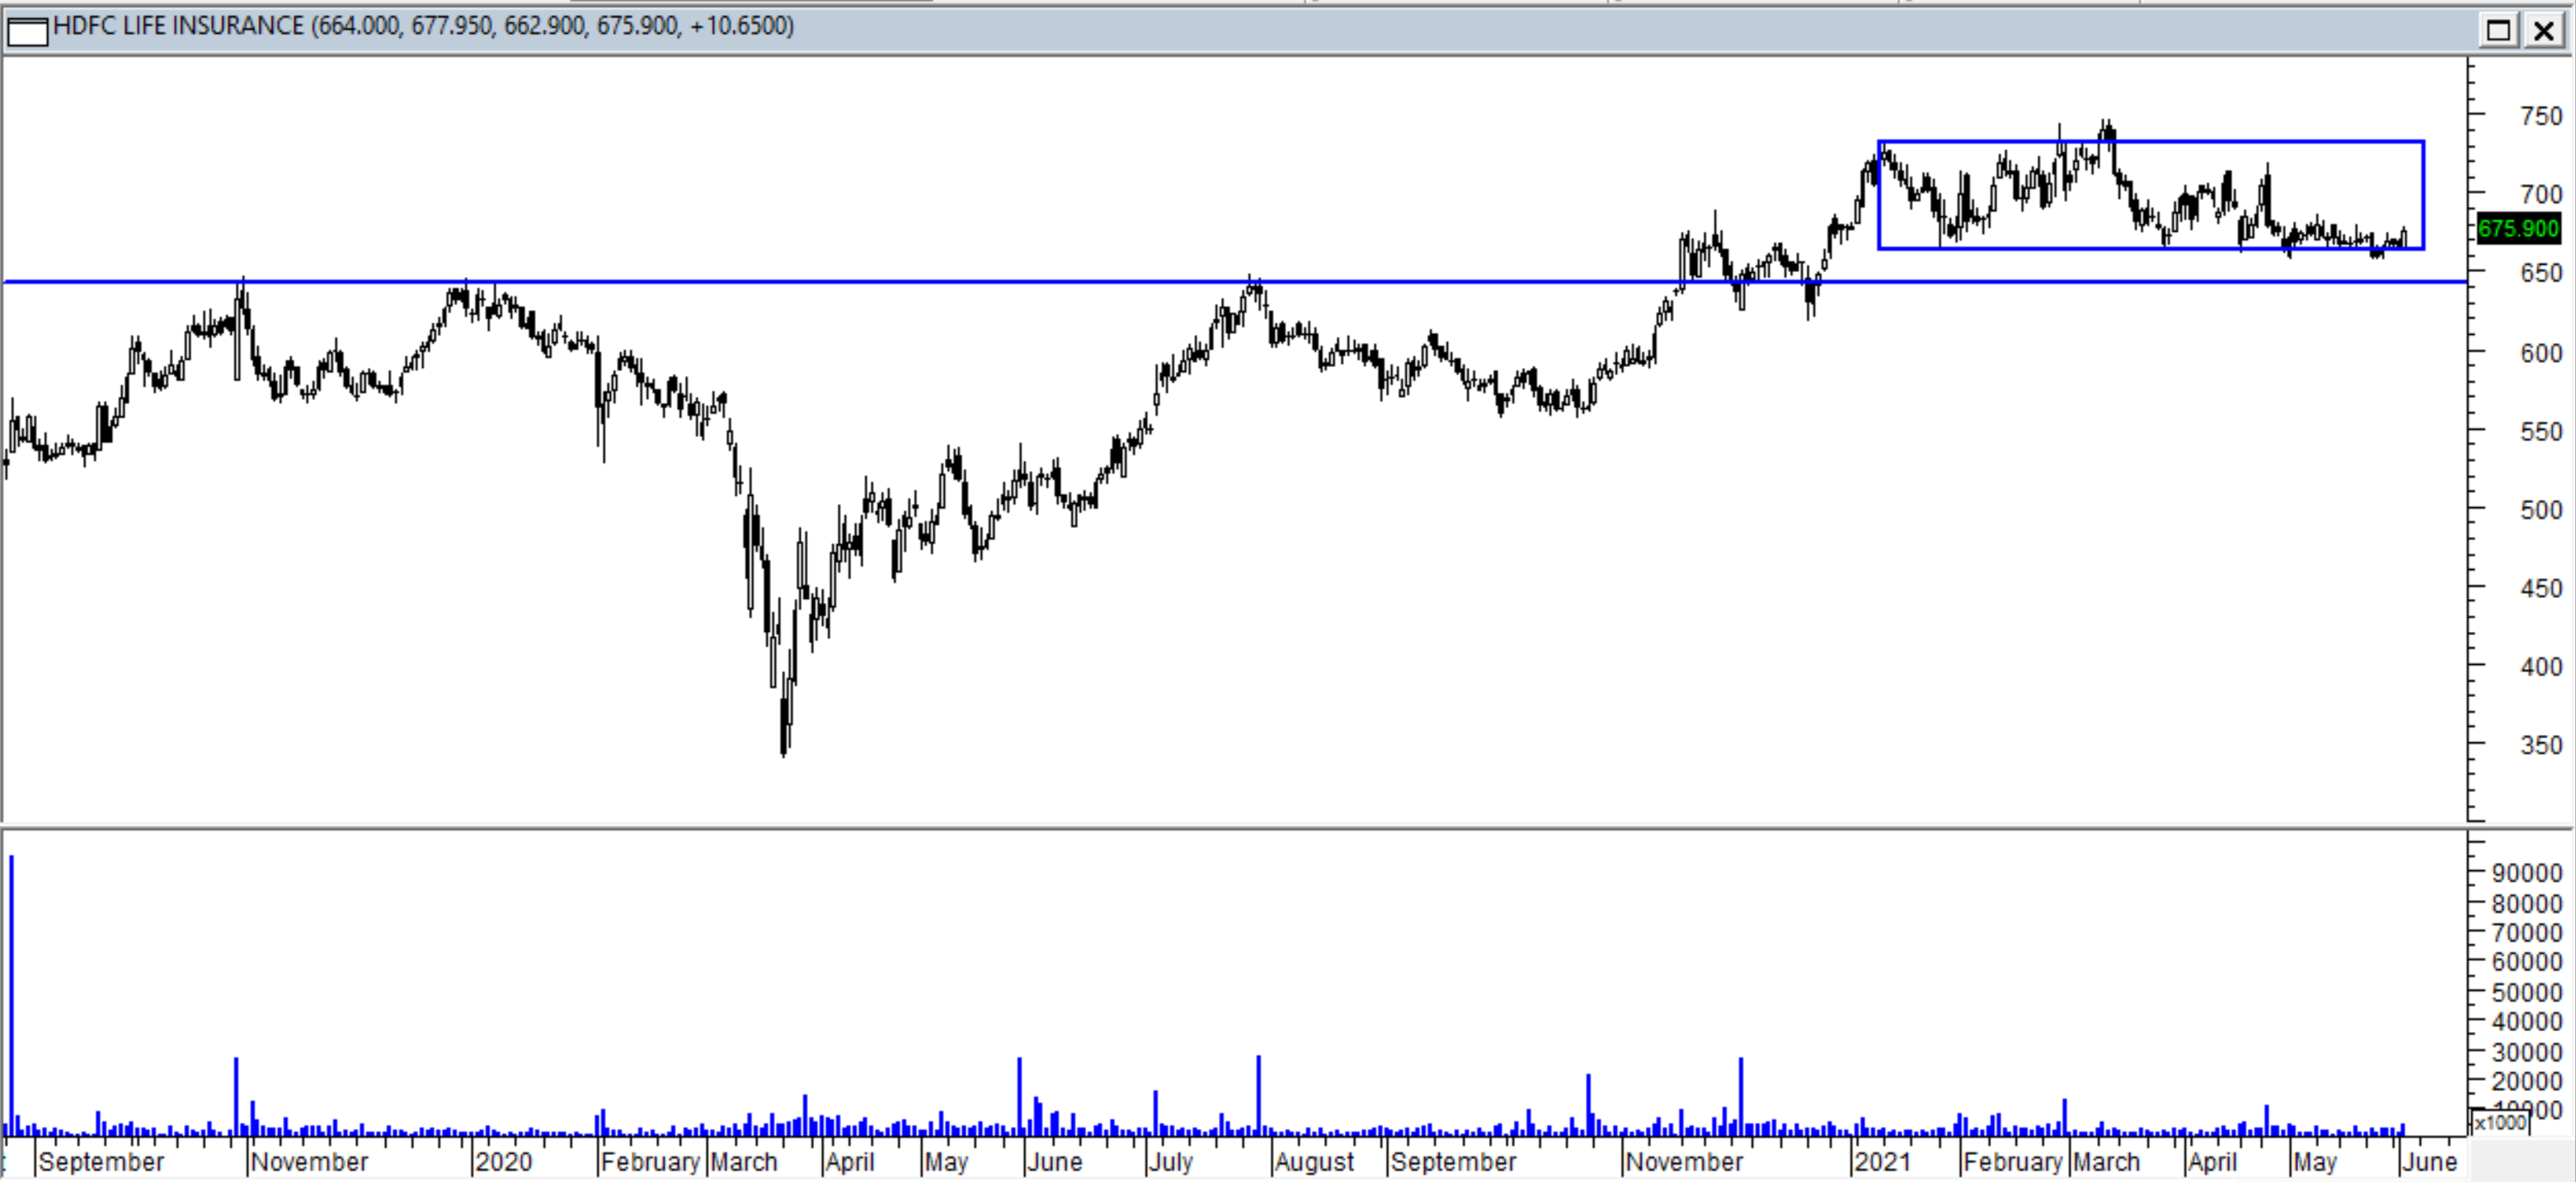
Since I have posted some of the insurance names, I am also including HDFC life, which did give a breakout into new highs but has been languishing for some time now. It is near support levels.
5 Likes
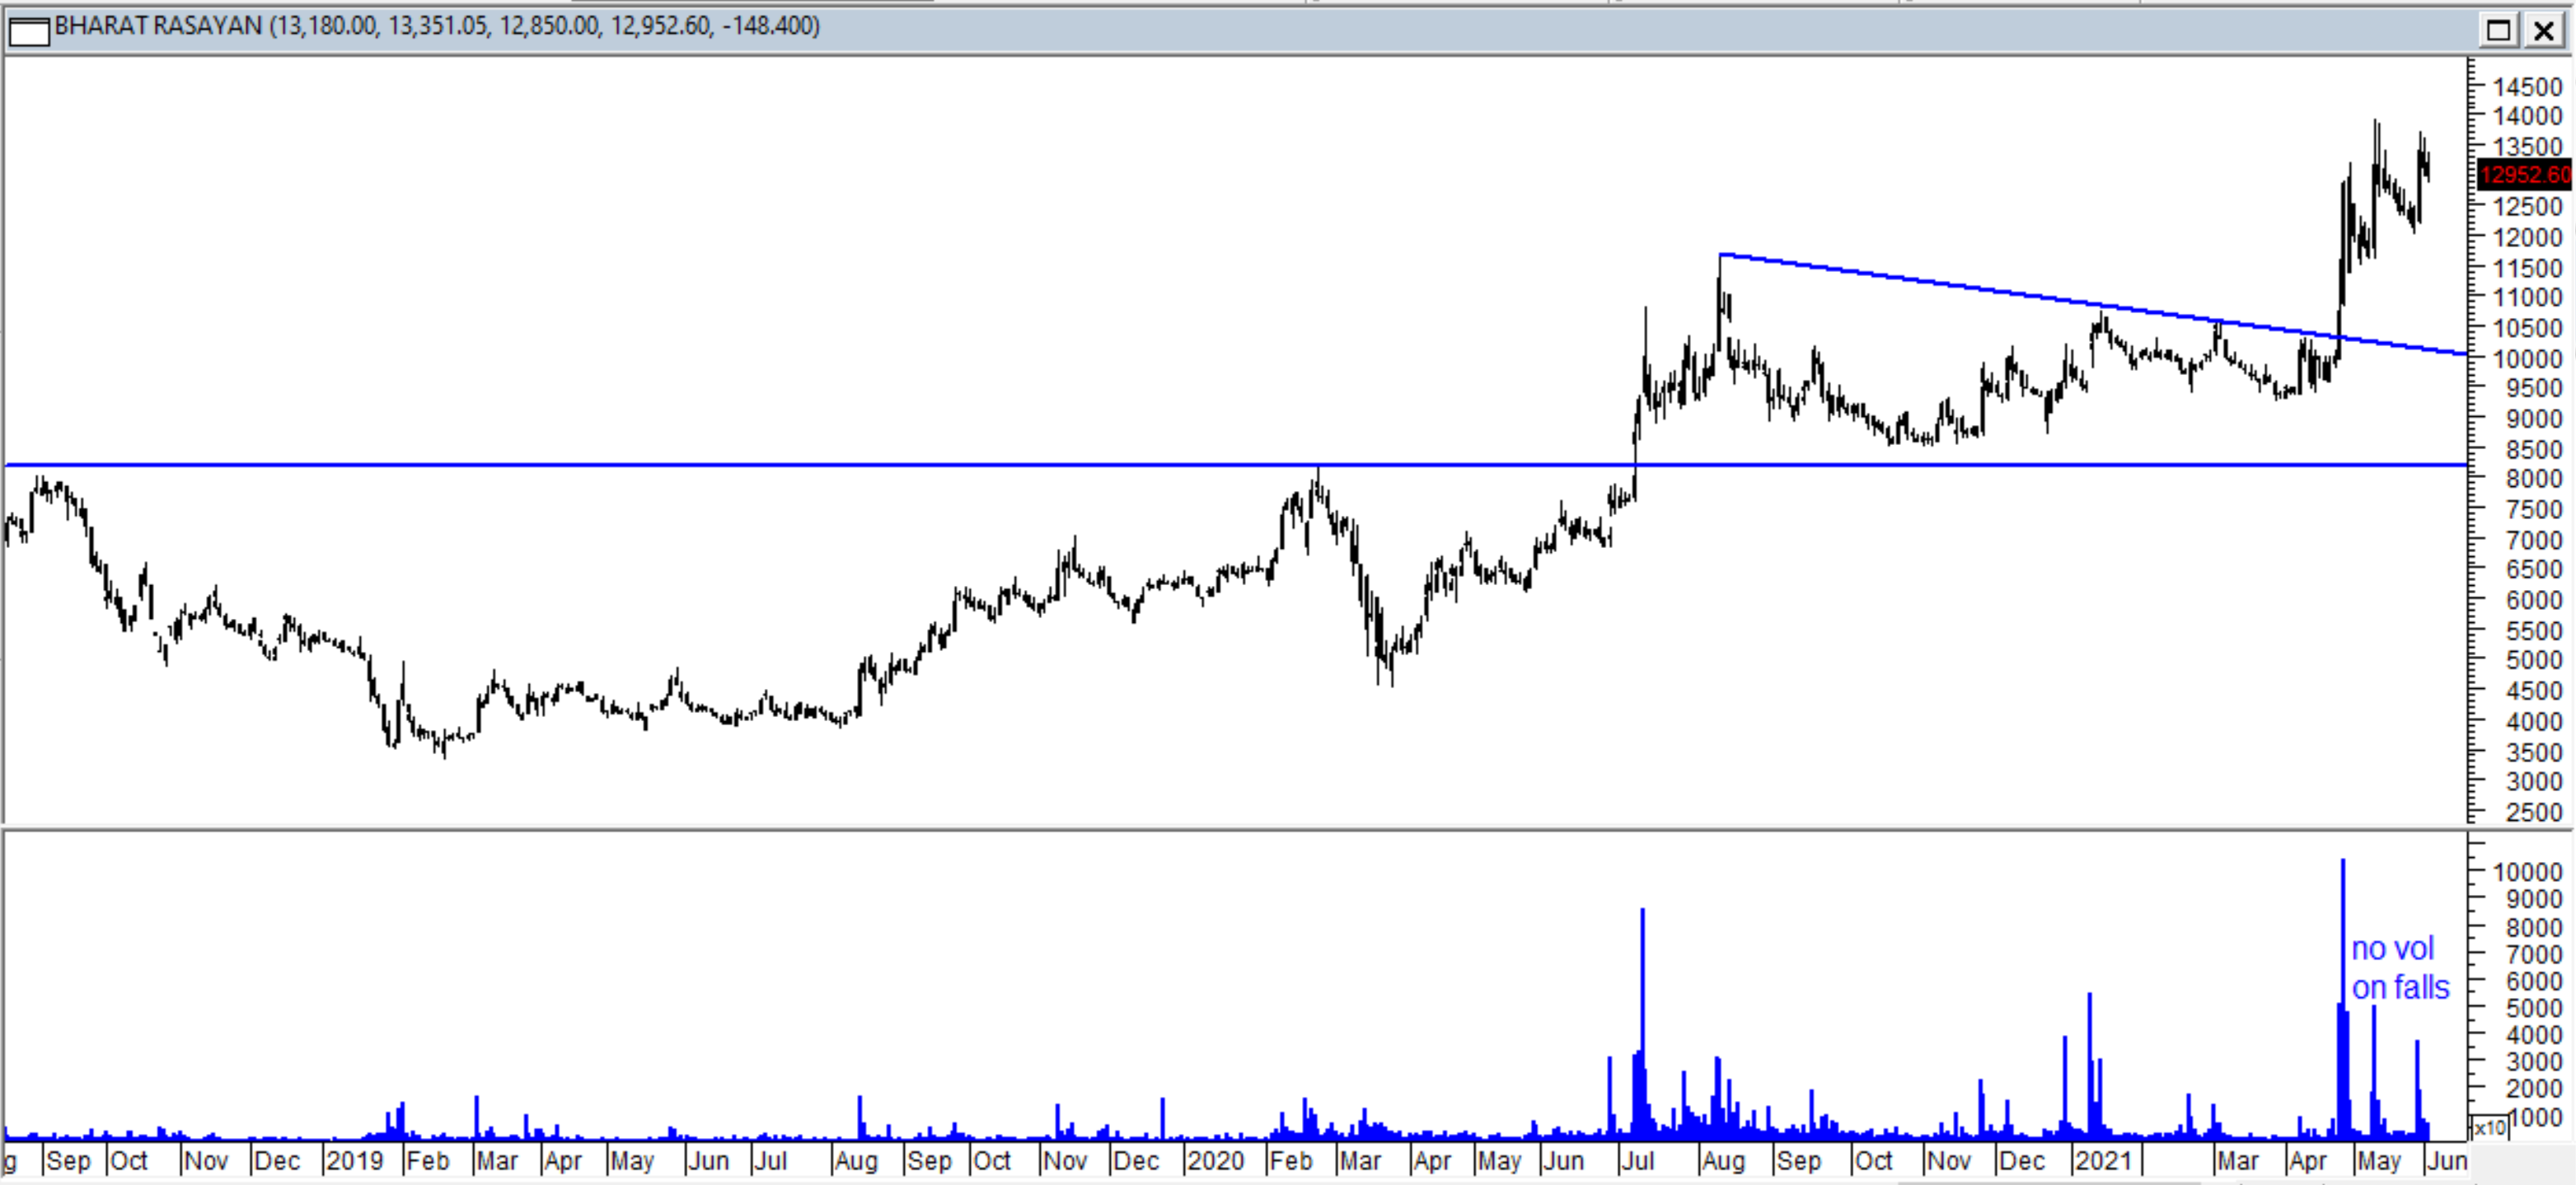
Another interesting chart- Bharat Rasayan
Nice Cup and handle breakout at 8000 odd levels followed by consolidation. It gave another big breakout with heavy vols in April end. There are hardly any volumes on negative days, and very large volumes on positive days
4 Likes
A lot of stocks and sectors are making fresh 52 week and all time highs these days. Goes to show the strength of the bull market. While looking at these charts and patterns, one has to look out for some sort of strong base formation before or after the breakout. This usually lends strenth to subsequent move.
And all throughout the rally there have been a lot of sceptics who have worried endlessly about the ground situation related to Covid and its possible impact on businesses.
But if we are practitioners of technical analysis, “OURS NOT TO REASON WHY.” is usally the motto. Personally I too was a bit worried about the second wave and its impact on real economy. But whenever I looked at the charts of various companies forming bullish patterns and most of them playing out, I used to derive comfort seeing these charts. Maybe markets were trying to tell us something and we needed to listen.
So as a compromise I tried to focus on charts where I could understand some fundamental triggers for the company and that has till date played out well. In hindsight, wherever I could not figure out fundamental triggers and did not take position, run ups in stocks have been much stronger.  But that’s something we learn to live with. As long as the portfolio performs along expected lines, its okay.
Now coming to what to expect going ahead, its anybody’s guess how long this rally is going to last. At a personal level I have tried to get into companies which earlier were out of favour and are now gathering steam. And in other stocks focus is on avoiding very illiquid companies with dodgy promoters or management even if the charts are super bullish.
While on the one hand a lot of stocks and sectors showing bullish patterns and most of them playing out, one gets comfort of the broad based rally. On the other hand, the question at the back of the mind would be “Is this going overboard?” . I would be keenly watching the strength in small and midcaps and as long as that is maintained, I would maintain bullish stance. If I see a market where only large caps are moving and small and midcaps are losing steam, I would review my position and take a call.
56 Likes
@hitesh2710 sir please share your views on the below chart base formation . Muthoot Finance after a year of consolidation with a good base formation breaking out with high volume. Selling volume was dried up during consolidation.
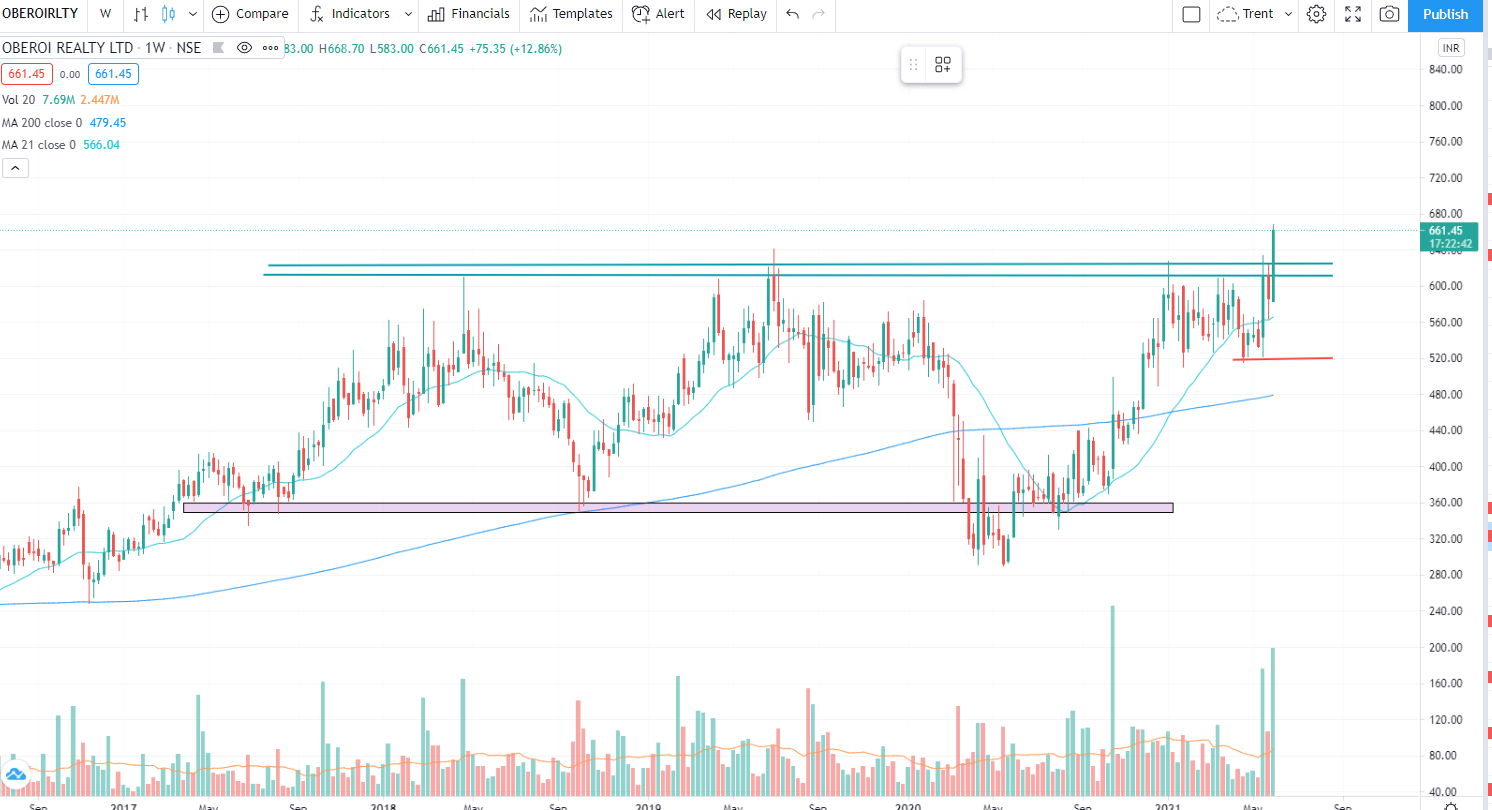
OBEROIRLTY also had a good base before break out.
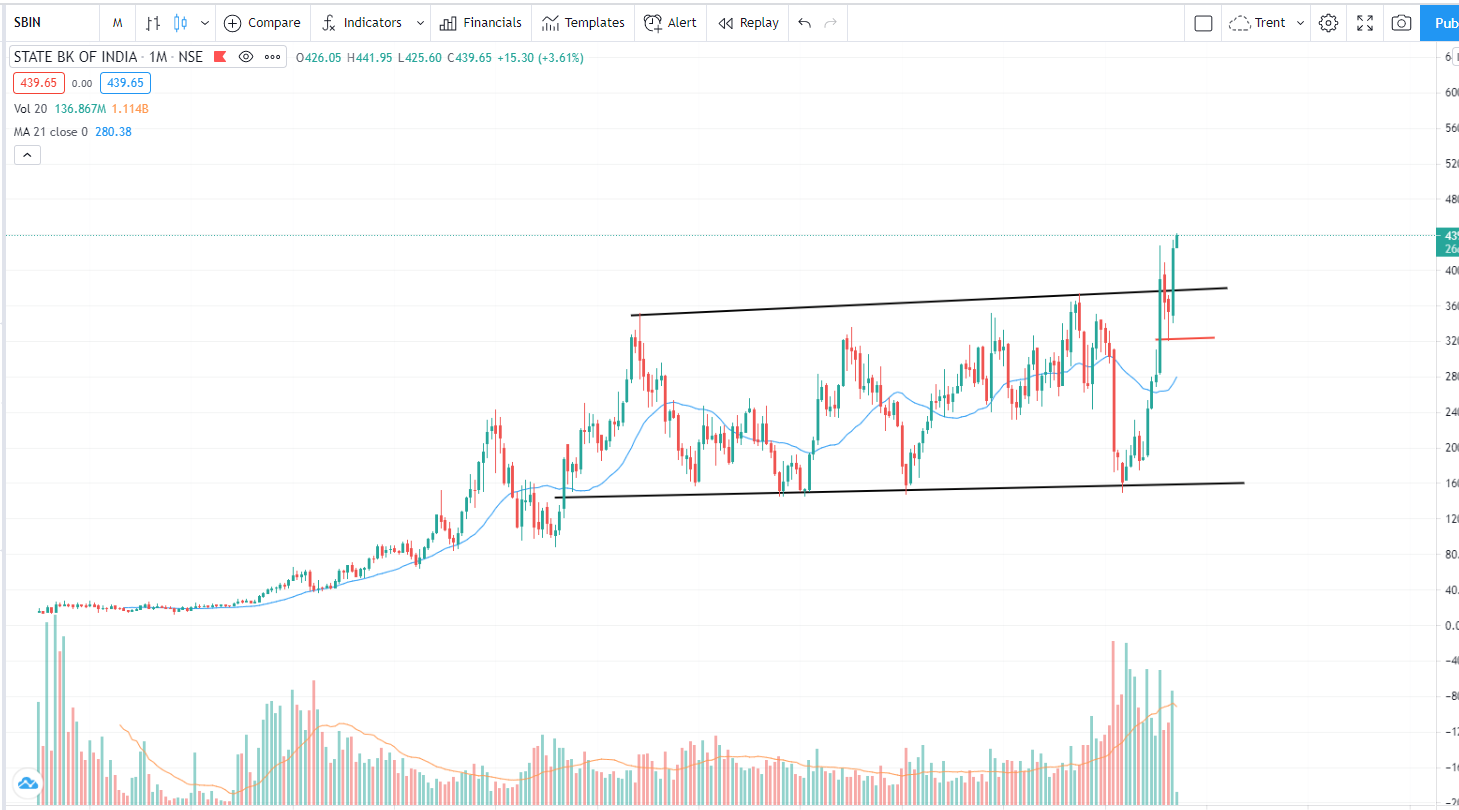
SBIN is trading all time high after 10 year consolidation.
2 Likes
@hitesh2710 @pikrohit thank you for sharing these. One area where i struggle is executing trades even with this knowledge 
Could you try to “think through” couple of these examples (let’s say Titan which is at the higher end of the range, and HDFC life which is at the lower end of the range) and tell us how you would execute them,
- at what price would you enter
- where you would allot more money
- what would you have as stop loss
Also, amongst these charts, which one would look stronger from a technical standpoint and why?
Thanks again!
Even the counter event may be a bearish sign where large caps start losing steam but mid/small caps keep moving up, IMHO.
1 Like
Great understanding of the market as always @hitesh2710 g. Seems sector rotation is in place and infra is getting traction after a long hibernation, just like pharma did last year. Small and midcaps are showing good strength but we need to be cautious. For momentum traders, this should be the best time.
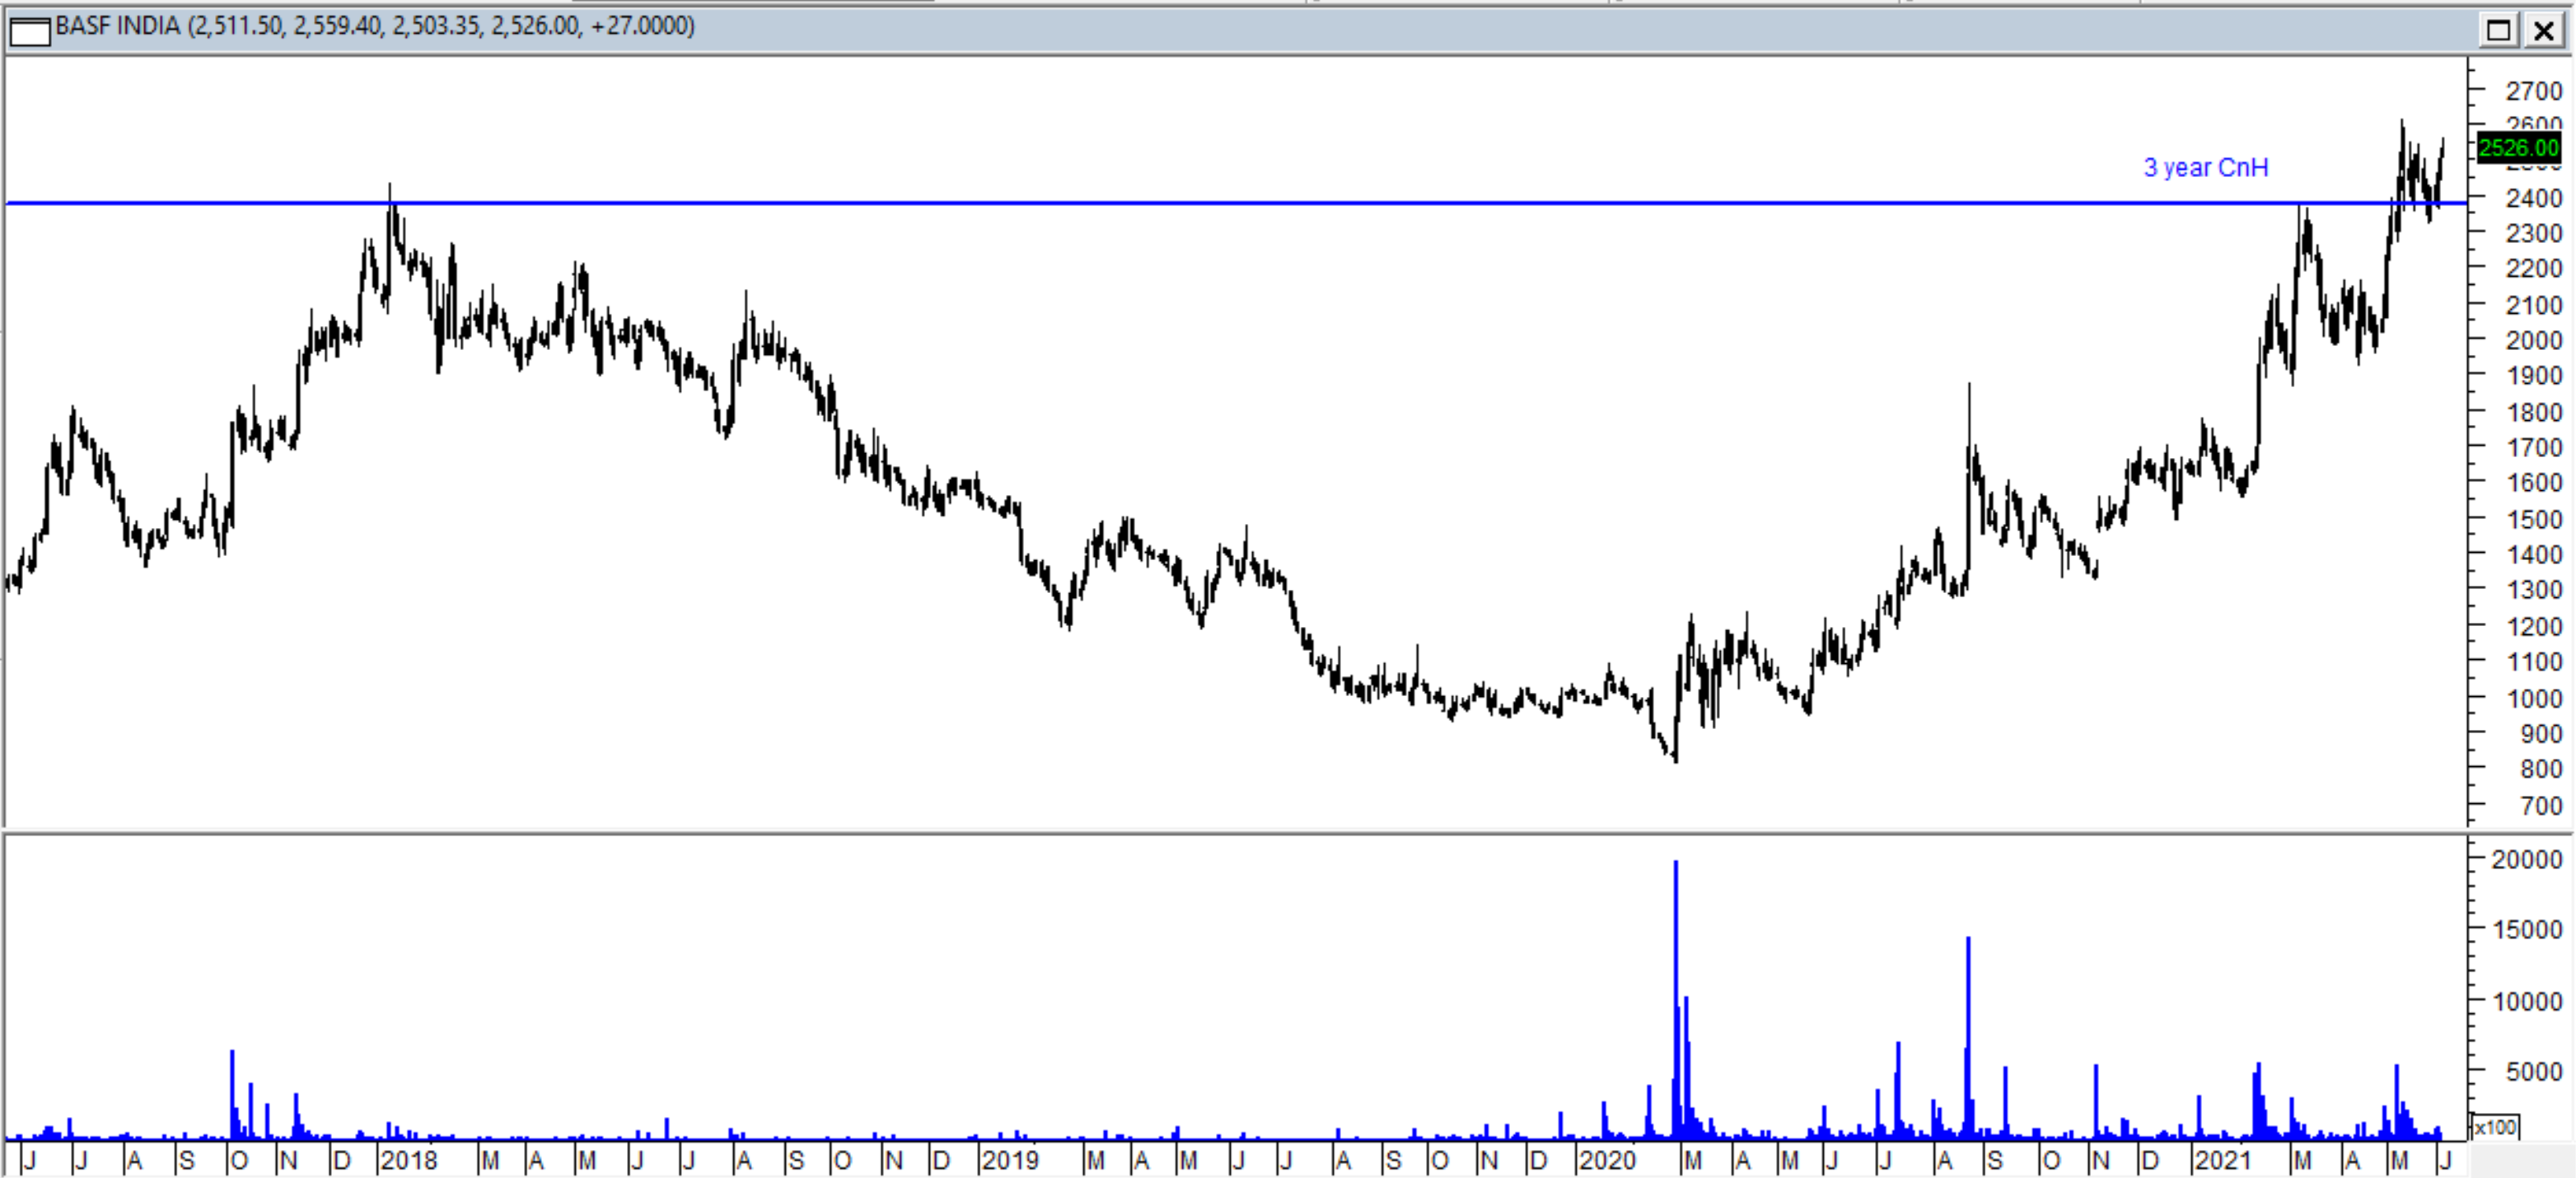
So these comments on example of Bajaj Finance and Titan were in context of buying breakouts. It makes sense to focus on the big long term breakouts (like BASF, Bharat Rasayan in July’20, possibly SBI Life in coming days). The reason is that some of these moves can be really huge.
I have the following priority list
-
Breakouts into new highs after multi year consolidations for example Balrampur Chini few weeks back
-
Breakouts into 52 week highs after relatively shorter duration patterns. I look for cup and handle, channel, triangle patterns, Flags
-
I generally avoid short term patterns like channels, triangles etc where breakouts dont take stocks to at least new 52 week high
I did trade the major Cup and handle breakout in HDFC Life around November-December, but made small profit only. Currently HDFC life is just moving near supports of that channel. I am not interested in it but it was included to compare with other insurance names.
I sometimes trade retests at supports when the pattern seems very compelling. I currently have a position in ICICI Pru (chart posted above), which gave a major breakout and then retested. The advantage with retests is that Stoploss is very small and hence risk:rewards are good.
One more example of retest trade is Indus Towers. The interesting aspect here was that its range was getting squeezed for last few days. Here you can see that there are multiple resistances around 265-270 and then 280 odd levels. So when I buy at 242-244, my risk is just 5-7 points. I might sell half at 265 and rest at 280. Thats a decent risk reward ratio.
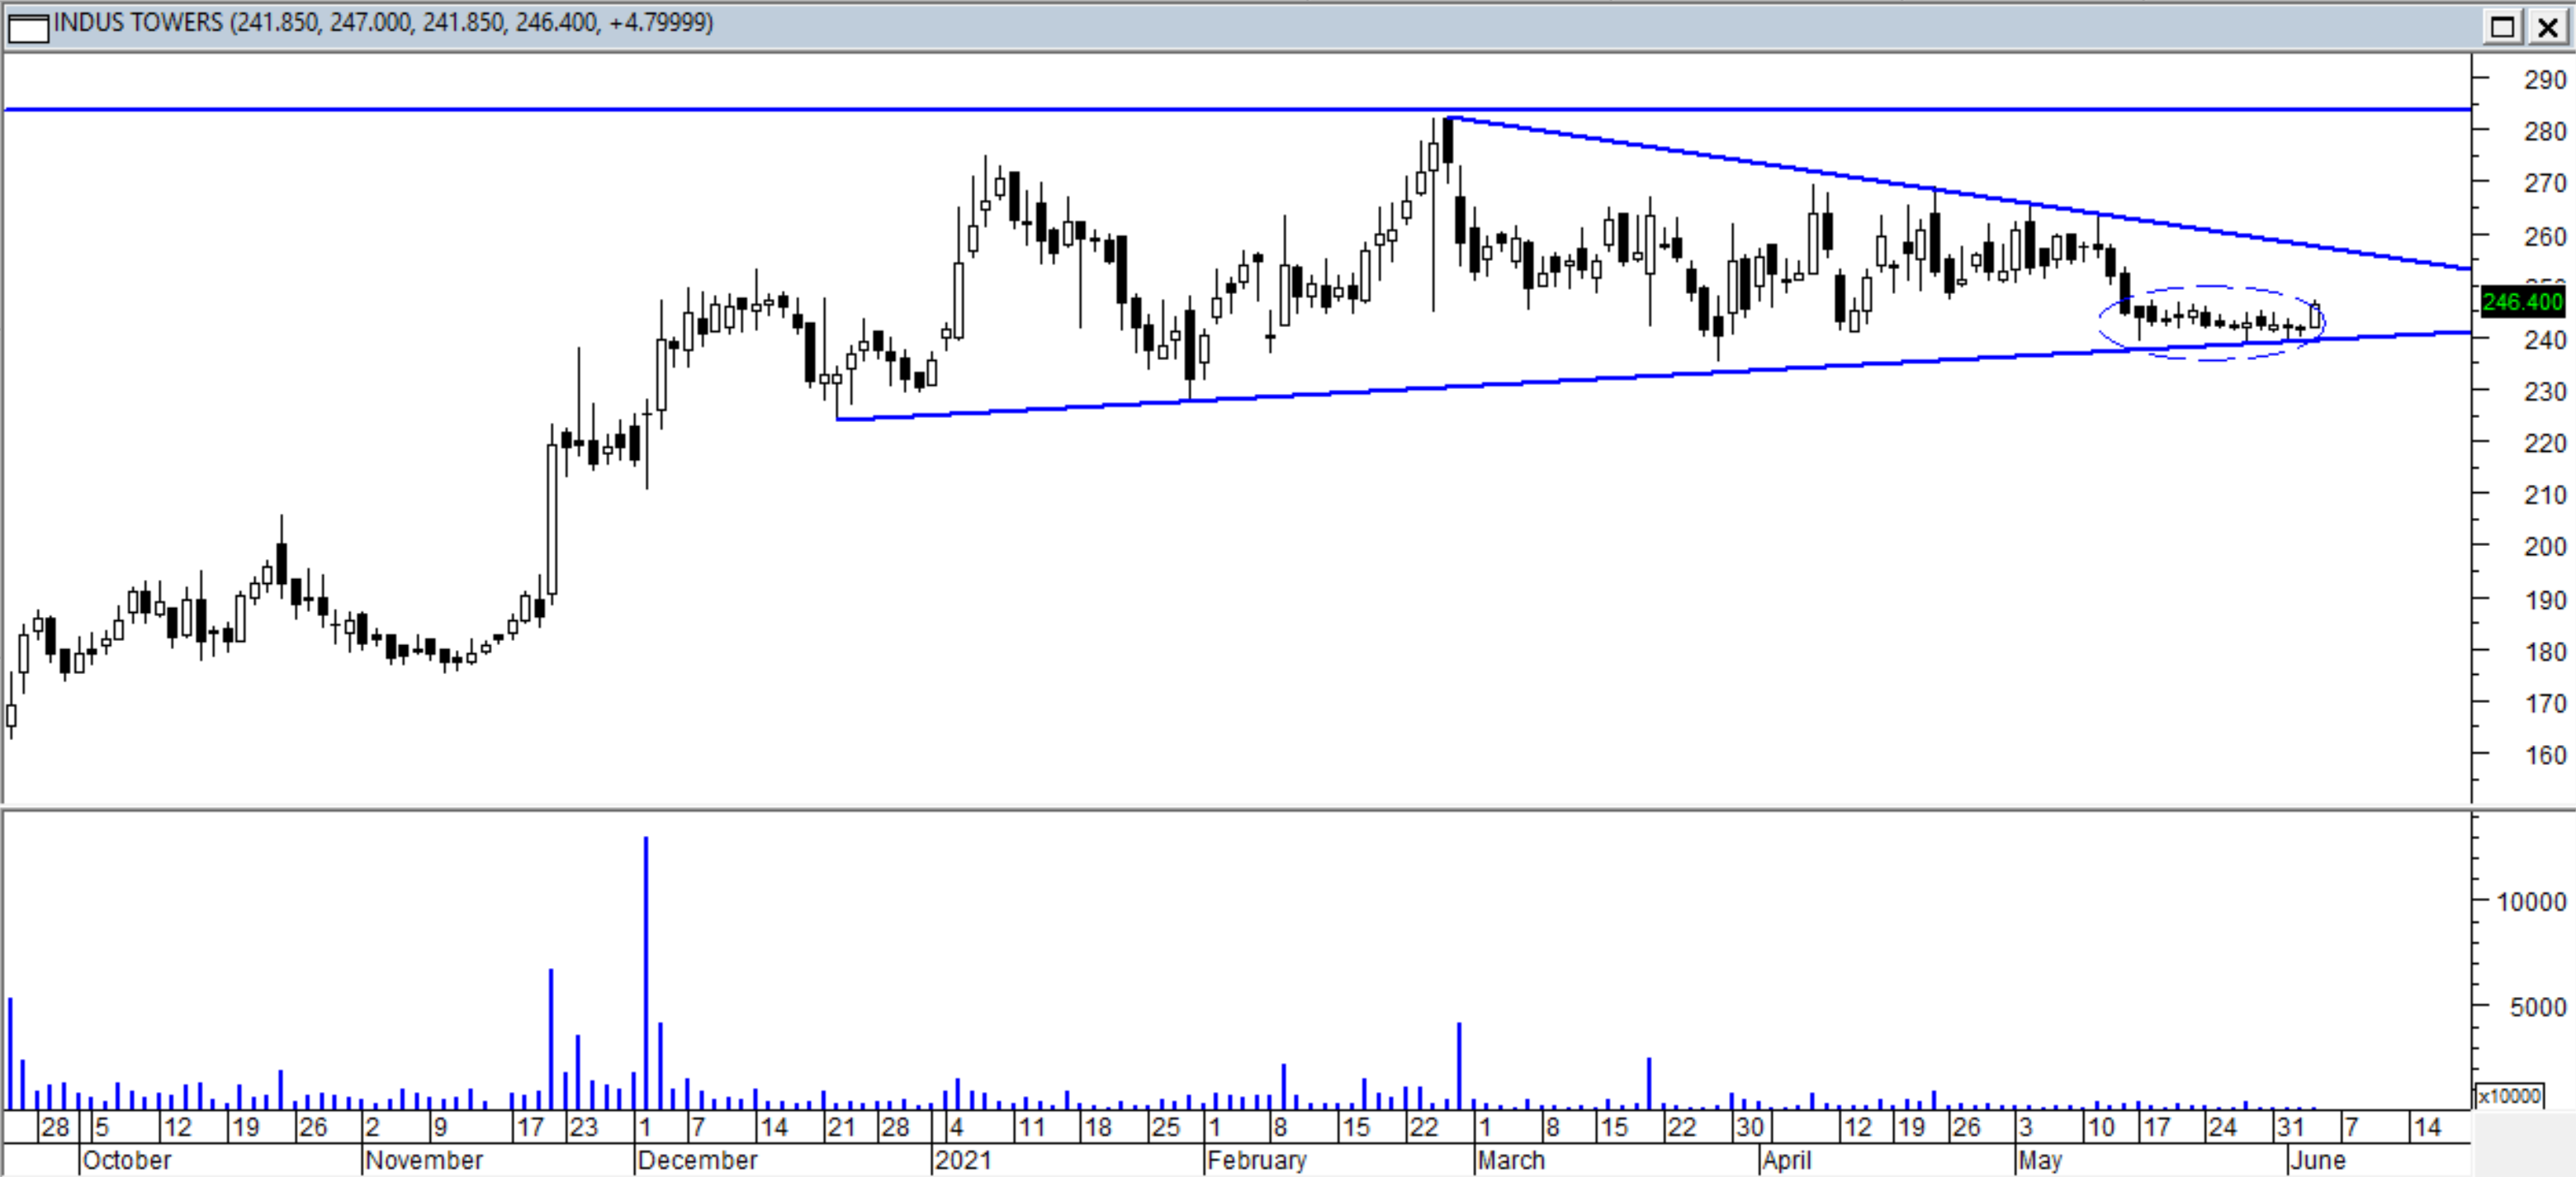
If I zoom out, you will see that 280 has been a resistance area for a while now. In case it sustains this hurdle, it will again be interesting.

10 Likes
I will use Bajaj Finance as an example. Here is what happened-
-
Step 1- I see that the chart structure is good. Classic cup and handle so I have it on my watchlist. It was in a very tight range for 5 days (marked in red) The volumes were contracting and 5580 was acting as a good support.
-
Step 2- On 26th may(marked green) the stock started to move up with volumes. Here hourly charts can also be used to compare the change in vol. I entered on this day with SL of 5570-5580. Ideally I should have probably let it cross that resistance line (5800) and bought above it. You can see that risk is not much (~220) from that price. Reward based on pattern , First upside target = 500, second larger target= 1300. So risk:reward is favourable. Our job is to find patterns with good risk reward.
-
Step 3- As it happens many times, the stock fell for next 3 days, but on lower volume. And it did hold my SL level. Normally textbooks recommend not to add a losing position but I did add small qty below 5600.
The stock finally gave a close above this line today and seems good so far. -
Step 4- Set a trailing stop loss and ride. This could be a moving average value. Book partial profits after first big pop, specially if you have a position in F&O. For example the move in Titan today was big, 5% move for a Nifty50 stock. The volume is also very high.
We need to do the homework post market and keep a watchlist ready for the next day. I had actually posted all these charts late last night (3rd June) but the posts appeared on 4th evening because there is an approval process. Anyway, you MUST set alerts to inform you when the stock crosses a certain price. When you get the alert, just buy if things look good on hourly charts.
16 Likes
hello,
nice to see people talking momentum. i am fairly new to the market but very keen on learning the ropes on understanding momentum more deeply.
few questions.
- how does one recognize sectoral shifts
- from the above how does one find stocks in momentum.
You can go through this thread from the beginning as well as other threads on technicals on VP. Plus read books on momentum investing or tehcnical analysis.
For beginners, best books to read are William O neil’s How to make money in stocks, The next apple by Ivayly Ivanov and Mark Minervini;s Trading like a stock market wizard. At least one of the three is a must to learn the ropes of momentum investing.
12 Likes
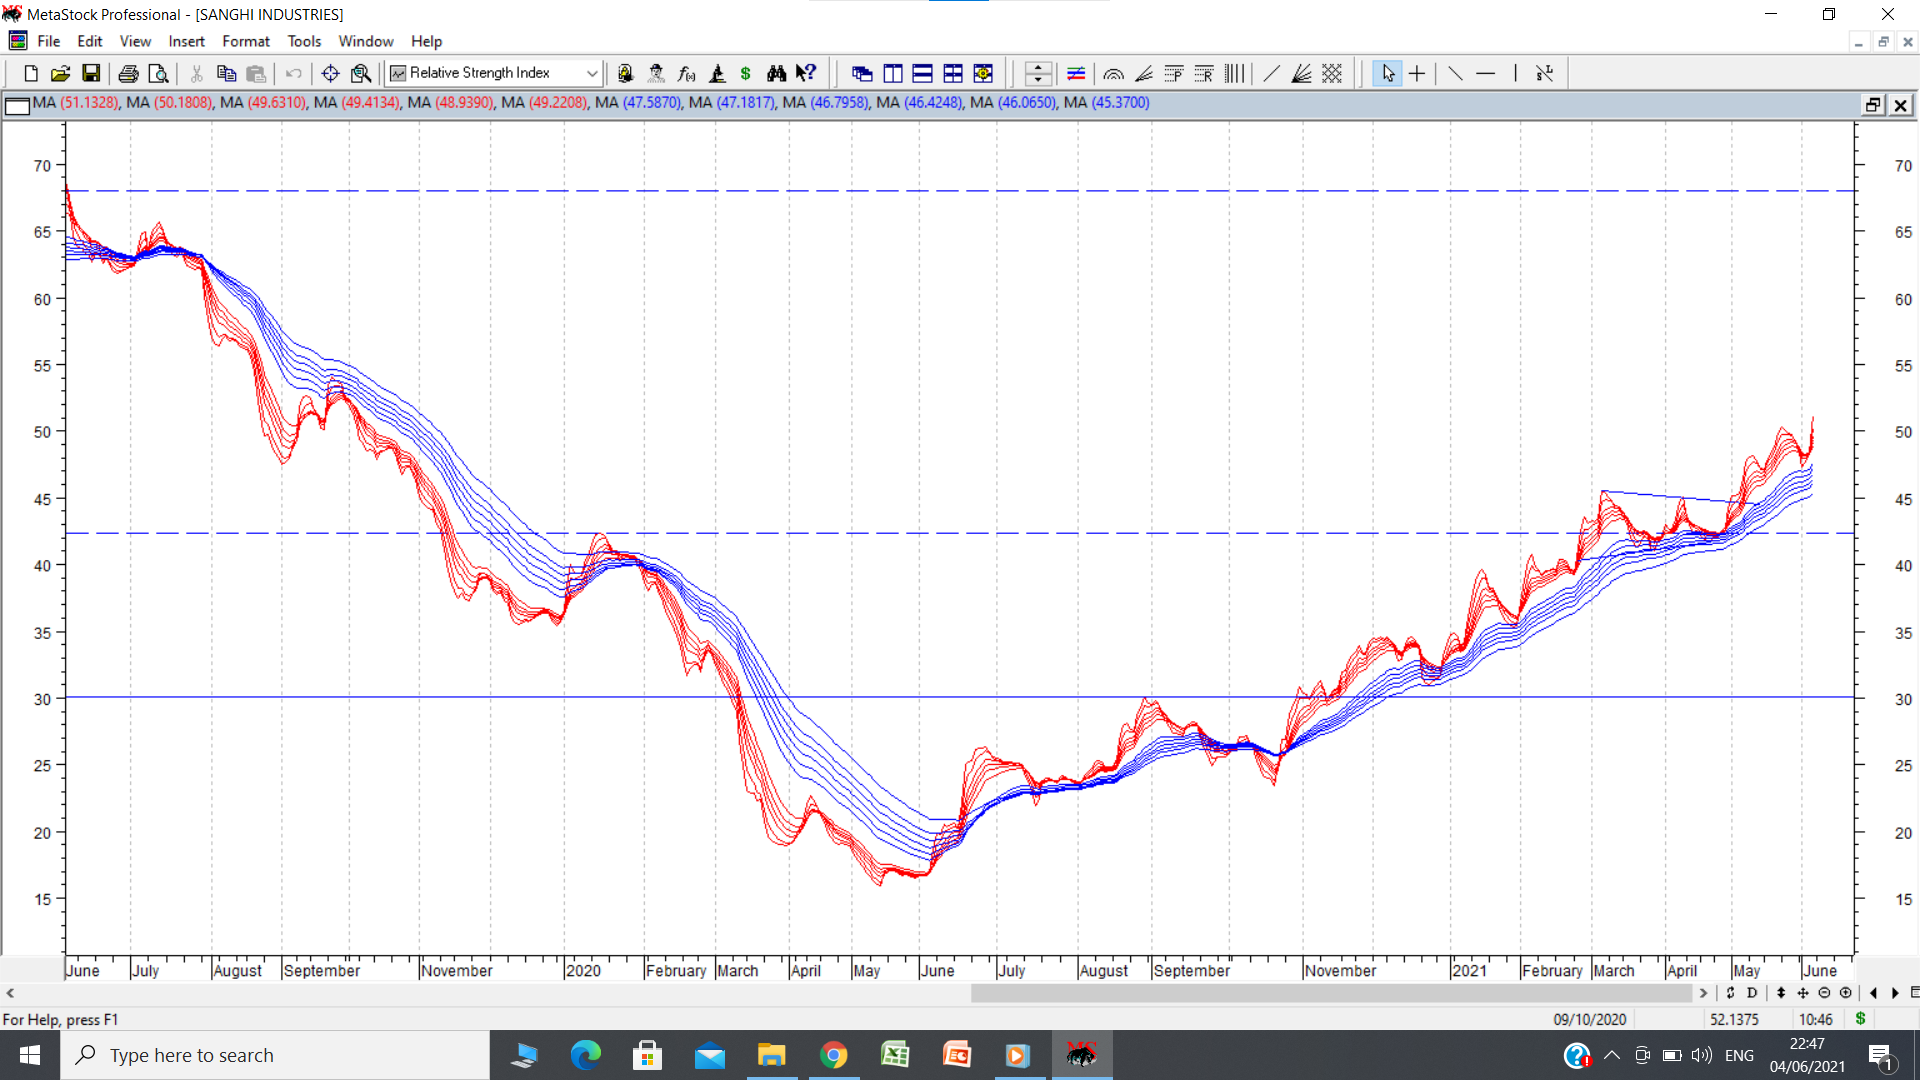
Sanghi Inds looks like an interesting chart. Posted chart shows strong consolidation above its breakout post 52 week high of 42. Stock consolidated in a triangular pattern for close to 3 months before breaking out conclusively above 45. Then it got stuck in a range of 45-50 for quite some time and today seems to have broken above this range. Managed to close around 55. Next target if this momentum sustains could be 65-70 or more. disc: have been invested since 40 levels.
5 Likes
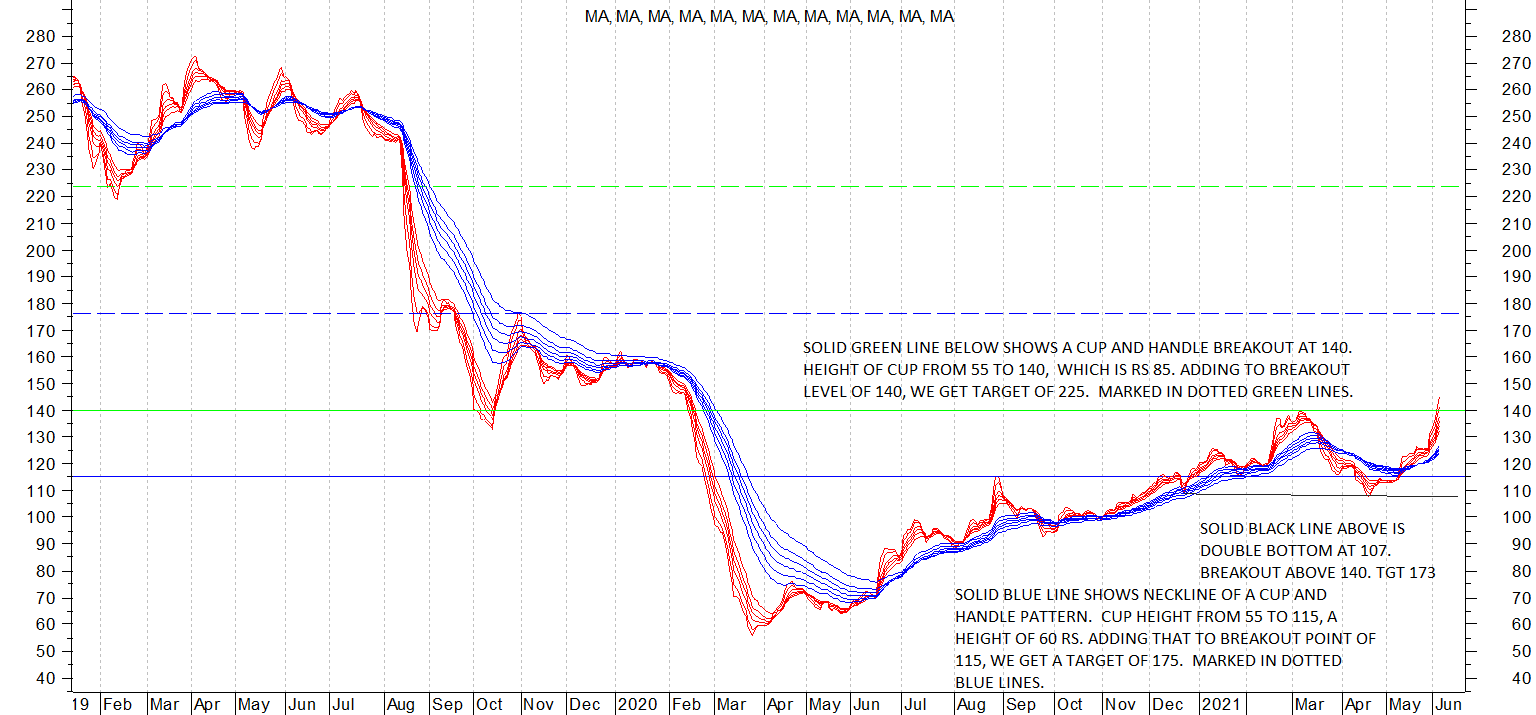
GIC housing chart posted below. Housing finance again seems to be in favor since past few trading sessions. The chart is an interesting study of various patterns in same chart. Explained in chart itself. cmp 150. Sequential targets if these patterns play out can be 170-75 and 225. Disc; invested since first breakout post 115. Fundamental wise too Book value at 228 gives some comfort in terms of valuations. Any slippages and NPA needs to be watched.
9 Likes
Hi Hitesh,
In both Sanghi and GIC housing there is huge over head resistance so price movement might be slow, are you ok with that. You also see fundamental story also while looking these stocks. I am trying to understand the thought process.
Thank you
Chethan