I understand that it is really tough to make a good exit but trailing stoploss is the main key, obviously one needs to revise it as per market sentiments & his own bearing capacity.
Ideally I keep a track on key events in the scrip / sector & review my stop loss.
If one has to take an example, a scrip is bought at 100 with expectation of 20% returns over a year. Due to momentum (expected once it has broken 52wk high or ATH) start trading at 130 within a month, now you have 2 options …
either book profit as it has delivered your expectations
Set stop loss at 120 (which helps you meet your own expectations from the scrip)
& keep revising this stop loss to a higher value till momentum continues
While buying itself you must use stoploss to protect your capital as well because market doesn’t care for your expectations and the scrip can go below your purchase price before hitting your set targets. This stop loss should be nearest weekly / monthly support line.
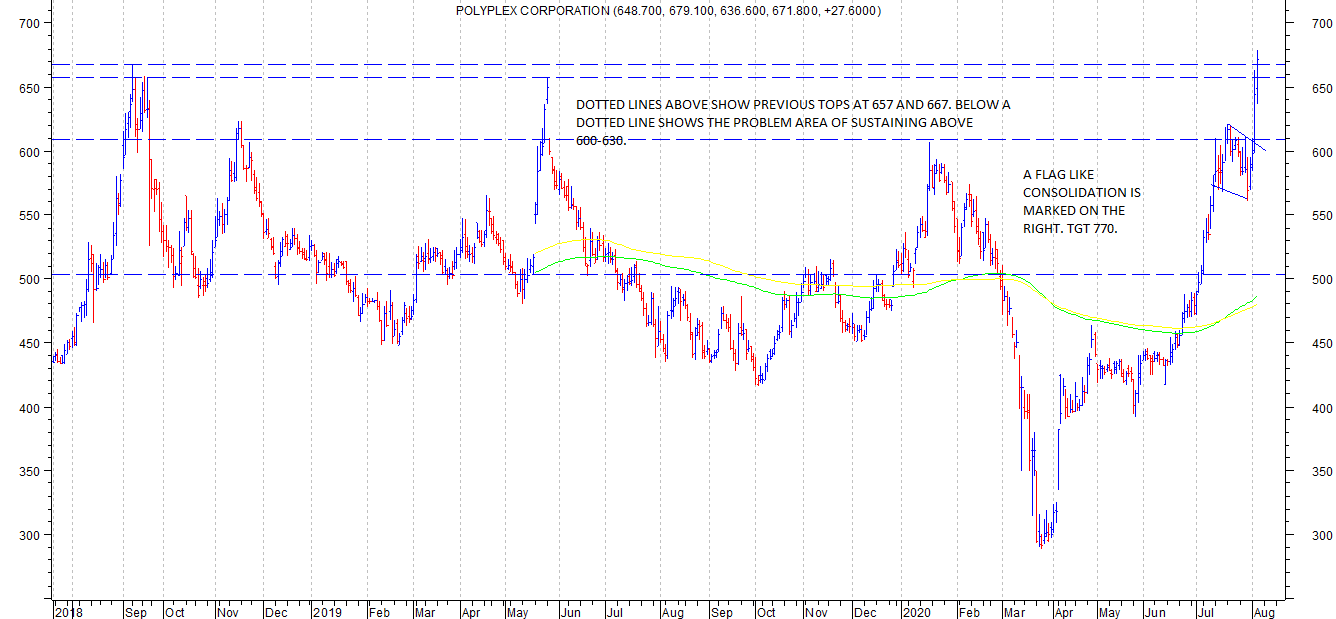
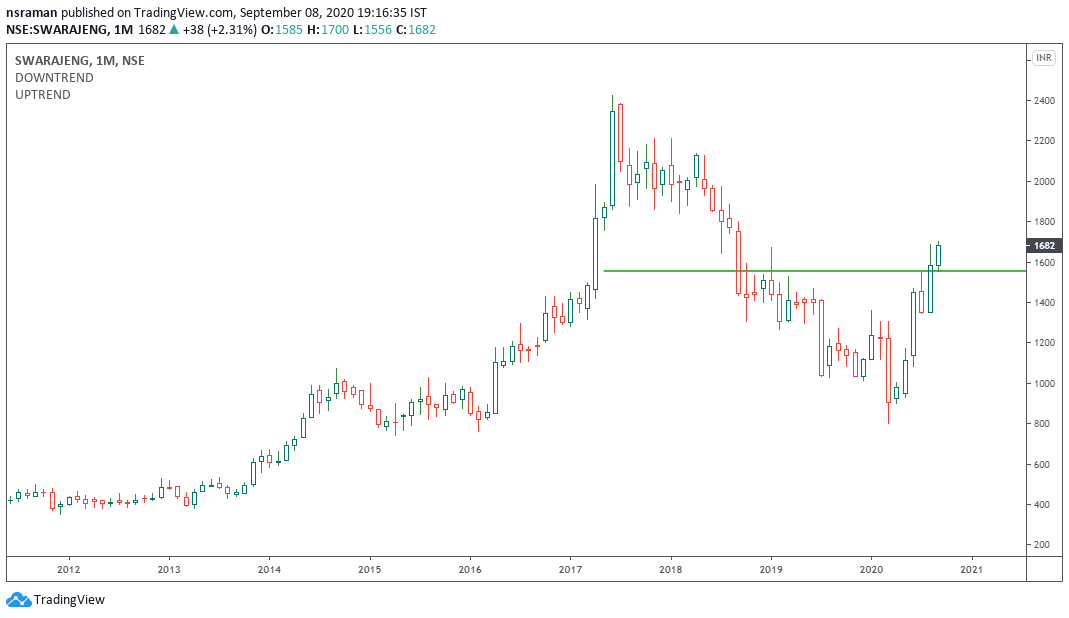
Polyplex Ltd today crossed its all time high previously posted in 2018 at 667. Post that there have been many unsuccessful attempts with the stock falling down from lower tops as shown in the attached chart. The region of 600-630 has been a strong supply zone for the stock in all past attempts. This time, as i had indicated in my portfolio thread also, since there was a strong tailwind associated with reduced raw material prices (PTA and MEG are raw materials and their prices remained weak due to weak demand from synthetic yarn industry which is in the dumps) and improved realisation due to higher demand for packaging films due to perceived benefits of the packaging during Corona outbreak. This double benefit was clearly visible in segmental results of SRF and Max Ventures declared earlier. In both these companies the packaging films division has shown superb margin improvement and since companies like polyplex and cosmo cater only to packaging films, results are likely to be good. Polyplex has a better balance sheet and investor friendly management as demonstrated by the hefty dividend payouts and recent buyback.
disc: invested in polyplex and cosmo films as an opportunistic bet.
Some observations regarding this all time high breakouts.
Usually look out for companies that have strong business tailwinds due to whatever reason. Charts will point to the companies/sector to look out for. Post that one has to do fundamental homework.
Once 52 week high breakout happens, the previous negatives that are there in the narrative no longer hold valid. Nobody worries about pledging/debt/promoter integrity etc. Most of the times this is what keeps most fundamental investors away from these stocks. And still the stocks keep racing ahead. Recent example was Laurus. Previous all time high was 640 and once it crossed that level the upmove has been very swift of course accompanied by fantastic results and encouraging management commentary. Similar thing happened with Alembic where previous all time high was 792 and one that was crossed, most of the concerns disappeared and market focussed on actual numbers.
Once the stock crosses all time high usually it goes up 30-50% from that level and sometimes doubles or triples or goes up even more.
Cipla at around 730 today, ath at 750, could be next in line.
Polyplex cleared ath of 668, and in the process going above the perennial supply zone of 600-670. It went down 3 times from this zone before finally suceeding. 720 now, strong weekly closing.
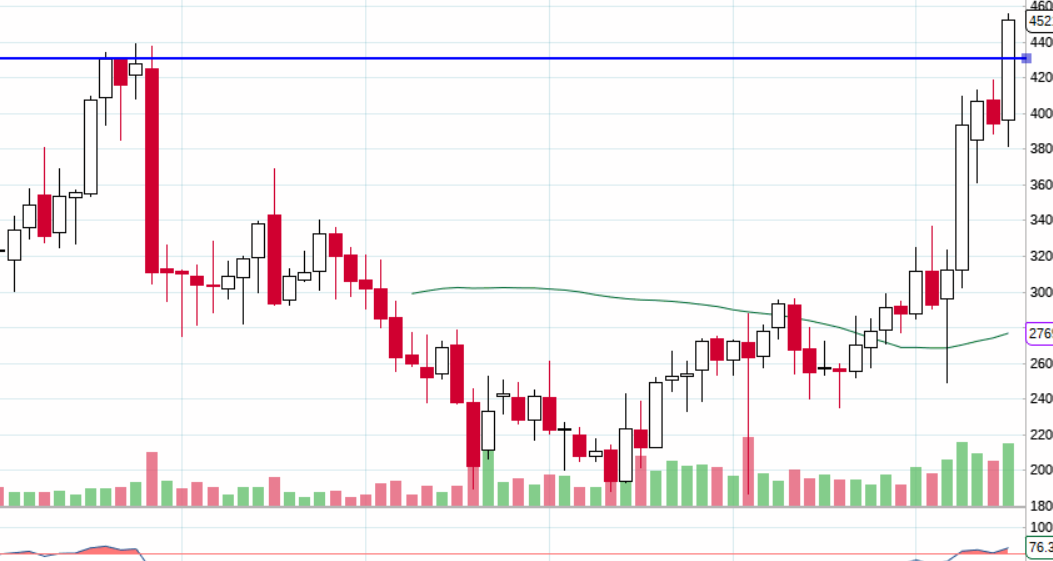
Next in line could be cosmo films. Cmp 440. Strong consolidation going on between 430-450. Ath 479, within reach.
Alkem crossed ath this week and posted super quarterly numbers.
Sir, does Aurobindo Pharma also fit this category …getting into all time high. Company has got good US Pipeline infact most number of ANDA , Europe revenue is getting higher , debt free by 2021 march. Negatives promotor pledging of shares
Thank you @hitesh2710 for your generous education to all of us. I have been investing in stocks since decades, but I have completely ignored 52 highs and all time high strategy for long. I am beginning to understand and appreciate the importance of it and many thanks to you again for elaborating in details various questions our fellow investor are asking.
I can see there are quite a few web sites to view technical charts, but not sure which one to use.
Could you suggest your preferred web sites to see charts?
I had tracked few all time highs breakouts in 2017 (the peak of bull run of small caps). All were decent companies, . But current prices are decimated.
Action construction equipment broke out from 60 odd levels went to 200 levels. (CMP-57)
hitech gears broke out from 400 levels went to 600 , CMP- 126
Munjal showa broke out from 250 levels went to 31-, CMP-115
Purvankara broke out from 150 levels went 180, CMP- 42
Shivam Auto broke out from 75 levels to 105 , CMP-14
JBM Auto broke from 310 levels, went to 600, CMP- 224.
The point i am trying to raise are
Arent multi year breakout stories supposed to be a long term opportunities
If we are using it for trading, then should we enter immediately on breakout /retest of breakout line. Further if prices have already risen, maybe the move is over rather than a buy on dips opportunity.
3.Wont it better to trail our positions with stop loss to protect the profits
As currently pharma, chemicals and agri are the themes, in 2017 auto was a major theme. So would request the seniors to guide me and also to further give their views on what can go wrong on this 52 week high strategy.
(P.S-This post is for learning purpose and not questioning anyone thought process)
First of all, we have to figure out whether the company in question is a cyclical or structural long term story. If its the former, one should be conservative with respect to the targets, and keep a trailing stop loss at an appropriate place and keep raising it as stock price keeps going up.
With long term stocks, idea should be to ride as long as trend lasts and/or earnings continue.
KAVERI SEEDS has come out with very good results for q1 fy 21.
Some positives:
Company seems to be walking the talk. 15% topline growth and 25-35% bottomline growth.
Cash rich balance sheet. 524 crores cash post q1 fy 21.
Business getting stronger due to gradually increasing contribution from non cotton crops.
Very good capital allocation strategy. 300 crores to be kept as war chest and rest to be distriubuted to shareholders. (history of consistent buybacks in past)
Valuations reasonable. (company can do 53-55 rs eps for fy 21, nearly 50 done in q1) PE of around 11 based on current price of 600-610. For a company showing consistent growth, good prospects (if rice plans fructify) and net cash balance sheet.
Negatives:
Forensic audit report yet to come about. (no idea about its developments)
Tax issues which were raised in the past by some boarders in the Kaveri thread post which stock went up 4-5 times.
Constant supply due to unwinding of position by Mohnish Pabrai funds. (no idea when the selling subsides, but I consider this as an opportunity for medium to long term investors)
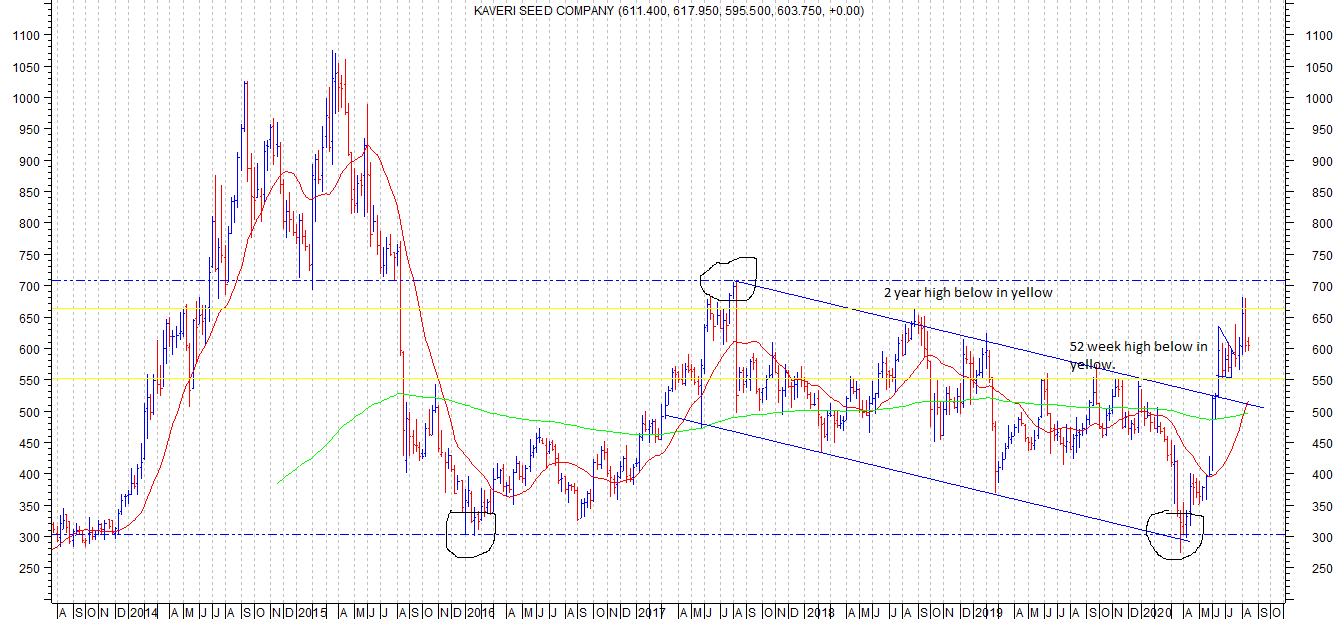
TECHNICALLY, the stock crossed its 52 week highs by crossing 570 levels and has managed to stay above those levels , formed a flag and hit a 2 year high by posting a recent swing high of 682. Post that it has come under selling pressure and consolidating with support in the range of 595-600.
Stock formed a double bottom pattern (shown by rounded markings) by posting lows in range of 300 in Jan 2016 and April 2020. Intervening peak between two bottoms is 705 posted in August 2017. If and when stock price crosses and sustains above 705, double bottom pattern gets confirmed and target could be in range of 1100. Though since the pattern has taken 4 years to form, if pattern is successful, achievement of targets could also take time.
Broken out of a medium term down trending channel and managing to stay about it.
With good financials, and good management commentary, and stock hitting 1 year and 2 year highs and showing good consolidation, Kaveri seems an interesting bet.
disc: Invested looking at good techno funda combination.
Thanks @hitesh2710 sir for detailing pros and cons on Kaveri seeds. This stock appeared in my filter also for its positive q1 results. One of the observation I had around this stock that it makes high of the year in Jul-Aug month timeline since 2015. Same is the case with max EPS in Q1 quarter for last 3 years. It could be due to cyclic nature of business. Will appreciate your thought on this observation.
No strategy is perfect and it won’t work all the time.
The 52 wk high and all time high strategy generally works in a trending market. In case of trend reversal / corrections we must have stop losses to protect ourselves.
Also some sense of macro conditions is important to develop the sense that the market is overheating. Advance/ decline ratio, Ratio to 52 wk highs to 52 wk lows, index chart patterns. If we have 25 stocks in your portfolio and say 5-6 of them hit stop losses in quick succession , that is if we are having a losing streak , that itself is an indication that the strategy is not working, at least for time being and we can scale down our trading, reduce portfolio exposure for risk management.
Also, a stock forms a primary base over several months, sometimes years and breaks out and then forms several small (secondary) bases along the rally where it consolidates and breaks out again. When buying we have to see how extended the stock is , how far is it from its primary base. If it has already formed 4-5 small bases then it is more riskier.
Hey @aks83 . I can answer that if that’s ok(apologies if not). Kaveri has always been Q1 heavy due to the nature of their business ie field crops. Infact it’s other quarters have even led to losses. This was the first time that the other quarters started carrying their weight and posted profits due to their vegetable crops which are perennially grown. I had forgotten about Kaveri. Thanks to Hitesh sirs post I began looking at it again for the long term. It’s honestly the perfect marriage of technicals and fundamentals and I would never have noticed this on my own.
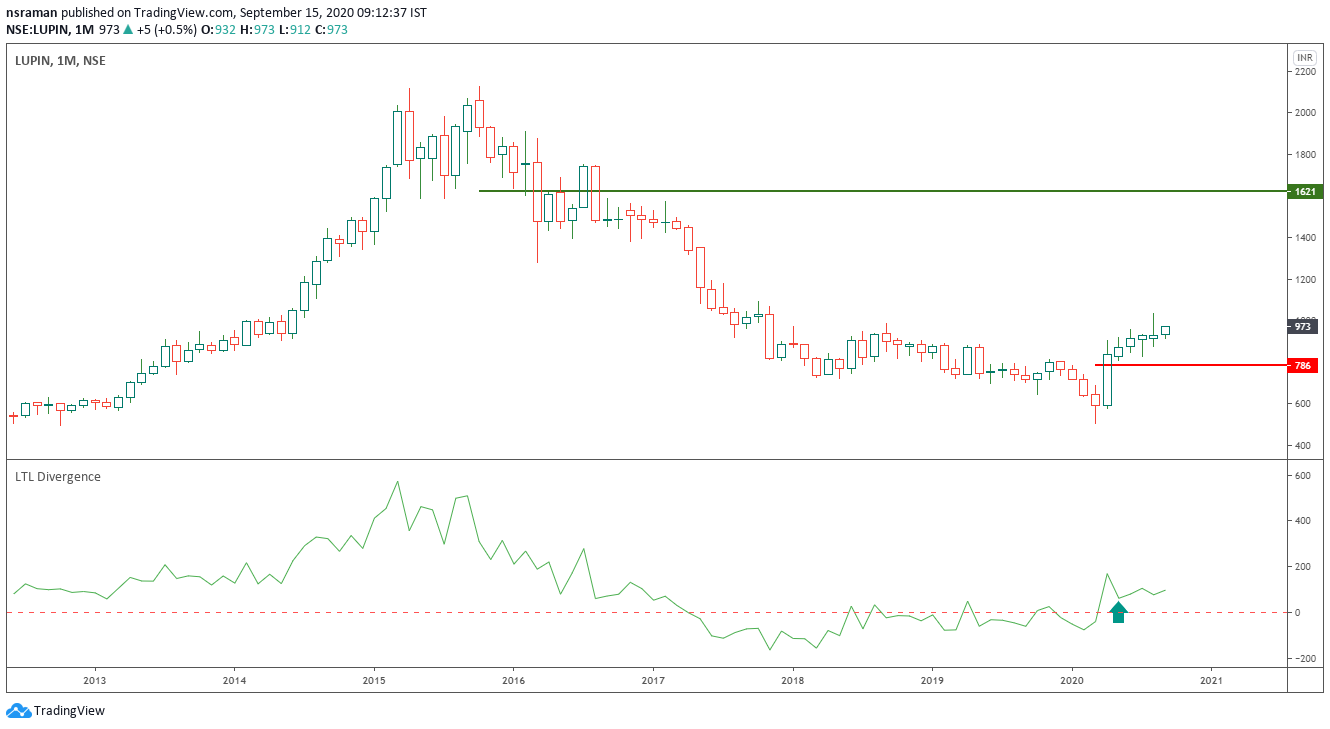
My next pick under this category is Lupin. It is slower and it may touch the green line by Apr 2021. Also keep the red line at the back of the mind for support. Will exit if support is lost at this line.