
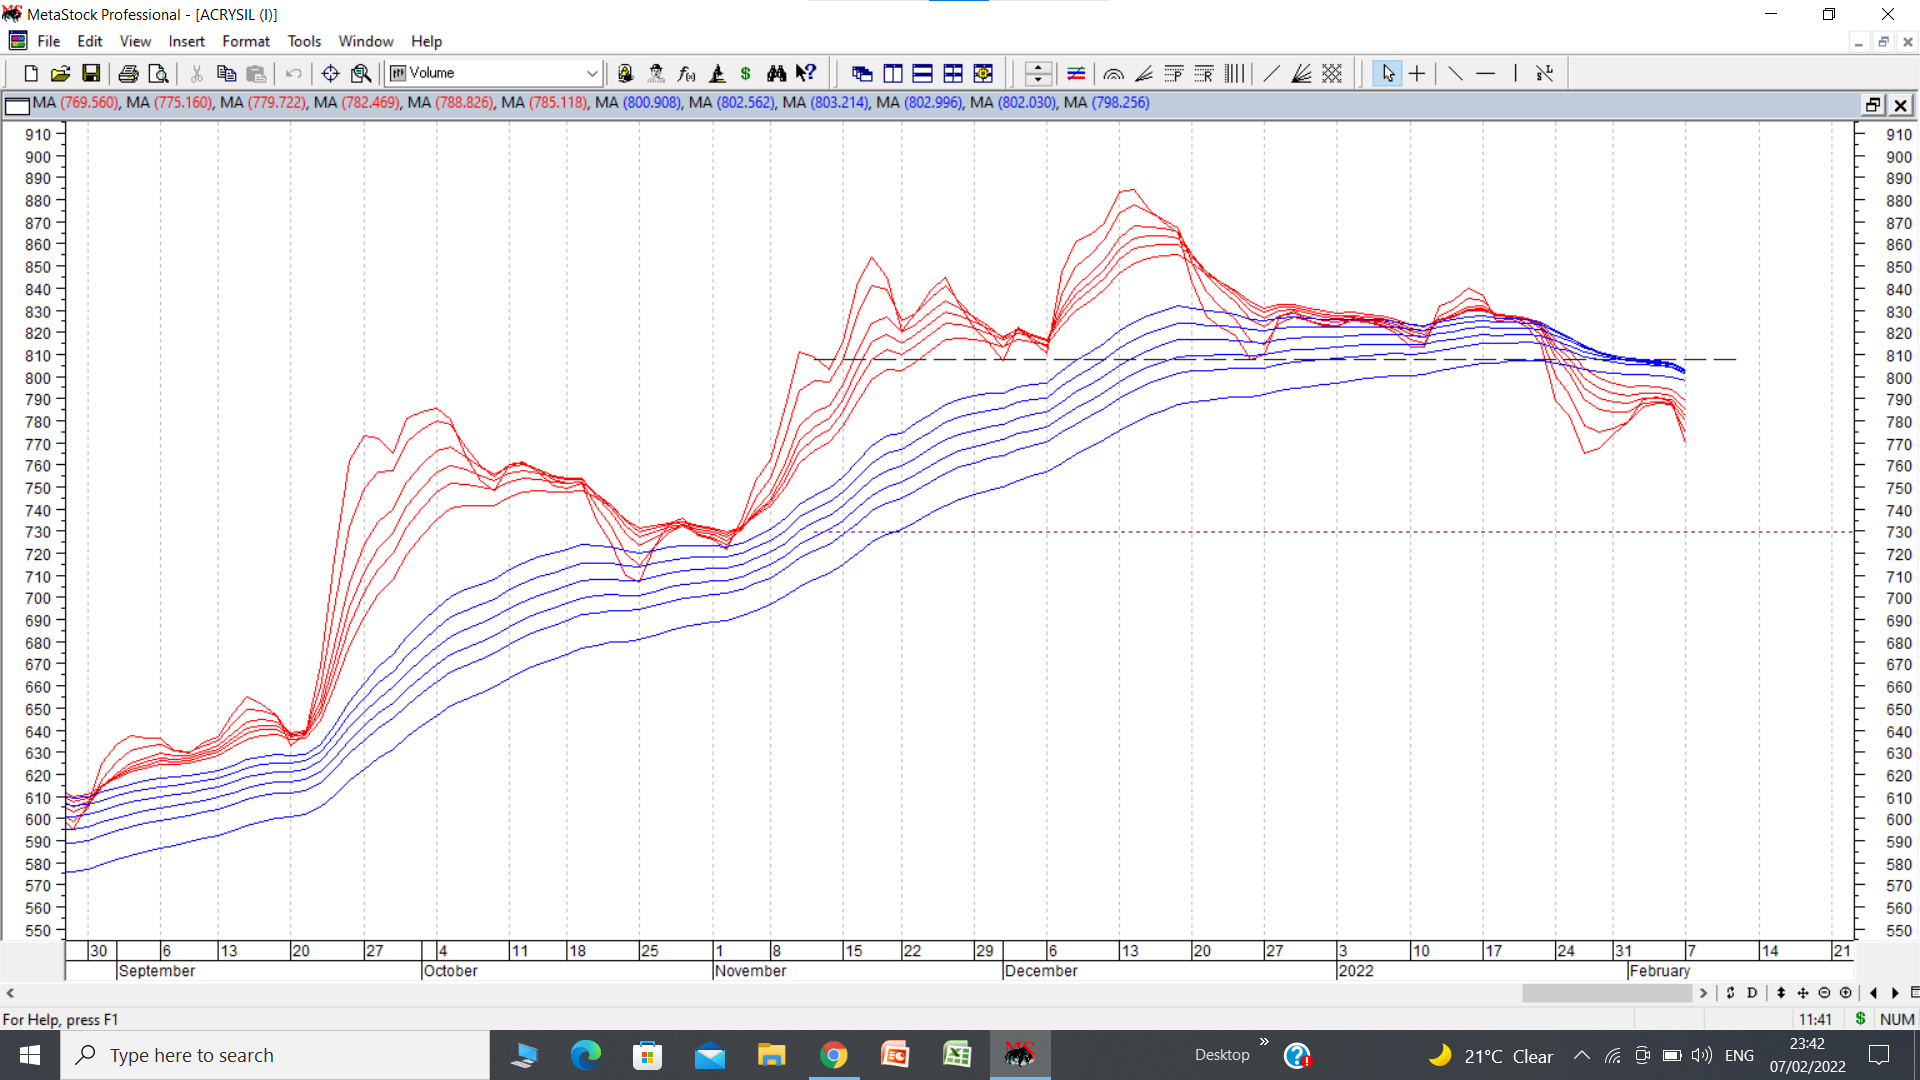
Acrysil has been well followed in its fundamental thread. Stock seems to have corrected inspite of optically good results. Its chart shows a small head and shoulders breakdown with potential target of 730 on GMMA chart. And 700 in line chart. Dotted horizontal line in black shows breakdown of neckline of head and shoulders. Dotted purple line indicates a target zone.
15 Likes