52 week highs and all time highs strategy

HFCL is a name that most investors who have been in the markets long enough (since 2000) hate. Stock price had a massive fall from highs of 2150 to penny stock levels. And every bull run when it started rallying, my gut instinct was to start smelling a rat. :grinning: However this time after a hiatus of almost 19 years, stock price managed to cross intervening peak of 62.9 and has managed to stay above that level and has shown very good volume activity while crossing the level. It hit a high of 95 after crossing 63 and then came down and retested breakout level of 63 by going down to 55 and promptly bounced back and has managed to establish strong support in range of 68-70. Currently its around 80 and can be an interesting stock to watch. Attached chart shows the price action and volumes (in dotted blue vertical lines). Cannot bring myself to buy it though. :grin:

16 Likes

Dollar ind - taken out all time high on weekly, fundamentals good with attractive valuations in peer groups, unorganized to organized theme delivering sector tailwinds, winter winterware should do well this time given strong winter season, more details on fundamentals in stock thread.

3 Likes

Cosmo Films stock price staged a strong rally after crossing 470 (previous major all time high ) after a lot of consolidation below and around that level. Stock price went up to 1679 in nearly 8 months from 470 and then underwent consolidation. In the process if posted a double top of 1679. Subsequently some hints of beginnings of upmove were provided by breakout from triangular consolidation (marked in chart) and breakout from cup and handle (marked on chart, breakout line in dotted line). In last couple of days it crossed the double top of 1679 and posted a fresh swing high of 1786 has now corrected to levels of 1652 today. Fundamentally the spreads in polyfilms are ruling very strongly and demand scenario remains strong. No positions in cosmo but keep holding polyplex and jindal poly. Cosmo remains in watchlist. Idea should be to watch for some kind of tight consolidation in cosmo and then a big volume breakout. Stock price had gone up from 1300 to 1786 in a matter of only a few trading sessions and hence some kind of cooling off is expected, post which a call can be taken.

10 Likes

Shalimar Paints chart is showing an interesting chart pattern. After posting all time high of 320 in May 2017, stock price went into a corrective downtrend and posted low of 42 in March 2020. Since then it has moved up to current level of 135, in the process crossing two important previous tops of 111 and 126. The whole pattern has taken the form of an early phase of rounding bottom. (this chart reminds me of the chart of pricol when the price of pricol was 65. Since then pricol has more than doubled in less than a year) Volume action post crossing swing high of 126 has been strong. And above 126, stock price crossed its 3 year highs. Today an announcement came regarding investment participation of Infra.market by infusing 270 crores by parent of infra.market (Hella infra market pvt ltd) in the form of equity and debenture into shalimar paints. Rationale of this fund infusion has been given as improvement in balance sheet and improvement in product range. Need to see how things pan out going ahead. (disc: starter position)

13 Likes

@hitesh2710 Hello Sir, can you please update your views on Union Bank. I see VCP coming into play with divergence in RSI

Do you think this is a low cheat area to enter ?

1 Like

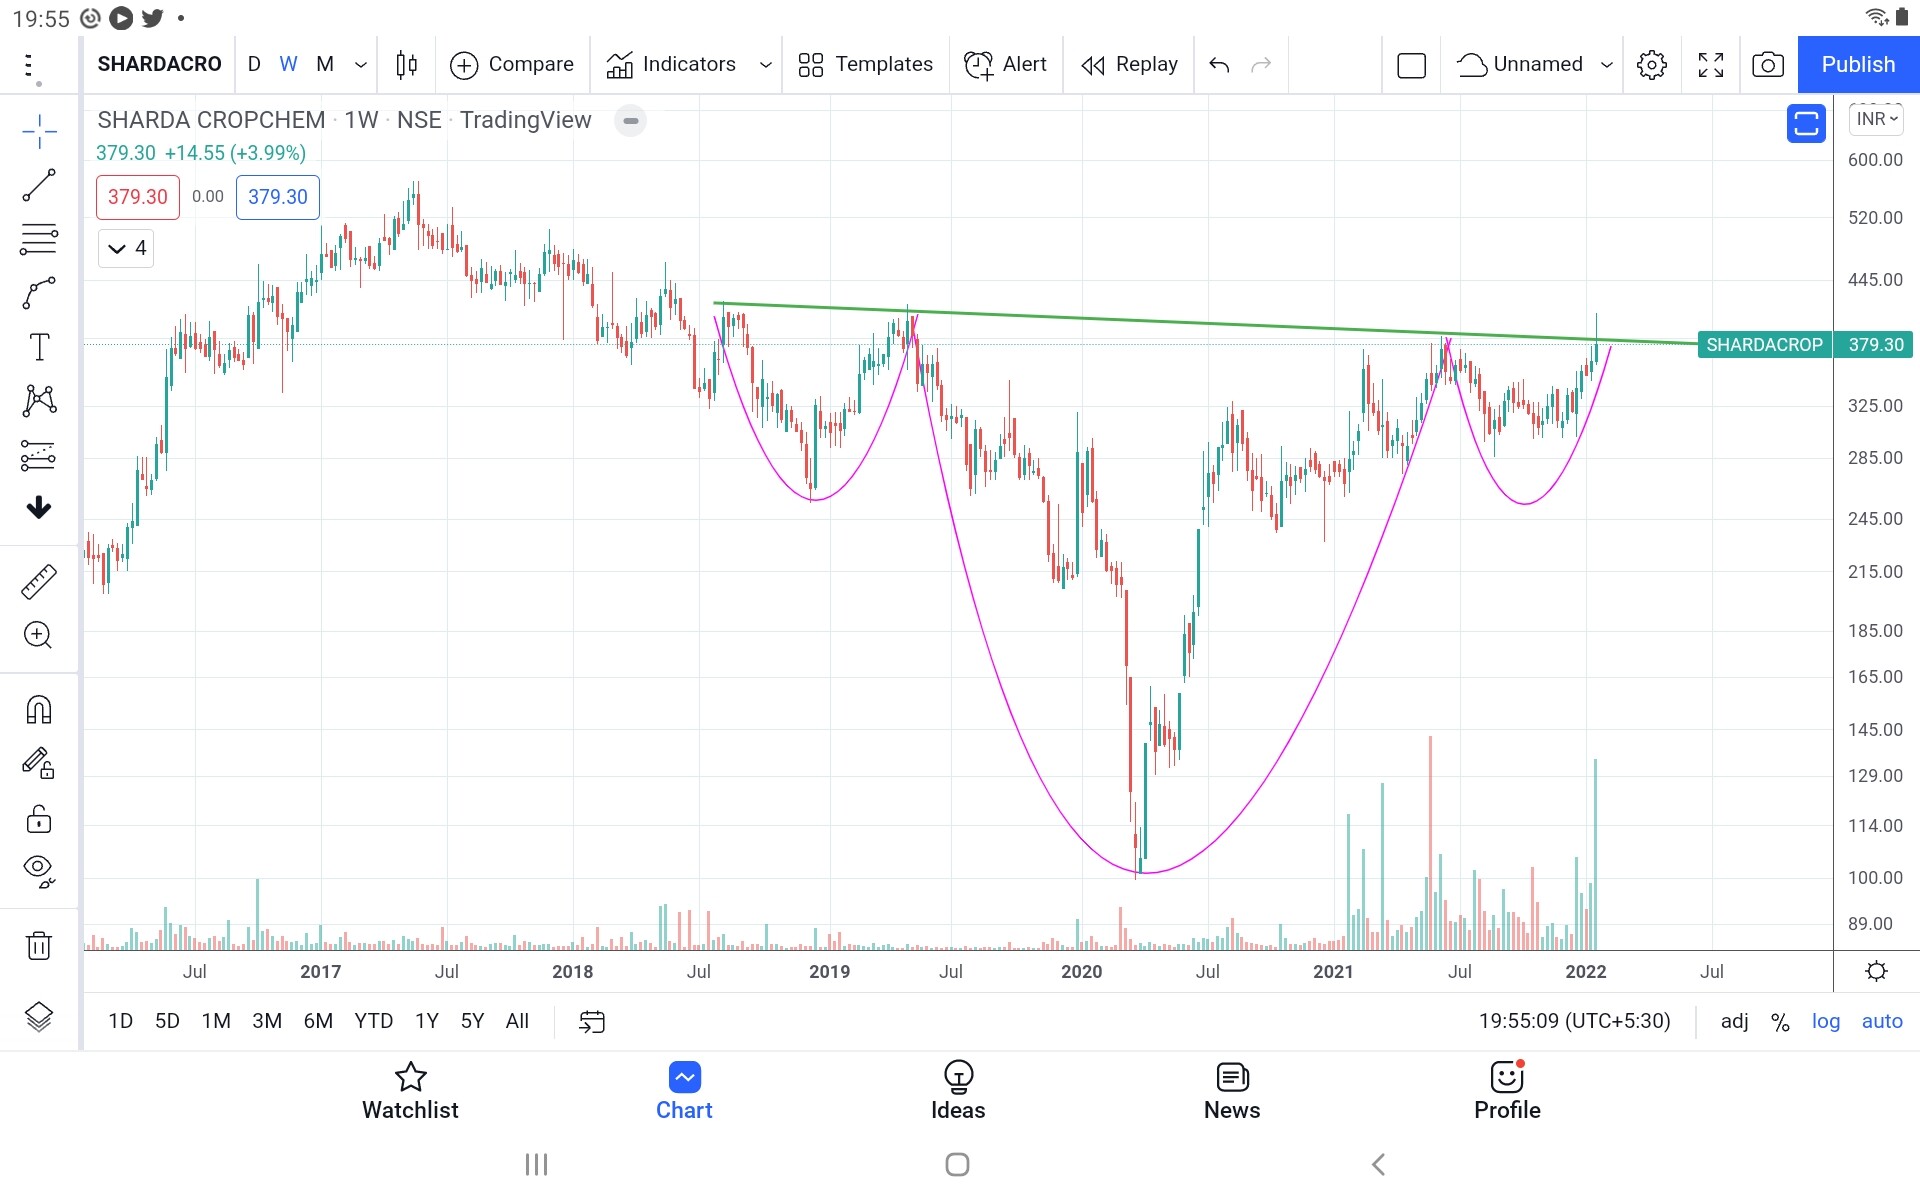
Sharda cropchem - 52 week high break out point, longer term also looking strong, significant upside if IH&S play out

9 Likes

Been tracking Kuantum papers and can see an ascending pattern play, and it has been rather a long duration triangle spanning over 4 months. Tracking and waiting for the stock to cross its 52WH.
Kuantum is also part of a cyclical paper industry with its current price less than its book value. The company has also recovered from the lows of covid. @hitesh2710 sir do you think it is a good entry point in this sector?

1 Like

Neuland q3 results have been a disappointing affair. The chart has been indicating a major trend reversal ever since it broke down from a head and shoulders pattern, which ranged from 2700 to 1900, a distance of 800 rs. Subtracting that from breakdown level provides target of 1100. cmp around 1394. Another bearish pattern I had drawn sometime back on the chart was a bearish upward pointing flag. (One has to visualise a bullish flag and invert it to get bearish implications. ) dotted horizontal line is target line of 1100 for bearish head and shoulders pattern. Now two solid horizontal blue lines drawn on chart show area of strong consolidation before the strong rally took place. That is an area to look out for support and it extends from 1000 to 1300. disc: no positions, but was academically very interesting to follow as it had clear cut bearish chart.

24 Likes

Reliance the index heavyweight presents an interesting chart. I have put up weekly line chart, so that the daily and weekly whipsaws are eliminated and we get a clearer picture of the pattern. As shown in the chart, RIL rally began in March 2020 from Covid first wave lows of 1018 (weekly closing) and stock went up sharply to touch a high of 2320 (again weekly closing) in Sep 2020, in the process doubling in nearly six months. For an index heavyweight this is a pretty big rally. And as inevitably happens after sharp run ups, it went into a (flag shaped here) consolidation (dotted lines) that lasted from Sep 2020 to May 2021, a matter of 8 months. It broke out from that flag like consolidation and posted a high of 2225, and then went down to retest the upper channel of flag. This too was a laborious move and after that stock price went up in another strong rally from 2035 levels in July 2021 to a high of 2700 in Oct 2021, nearly 35% up in 4 months. Since then it has cooled off, and has been taking support at 200 dema and has posted weekly double bottom at 2335-2340 levels (dotted lines). It is taking support at the zone of previous top of 2300. A confirmation of this double bottom breakout happens on weekly closing above 2540. This could add another 200 rs upmove according to double bottom breakout and stock price again will attempt previous swing highs in zone of 2700.

Now coming to the first rally from 1018 to 2319, its a rally of nearly 1200 rs and post that there was a flag pattern formation and breakout. Adding this 1200 to breakout zone of 2100, provides a target of 3300 for the stock over medium term. Since this is a weekly chart, pattern targets can be achieved in many weeks.

Good thing about the chart of Reliance is that after each and every sharp move there is a boring slow consolidation where it nearly moves out of investor focus except for the really long term guys.

What interests me here is the buying equation for the medium term. cmp around 2380. stop loss is below 2240, slightly below swing low of 2247. And target can be 3300 or thereabouts. If and when it clears 2540 and gives a weekly close above it, position can be increased.

This is just a hypothesis looking at the chart because chart pattern is very clear where one can clearly see the uptrend and consolidations. There has never been any strong correction suggestive of breach of medium to long term uptrend.

This is a chart posted only for academic purpose and not a recommendation. As of now I do not have any position, but is on my watchlist.

21 Likes

@IamAnshul

The channel you have drawn is a sort of consolidation within an uptrending range. It looks more like a forcibly drawn channel. But overall structure of kuantum is good. Its trading close to its ATH and has not corrected much during recent market meltdown too. So overall on charts it seems a strong structure. Fundamentally I dont track it.

1 Like

Jindal poly is the biggest polyfilm company in India. Polyfilms both BOPP and BOPET are experiencing strong tailwinds due to a variety of reasons.

Negaives first. Management not very investor friendly. (unlike polyplex guys who dole out dividends by tens and hundreds. ) Sector itself is cyclical and one has to be mindful of that.

Positive. Strong sectoral tailwinds. Looking at numbers reported by other polyfilm players, q3 results expected to be very strong. TTM EPS at 205, valuations very cheap. (however these cyclical types will often trade at cheap levels even when at all time highs)

Stock price was in a broad range of 950 to 1150 since July 2021, nearly six months now (barring a few trading sessions above and below the zone, which seems ignorable). Today it went up with good volumes and hit a fresh all time high of 1245, crossing earlier ATH of 1238 marginally.

I have marked zones of consolidation in dotted lines. The most comforting factor is the heavy consolidation within the range of 950-1150. Breakouts post these kinds of consolidations usually happen with good strength.

I think I had posted the chart of Jindal poly earlier also. disc; invested as a techno funda bet.

9 Likes

Polyplex is a strong global player especially in the BOPET segment.

Negative: cyclical sector.
Positive : Very investor friendly management. They have been doling out dividends almost every quarter. Good balance sheet in spite of regular expansions.

On the charts, stock price has broadly been under sideways consolidation taking the form of rectangular and then triangular consolidation. An attempt was made in Dec 2021 to breakout from rectangular consolidation but failed and stock fell to retest its strong support zone near 1700 and then bounced back. Today it crossed 1900 with good volumes and in the process seems to have given conclusive breakout from triangular pattern. Next level to watch is previous swing high of 2110 posted in Dec 2021. disc: invested.

10 Likes

Orient bell, monthly, All time high breakout after some consolidation, strong commentary from mgmt in concall, a micro cap against established players like Kajaria, Cera etc.
Real estate upcycle a good tailwind, Capex ongoing as capacities near full. Good proxy play to RE, size in favor for growth runway. More details in fundamentals thread. Good mgmt pedigree and brand focus.

13 Likes

Acrysil has been well followed in its fundamental thread. Stock seems to have corrected inspite of optically good results. Its chart shows a small head and shoulders breakdown with potential target of 730 on GMMA chart. And 700 in line chart. Dotted horizontal line in black shows breakdown of neckline of head and shoulders. Dotted purple line indicates a target zone.

15 Likes

~ Hero Moto Corp looks good with near term triggers

Disc : 10% of PF in Techno Funda Bet

1 Like

Interesting Development on the Neuland Weekly Chart.
~Potential Pin Bar Candle information along with dried up selling volume ( waiting for the closing candle )
~TF > 1 year

*Please share your views sir

2 Likes


Hindustan Construction Company (HCC) :

Broke out of resistance at around 18 closing at 52 week and 3year High with high volumes. Company’s debt is getting restructured and is generating a profit now. Company is set to benefit from the government’s massive infra spending . Company is known to have completed difficult construction projects like
Bandra-Worli Sea Link -Mumbai,Bogibeel Bridge-Assam etc and has built plants that account for more than 60% of India’s Nuclear Power Capacity . It has a healthy order book but it has not increased in Q3 '21 . Company also recently divested Baharampore-Farakka Highways Ltd (BFHL) at an enterprise value of Rs 1,279 crore . This sale will add further liquidity to the company . Overall looks like a cheap bet in the infra space .

Disc: Invested , This is not recommendation to buy or sell do your own research before investing.

3 Likes

Acrysil chart had been put up earlier to indicate a small head and shoulders pattern breakdown. On line chart, the target was 700 and on GMMA chart indicated target was 728. Here I am putting a candlestick chart to update the chart. The interesting thing here is that the stock price went down and tested the 200 day moving average at 676 (marked in solid green line) and formed a hammer on 15 Feb 2022. Since then it has tried to take support near about the 700 zone.

Dotted lines marked in blue and green show a confluence of two important parameters. Blue dotted line at 695 shows level of previous major top in August 2021. Dotted green line at same level shows a 38.2% retracement level to the previous major rally from 309 in May 2021 to an all time high of 927 in Dec 2021. At the low of 676 the stock corrected nearly 27% from its peak of 927.

The concall for q3 fy 22 sounded encouraging and company is likely to commission expanded capacities soon. If support at the zone of 680-700 holds, this could be an interesting entry point for medium to long term investors. disc: invested a starter position recently.

15 Likes

Update on Reliance chart posted earlier.

Stock price took support at around its 200 dema level close to 2310 in recent market correction. It recently gave a small double bottom breakout confirmation by breaking out above 2420.

On 25 Jan 2022, it had posted a low of 2305, went up to post a high of 2420 on 14 1 Feb 2022, and again went down and posted a low at 2305 on 7 feb 2022. This was a double bottom with an intervening peak at 2420. Today it closed at 2443, conclusively above 2420. Now immediate target can be 2535.

On a slighter longer time frame, stock price had taken support in 200 dema zone in Dec 21, (actual low of 2276) and had posted a swing high of 2567. Again recent low was 2305, quite close by to be called a double bottom. Here intervening peak is 2567 and if that is breached, potential target could be 2800 plus.

So we have two double bottom patterns on charts, with bottoms in both instances at around 2300, and tops at 2420 and 2567 and the successful breakout targets can be calculated accordingly. One might even notice that there was a triple bottom at around 2300 zone.

16 Likes


thanking Hitesh bhai and every one for this wonderfull thread. I am also trying to learn this break out trade…
rajesh export is giving break near its all time high after consolidating for many years now…can we see this as a kind of cup patterm? volume jump is also there…
company wants to increase jewelery stores to 3500 in next 10 years… thoughts ?

2 Likes