Awesome. It used to be a painstaking job before. Many thanks.
A suggestion, Tijori still shows the old names of the scripts. Can you make sure that it gets updated automatically?
e.g. Garware Wall Ropes (renamed as Garware Technical Fibres), Bajaj Corp. (renamed as Bajaj Consumer Care) etc.
One more request. If you can add promoter related party transactions. I believe it is Balance sheet item & even small to small companies disclosing these info.
One more point we had earlier discussed ie Promoter Salaries (What is available at this moment is Employee cost)
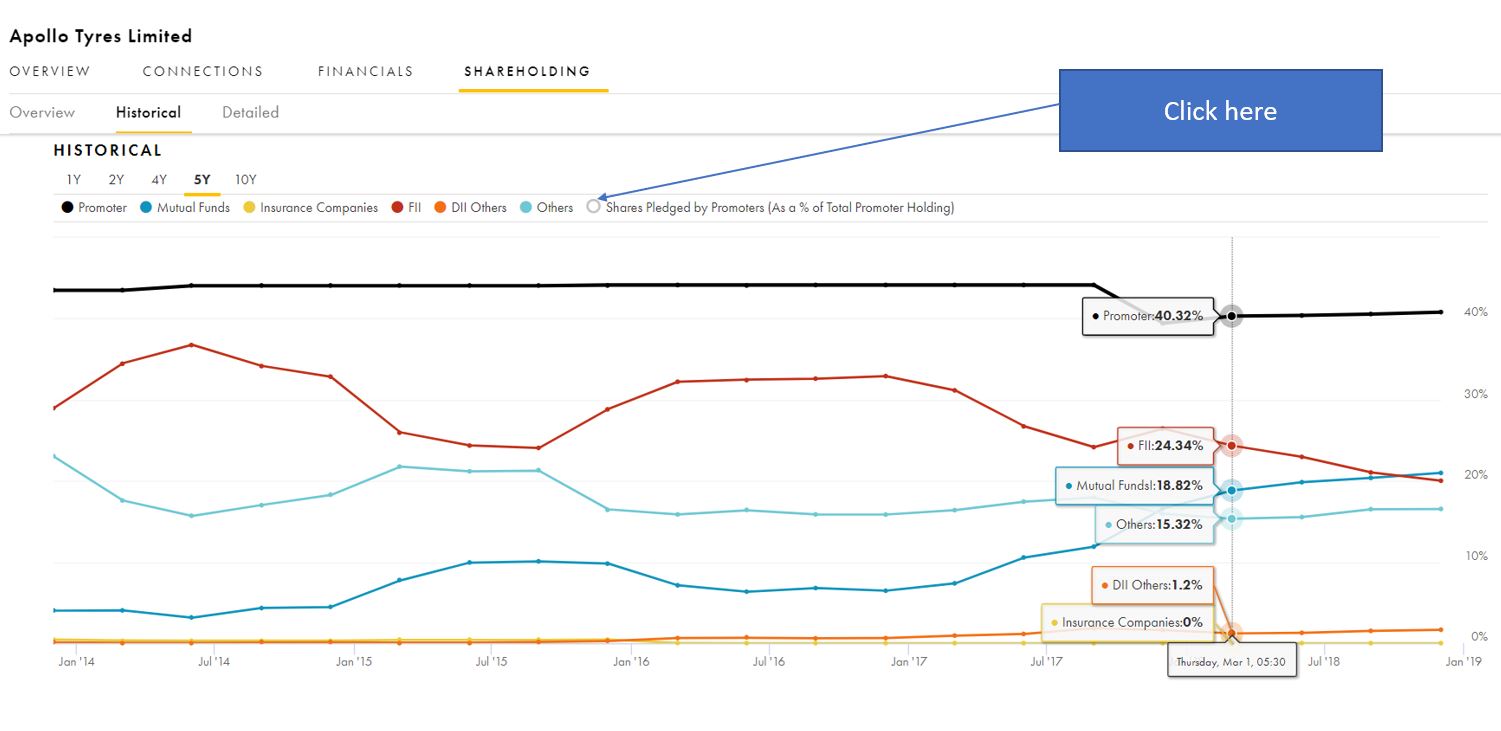
Thanks Sujay, soon we’re going to be rolling out detailed alerts which you can configure based on your preferences. Eg: Flag cases where a company you’re tracking increases or decreases its pledged shares - hope you would find something like this useful.
Also noted your point on outdated company names, will look to automate that process.
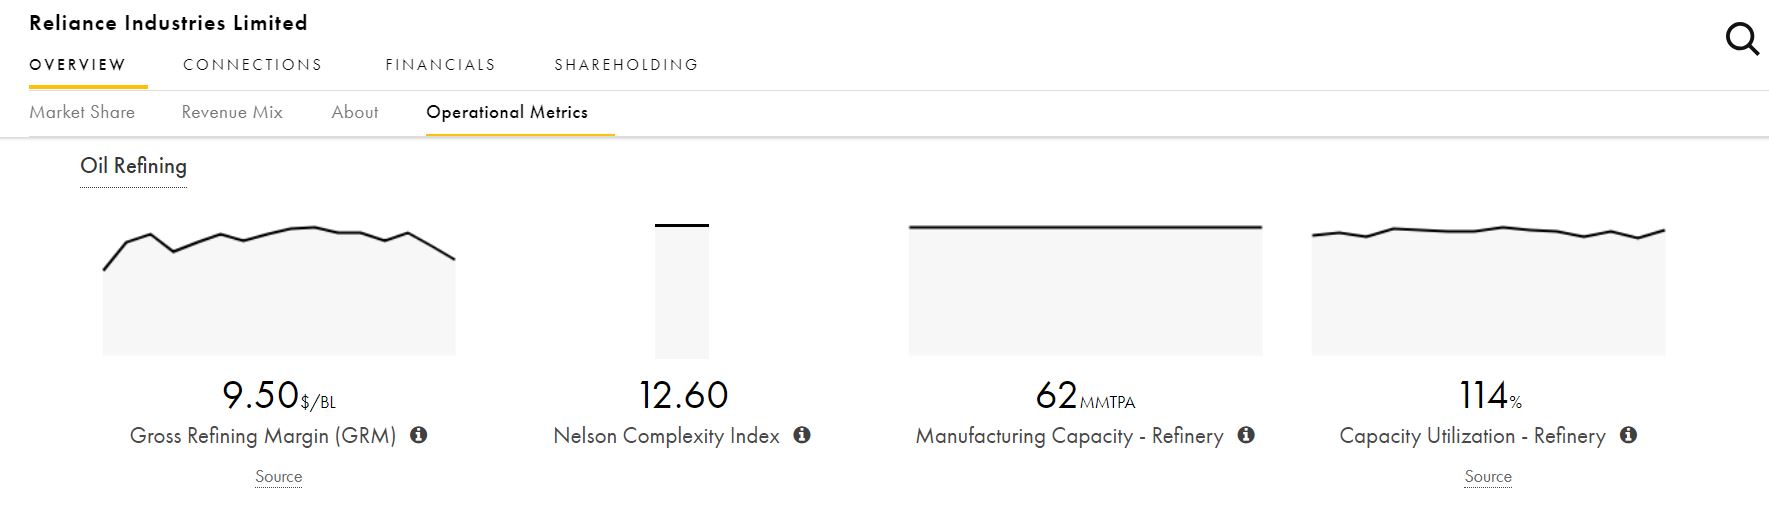
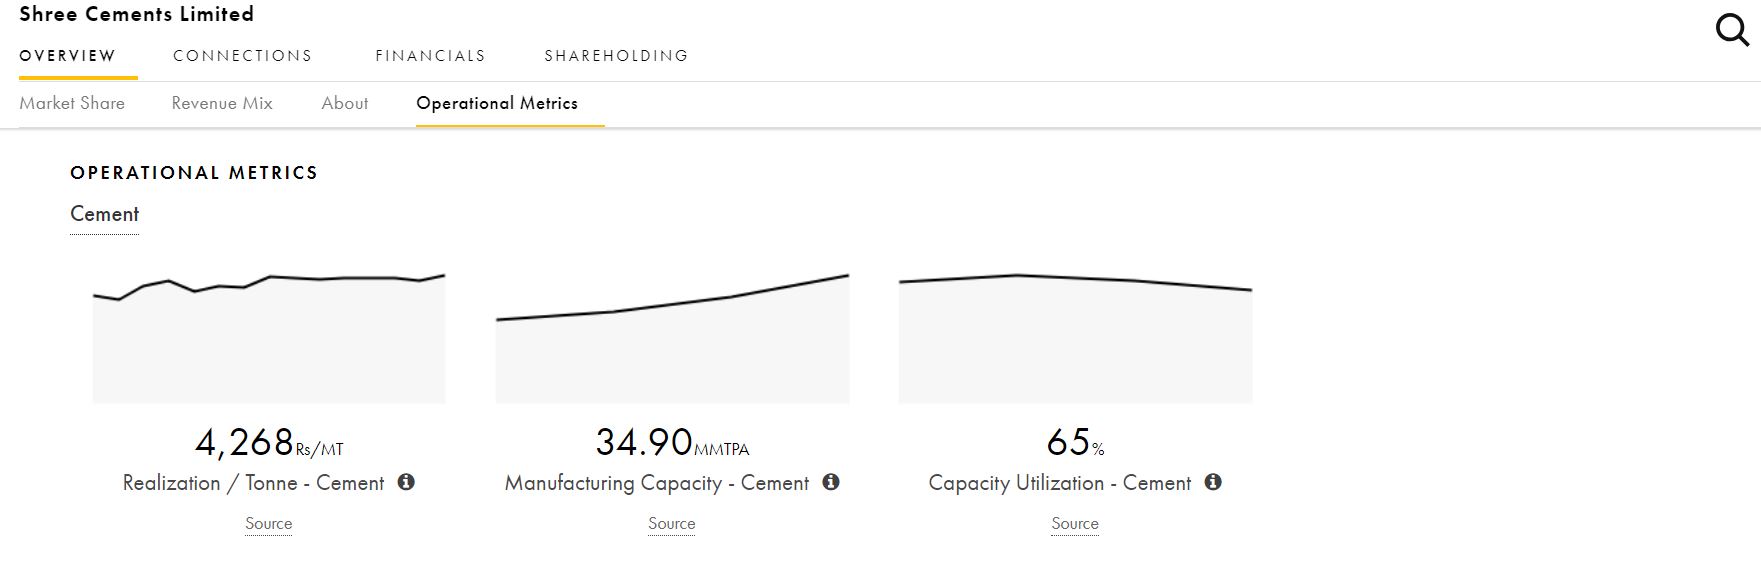
Do you have Capacity Utilization info in any of Matrix? Where one can see Whether company has further capacity to boost sales or it is already extinguished?
@Sidhegde
It seems that Dividend yield or Payout ratio is not included in the financials. Please include it under P/L for all the years and also under Financial Metrics under Benchmarking.
Also, the following Financial Metrics would be helpful if included under Benchmarking: 5 Years Sales growth, Price to Book, Enterprise Value to EBIT, Price to Sales & Price to Cash Flow.
@sujay85 - We are working on allowing you to customize your screens, and add any custom ratio that you like. This is taking us a bit of time though, will keep you posted.
@Salman_kn99 - Yes, we have capacity utilization for very few companies currently, but in a couple of days we would be releasing historic metrics across all companies. You should be able to find what your looking for then: ) will keep you posted.
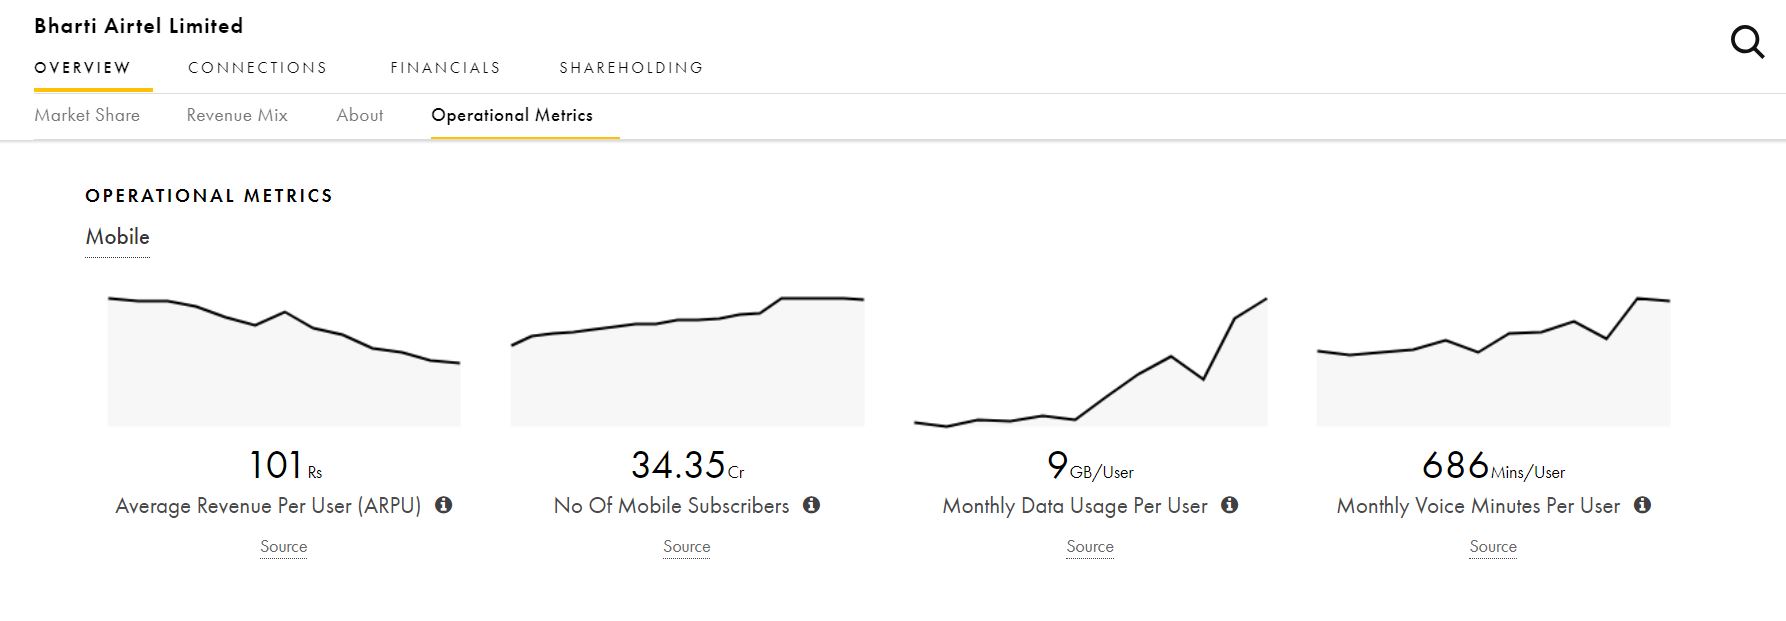
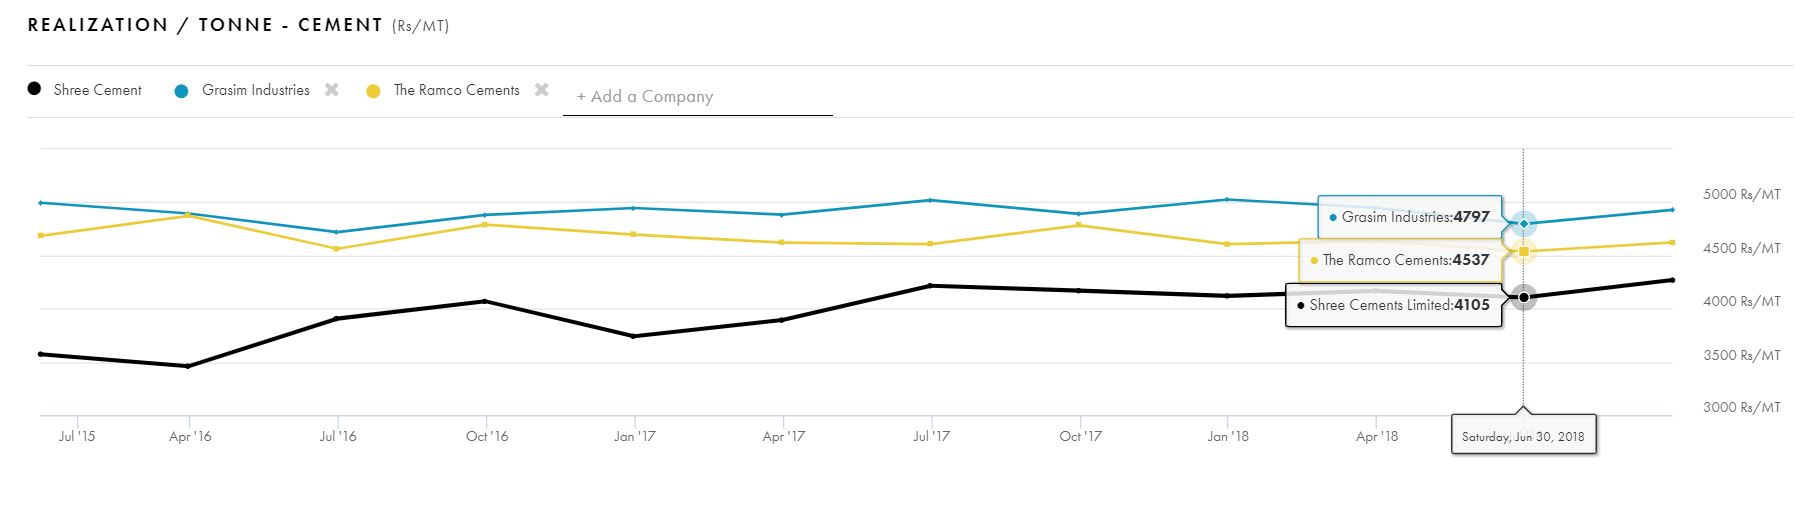
New Feature Update - Historic Operational Metrics:
Now you can view and analyze the core operational metrics of a company historically and compare them against the performance of its closest competitors:
We have tried to extract the most critical company specific metrics across as many companies as possible. The cycle of updating these metrics vary from company to company and is based on the data source we were able to get our hands on. Most the metrics are updated either monthly or quarterly.
We have tried to automate the process as much as possible, however there is still some manual work which we do - so if you do spot any errors or have any queries please flag them and we will try and resolve it as soon as possible.
We have now updated the website with the operational metrics of companies till Feb 2019. Going forward we will be continuously updating Tijori as and when data is released by the companies & industry bodies.
Currently some of the data sources we are updating Tijori with include:
Auto Sales Figures, IRDA Data, RBI Data, AMFI Data, TRAI Data, DGCA Data, Pharma sales figures etc.
Our thinking is to provide investors with insights as to what moves the company’s sales. Hope this helps!
Accurate bench-marking is obviously critical, which is why we thought we’ll make niche sector specific indices. This is possible since we have mapped the exact revenue composition of companies at a very granular level.
So to give you an example you would now be able to compare Apollo Tyre against a Tyre Index as opposed to an Auto Ancillary Index.
You can click on the link below to get a quick overview of our methodology & the Universe of Indices we have created - will upload detailed index specific documentation soon.
In order to provide a deeper analysis of the cash flow statement we felt it is critical for investors to also look at the free cash flow positions of a company.
So now on Tijori we have added a new line item ‘Free Cash Flow (est)’ which has been derived using the following formula:
It’d be great if you could include increase/decrease in Working Capital with the FCFF calculation too.
Change in Working Capital = (Non-cash Current Assets in year ‘T’ - Non-debt Current Liabilities in year ‘T’) - (Non-cash Current Assets in year ‘T-1’ - Non-debt Current Liabilities in year ‘T-1’)
A positive value should be reduced and a negative value added to FCFF (Before Working Capital Changes).