
Good perspective
1 Like
Fast moves in lesser number of days, either form peaks or forebodes continuation.
The days to comes could be decisive.
From what I have read and experienced, it is ‘normal’ for a stock/index to lose 30% to 60% of its last rally.
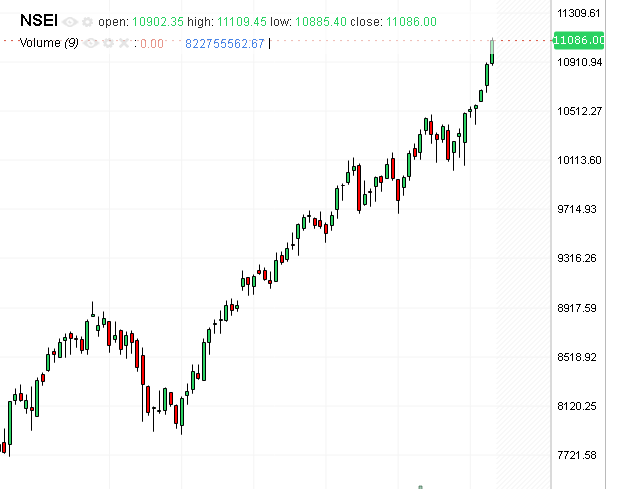
In case of NIFTY this rally was from 10440 to 11080 which is a 640 point gain.
People should not be surprised if there is a correction of around 200 to 400 points from the current level. i.e. NIFTY falling to 10700.
These types of retracements can be considered normal.
1 Like
Just curious to know at what point would you be a buyer? You seem to be most bearish here and bearish from below 10,000 AFAIR. Now if Nifty goes to 12,000 and does correct 20% then I guess you won’t be buying because Nifty would still reach around 10,000 only.
Level of Nifty is not as important as the valuations.
For ex: If Nifty is at 12000, when Nifty PE is 17, I will find myself in business.
2 Likes
Yes. Valuations are more important than absolute NIFTY levels.
On a practical level what happens is this: Most people are waiting for NIFTY to fall to 17-18 PE levels to buy. Some have less patience than others. So during the PE correction strong buying might kick-in much before NIFTY hits a PE of 17.
And if the NIFTY does hit PE of 17 during a downward slide because of a larger economic slowdown then even PE of 17 might be expensive to enter (considering the expected future earnings downgrades).
So while it is important to keep NIFTY PE levels in mind, it becomes important to have flexibility on the PE entry levels depending on whether we are expecting future earning upgrades or downgrades.
3 Likes
I wonder how much Nifty levels matter if one is buying individual stocks and not index/index based instruments. I would look at the stock specific valuations rather than index level.
For example In last 2-3 weeks a lot of fluctuation/correction have began in many non-index mid/small cap scrips and some of them are becoming reasonably valued after they are corrected 20-30% from their current levels but index have actually gone up/stayed at the same level.
What I have observed in this time which I haven’t seen before (with my limited experience of only one bull-bear market of 2007-08) is that there have been frequent adjustment in some areas rather than sharp decline across in all stocks. Though this behavior is only visible in some areas and the adjustment of price/value is slow and delayed, this is a good sign as the corrections are happening in small chunks and more frequent rather than sharp movement across the wide range causing a crash (and bad sign for people waiting for wider level crash).
I deserve the right to be corrected but such smaller correction cycles may eventually cover major parts without a big correction and bring the over all maket at reasonable value.
I believe finding such areas where correction has happened one may uncover reasonable value buys irrespective of the index level. Though as the overall market remains overvalued, returns may still be capped/fluctuating but would be visible in the long term.
3 Likes
I think, the funds are being moved from small/mid cap to large caps. One can evidently see that largecaps outperforming the small/mid cap indexes. ICICI Pru AMC went ahead and shuts its 2 of their small cap funds.
I make a conscious effort to rely on concrete data to make investment decisions. I have chosen to rely on a bell curve derived from 4400 data points…
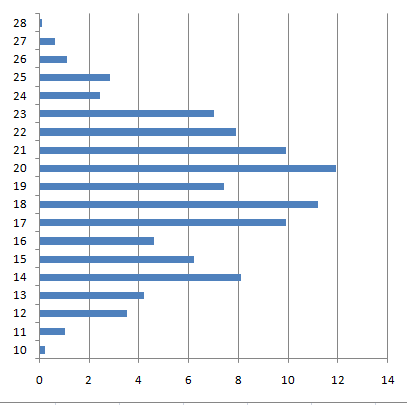
It shows that:
- Nifty has been in the area below PE 17, 37.70% of all trading days
- And below PE 20, 68.20% of all trading days
Therefore, I believe that reasonable valuations will come, it is only a matter of time.
Sure, at that time Nifty could recede further. It tends to do that.
Historical charts show that each time Nifty has scaled crazy heights of PE > 27, in the subsequent bear crawl it has gone to crazy lows of PE < 15 as well. I do not know the logic.
The above choice of method of investment will make sense to people who have this non-negotiable criteria that the investments should be in the green in the long term, i.e. 3+ years.
Statistics show that investing in the Index scrips at PE > 20 subscribes you for exactly the opposite. Meaning, the investments will bleed in 3+ years, but they will be in the green in the short term (However, in the very long term, 10+ years, they will stabilize) Such has been the trend in the last twenty years.
7 Likes
Your comment was an opportunity to reflect.
I heart of hearts, I do not see the current market as bearish. Because it clearly isn’t. Its going up. If I were to buy a Call or a Put, I would purchase far-month Calls.
But, due to high valuations it feels counter-intuitive to freshly invest now, or remain invested. Because all logic dictates that within 3 years, from these levels, the returns are going to be fiercely negative to zero. In fact, Gold ETFs and FDs are a better avenue.
1 Like
I think one needs to make a difference between fresh investments and ramaining invested. I haven’t invested anything in last one year myself and today I am at 20% cash but I see no reason to sell out the other 80% and go all cash. Not yet.
By no means do I support the idea of making sudden changes in ones portfolio. However, what I do say is that now are times to take out investments in a systematic way. SIP in and SIP out.
What better time will one find to take profit out, and prepare a crash fund?
The Bell Curve says that in last twenty years, Nifty remained in PE > 27 area ONLY 0.70% of the times of all trading days !!
The odds are now very high, that whatever you sell now, in the short term you could get it back at a lower price.
However, for small / mid cap or a special case individual company this Bell Curve may not apply.
2 Likes
As I said earlier also, if you multiply every data point in a normal distribution with a constant, you will still get a bell curve. What if PE range has shifted by say 5 points because of secular changes - India becoming a mid cap economy from small cap economy 20 year back, Indian households discovering equity as an asset class, record low interest rates all over the world etc?
As for timing, we can get a 15-20% correction any time but you cannot prepare for a 15-20% correction using SIP out or SIP in. By the time you have completely sold, it will be time to buy again.
1 Like
Another question we need to ask ourselves.
Let us assume that we own Nifty stocks as wells as small&midcap stocks.
I would be more worried about small&midcap PE which is > 60 rather than Nifty PE. No one seems to be talking about these valuations.
Also, should we be making investment decisions based on Nifty level. IT companies were available at mouth watering valuations few months back, so was pharma pack despite so called bubble zone for Nifty PE.
4 Likes
Small cap P/E is distorted because several companies in this space are loss making.
P/BV is a better metric to value small caps. P/BV of Nifty Small cap 250 index is 2.56 compared to 3.74 for Nifty.
2 Likes
a) We are discussing the PE range of Nifty 50, so there is no reason to mull over Mid or Small cap Indices.
b) Raising the Nifty PE range or the median/mode by 5 points is a tall order for the heaviest Index of the nation for the following reasons:-
Top 10 holdings of Nifty 50 make up for 55% of the index weightage. These companies are as follows,
HDFCBANK
RELIANCE
HDFC
ITC
INFY
ICICIBANK
LT
TCS
KOTAKBANK
MARUTI
None of these companies or their industries have had a major change in their market dynamics that their individual PE ranges should be considered to be permanently expanded. Infact, IT (and pharma) sector is going through a phase of PE contraction.
These top 10 members have not been replaced since their inclusion. Minimum shuffling has happened in other 45% of weightage, but nothing which would affect the PE range of the entire index.
Yes, retail investors are all charged-up lately, but they are a sentimental lot. Just like in 2007, given the right trigger, you will find them running over each other on their way out.
6 Likes
But are large cap and small cap expected to trade at same P/B. If you apply P/B logic large caps have not yet come to their 2008 levels.
“several companies in this space are loss making” . This logic apply to Nifty companies also, PSU banks, Telecom, Pharma are in temporary distress and have optically high PE.
Hi
Something which we have been discussing. Thought will share in light of the discussions by folks here.
These are all probability distribution curves obtained from NSE. Please click pics to see the full thing.
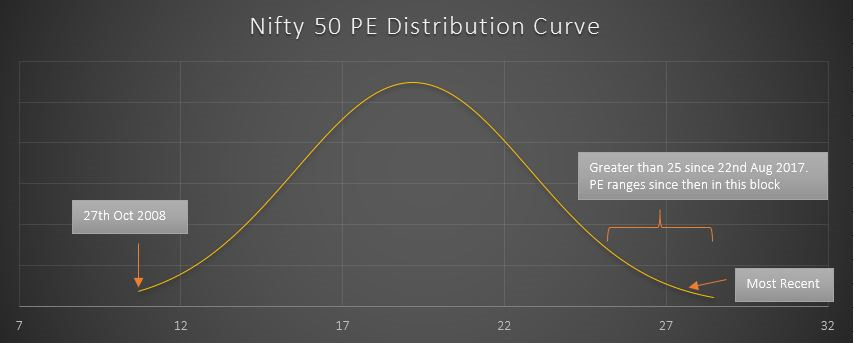
Index: Nifty 50. Date 1 Jan 1994 to 25 Jan 2018
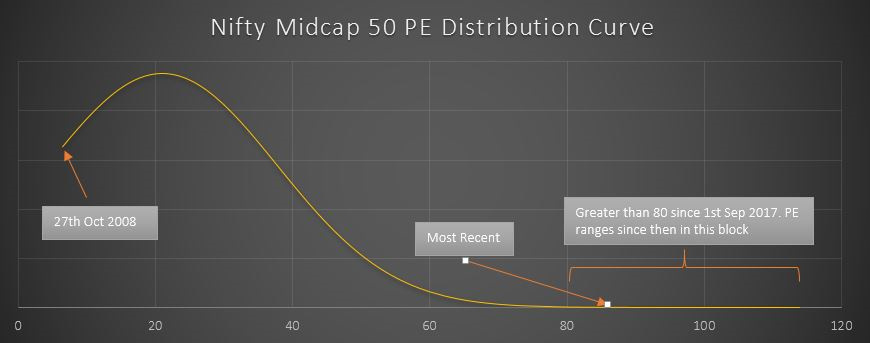
Index: Nifty Midcap 50. Date 1 Jan 2004 to 25 Jan 2018
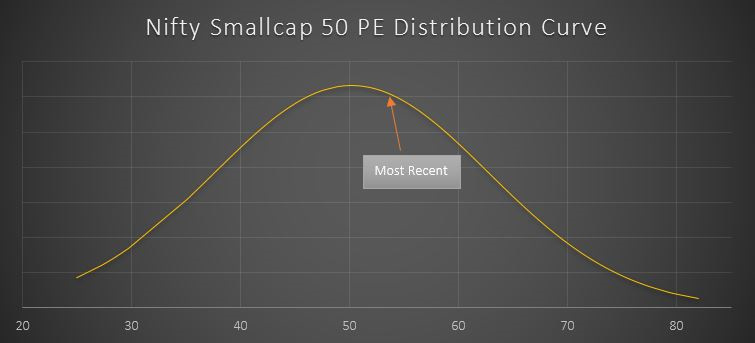
Index: Nifty Smallcap 50. Date 1 Apr 2016 to 25 Jan 2018
‘Most Recent’ is as on 25th January 2018
I am quite concerned about the highly skewed midcap probability distribution curve. Nifty PE is also out of bounds. Currently 98.98% of the area under curve is behind the PE on 25th of Jan. Nifty PE is over 28 or more only 0.7% of the times and above 27 PE only 1.5% of the times.
Regards
Deepak
4 Likes
deevee sir can you plot for Nifty 500 also?