There’s been a lot of good discussion around how expensive the market is with the objective of deciding what % of your investment portfolio should be invested in equities vs other safer investments like cash and fixed income securities.
If you are a long term investor in equities, you cannot avoid bear markets. Period. Trying to predict bears is like trying to predict heavy rainfall in Mumbai. You know you are going to get that every year just don’t know how often and how bad. No one stays home all monsoon season just to avoid getting trapped in rains, not even on days it’s raining heavily in the morning. People still step out to work.
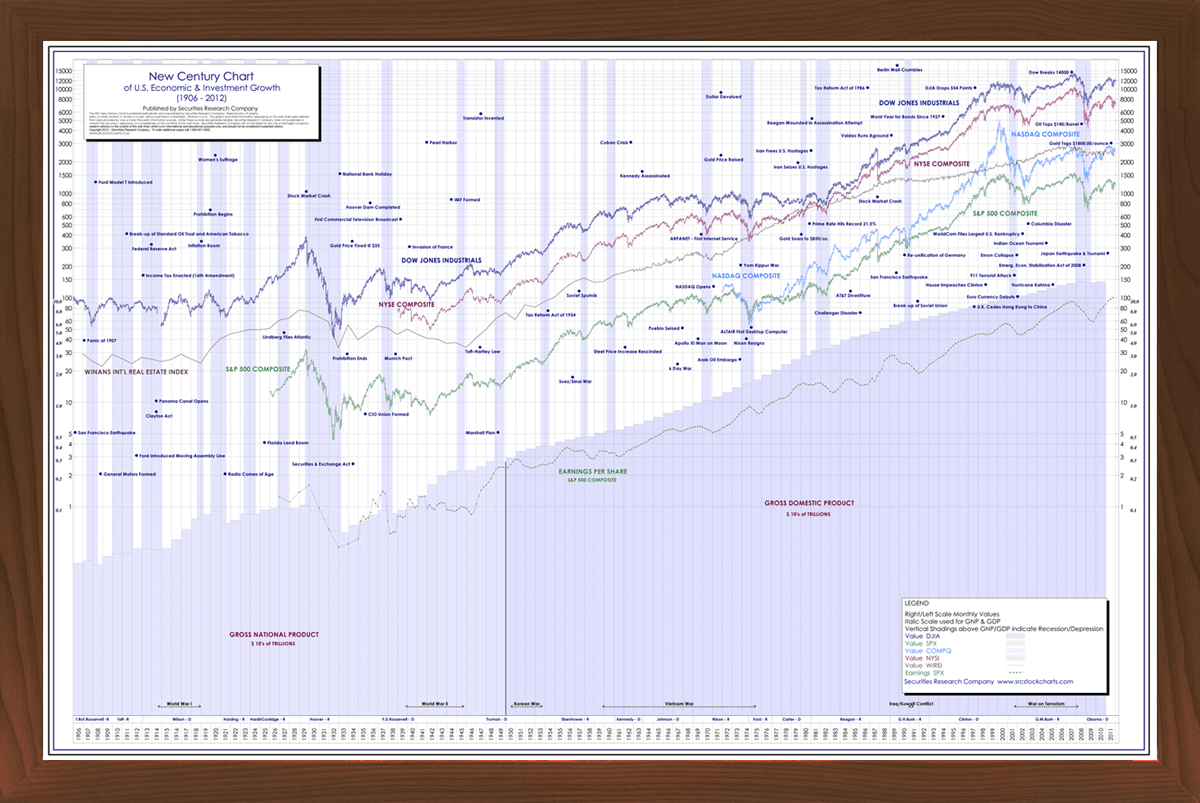
Here is one of my favorite charts showing 100 years (now that’s long term) of US Economic Indicators and stock markets
You can see that economy and equity markets survived two world wars, great depression, great recession, normal recessions, bear markets, technical crashes, natural disasters, terrorist attacks, bubble bursts, scandals, political instability etc and grew over the years. Sometimes more than the others.
Whenever I feel pessimistic, I look at this chart and ask myself if current situation is worse than any of the above listed situations. Well, it never gets worse than those. That helps me stop worrying about the market and focus on where my edge is and that is finding undervalued companies.
I think the current theme is “financial inclusion” and “digital”. Financials seem to be having highest allocations for most diversified mutual funds. Not sure how much the valuations are stretched in individuals stocks.
What a superb analysis!! One can never question the analysis that has been backed by solid data. As an investor, one needs to keep buying convictions, irrespective of market sentiments, true. But there is one fallacy in the data. India is not United States. If one disagrees, one just needs to find out how they recovered from the 2008 subprime crisis in just couple of years which could have taken any other country decades. Similarly, when the oil price started rising in 2007, they declared its peak oil and started preparing accordingly and in couple of years they were the biggest shale producer. Even today USA is producing so much crude that its exporting 2.13 mbpd. Our society and culture lacks that kind of innovation and entrepreneurship. So if some economic crash happens here, its very difficult to rise from the ashes at a fast pace. Even today after 25 years of liberalization, entrepreneurship is a less socially acceptable profession than being a clerk in some government office. We just tend to reward our laggards and penalize our innovators.
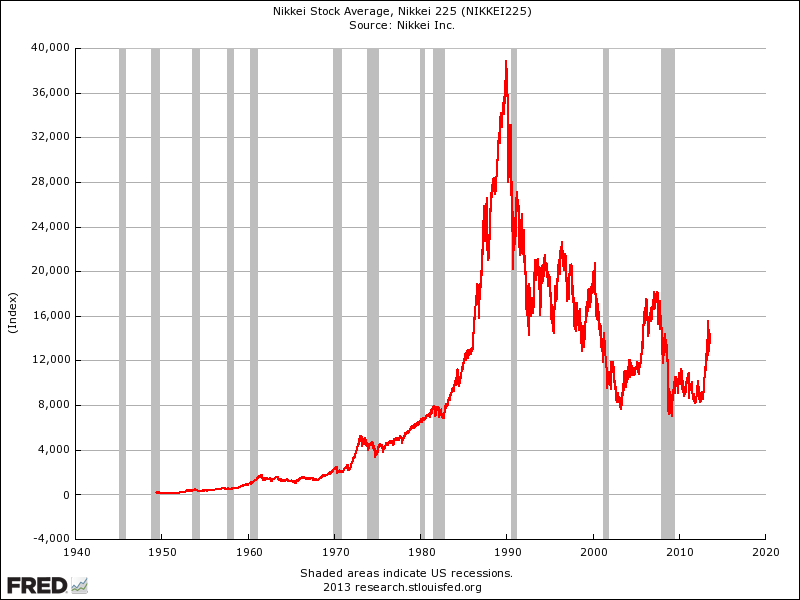
Another thing to remember is that not all developing nations become developed ones. Actually most of them get trapped in the middle income trap. Brazil, Argentina and many others are there for the decades. I have attached the Nikkei Long Term Chart here. As one can see, one generation of traders has started and stopped trading without seeing a bull market ever.
I am not predicting a crash, but just trying to remember both sides of the coin. Would be quite happy to be proven wrong as still more than 50% invested in equities.
This reminds me of late parag Parikh sir book. He has given a simple way to find if NIFTY is in bubble phase. Forgetting name but you can check.he has written only one or two. Very simple concept but very powerful. Long term nifty EPS cagr vs market cap cagr n track the gap
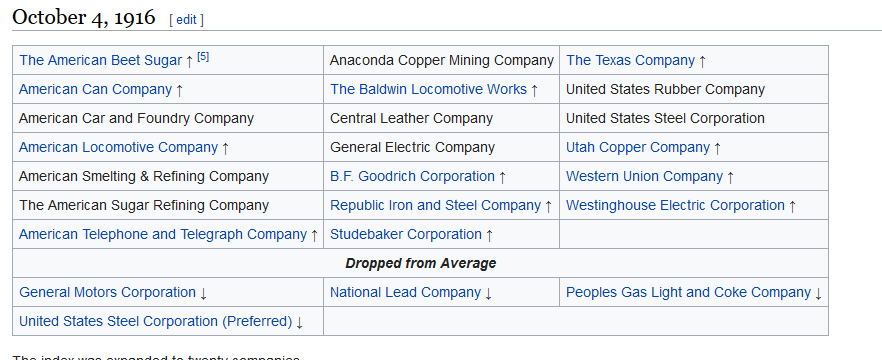
@Yogesh_s - This is very true, but again can be misleading. Any investor who had invested in an index fund would have had the return that the graph portrays. However, an investor who had invested in individual companies within that index might have a vastly different experience depending on whether he invested in International Business Machines, or the American Buggy Whip Inc. As was discussed a few posts above, an index is typically constructed in a fashion that an upward bias is inevitable. See the companies that constituted the index in 1916. ! An Index obfuscates the lifecycle of a company, indeed an entire industry over time.
India is in a slow but steady (and one way) transition from socialism to free market capitalism. US has always been a free market economy. The point is in 21st century Indian economy and markets can very well follow the same pattern that US followed in 20th century.
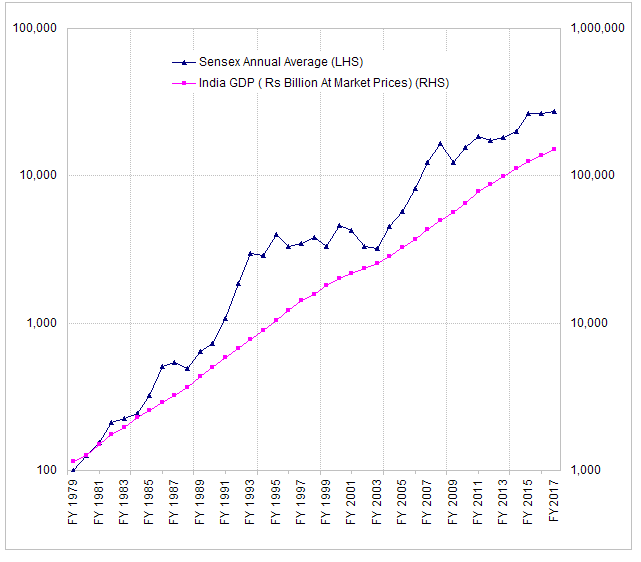
As the GDP grows, market grow with it. Sometimes ahead of it and some other times behind it but sooner or later it catches up. As can be seen from the chart above, most of the time it’s the GDP that is catching up with Sensex as investors are driving up the market in anticipation of GDP growth and GDP has indeed grown proving that investors were rightly optimistic.
100 years ago, US per capita GDP was more than what our per capita GDP is today (adjusted for inflation). Since our per capita GDP is so low ($1800 as compared to $55,000 for US), there is tremendous opportunity for growth. Investors have a reason to be optimistic.
India’s GDP growth disappointed for the second straight quarter, slowing down to a mere 5.7% in April-June and pitting the country behind China on the list of world’s fastest-growing major economies. The 5.7% fiscal first-quarter GDP growth, of an economy desperately trying to recover from the shocking impact of demonetisation, was much lower than the 7.9% seen in the same quarter a year ago. It even slowed down from 6.1% in the preceding quarter. Will this not weigh in on the markets, also that earnings are not too fancy this Q.
Nifty PE is an important, in fact indispensable, tool for the investors who want to value-invest in Index companies.
On the other hand, investing in individual companies is first a learning game, then an earning game. The learning curve is steeper.
Most investors that I have come across that invest in Individual companies admit that their returns have been shy of or at par with the Index returns. Very very few are able to beat the index. I believe the sole reason is conviction.
Reading and extrapolating from the numbers, whose source is the company itself, cannot give an investor conviction enough to weather the bear markets. However, in TCS or Sun Pharma it is doable.
Repeating, clarifying and simplifying my earlier post -
I have not said Nifty PE is not important, merely that it can be misleading to conclude that a portfolio mirrors that same return over an extended period of time.
I have not compared Index investing versus individual stocks except to the point of saying that an investor picking two different stocks can have vastly different returns. The implication here of course is that the 100 year return on the Index can only be achieved in an index fund.
Beating the index is not something I have even remotely alluded to.
To give examples from our own index, if an investor had invested in a portfolio of companies in 1980 and still held on those today, the returns would be different than what the index indicates. This difference is because the Arvinds, Century textiles, Hindustan Motors & Satyams are replaced over time by HDFCs, Bajaj Finances and such. Investing in an Index fund automatically enables this selection and thus the returns. Investing in an individual portfolio of Century Enkas, Textiles, HM does not.
Thanks to all for sharing their views on current market conditions. It does make me reconfirm the approach taken multiple times. Hat’s off to all the people who are in cash due to Market PE crossing 26. I find it very difficult to stay in cash due to following reason.
Lets say one finds self in a Bear market. One goes 100% invested hoping to make returns when markets turn. However the bear market continues, not for months but 2-3 (or more) years. In such cases, it is bit easier to stay invested if One convinced of picks, invested money is not required to be returned and invested companies are doing as expected. Moreover, if one has constant source of other income, keep on adding the companies available at cheap rate thus some day that person gets rewarded handsomely for patience.
Now consider doing same in Bull market. One goes 100% cash thinking its too hot. However the bull market continues not for months but 2-3 (or more years). In such cases, it is very difficult to stay in cash and see all (previously invested) companies doing extremely well. When the bull market turns then one is not rewarded for patience but have only safeguarded his original amount.
This will/may work (now in hindsight) when one has other assets which are giving amazing returns (real estate, gold from 2007-2010) and invest in those instead of equity. Currently no other assets are as exciting.
One can keep on adding cash in cash account from other source of income in bull market but it is not same as investing in cheap companies in bear market as Cash wont give kind of returns that bear market will give when it turns.
I feel even at worst times, one should not go beyond 50% cash and hold on to good companies based on conviction.
Everyday I feel like taking loan and invest 100-150%
Never felt like sitting on cash ,instead feel like borrowing to invest
But then need to control myself and stay only 100% invested
Not more that that
And no way sitting on cash in this bull run
A fundamental principle in finance is that asset prices are inversely related to the level of interest rates. Higher the rates, lower the asset prices (almost any asset) and lower the rates, higher the price. All comparisons of market P/E over different points of time have to factor in this relationship, without which the analysis is incomplete.
In India, investors in the mid-1990s were getting 13%-17% even for risk-free, Triple A bonds while the inflation rate was in double digits. The rates have gradually trended downwards (with intermittent bumps, of course) as economy has opened up and capital scarcity reduced. The constitution of the Monetary Policy Committee in 2014 with a mandate to maintain inflation rate at 4% virtually guarantees low inflation in the economy, which in turn will keep interest rates low, and consequently asset prices high. So long as these conditions persist, P/E will remain elevated compared to historical standards, though how much elevated is a matter of further research.
All comparisons of today’s P/E with the past have to adjust for this.
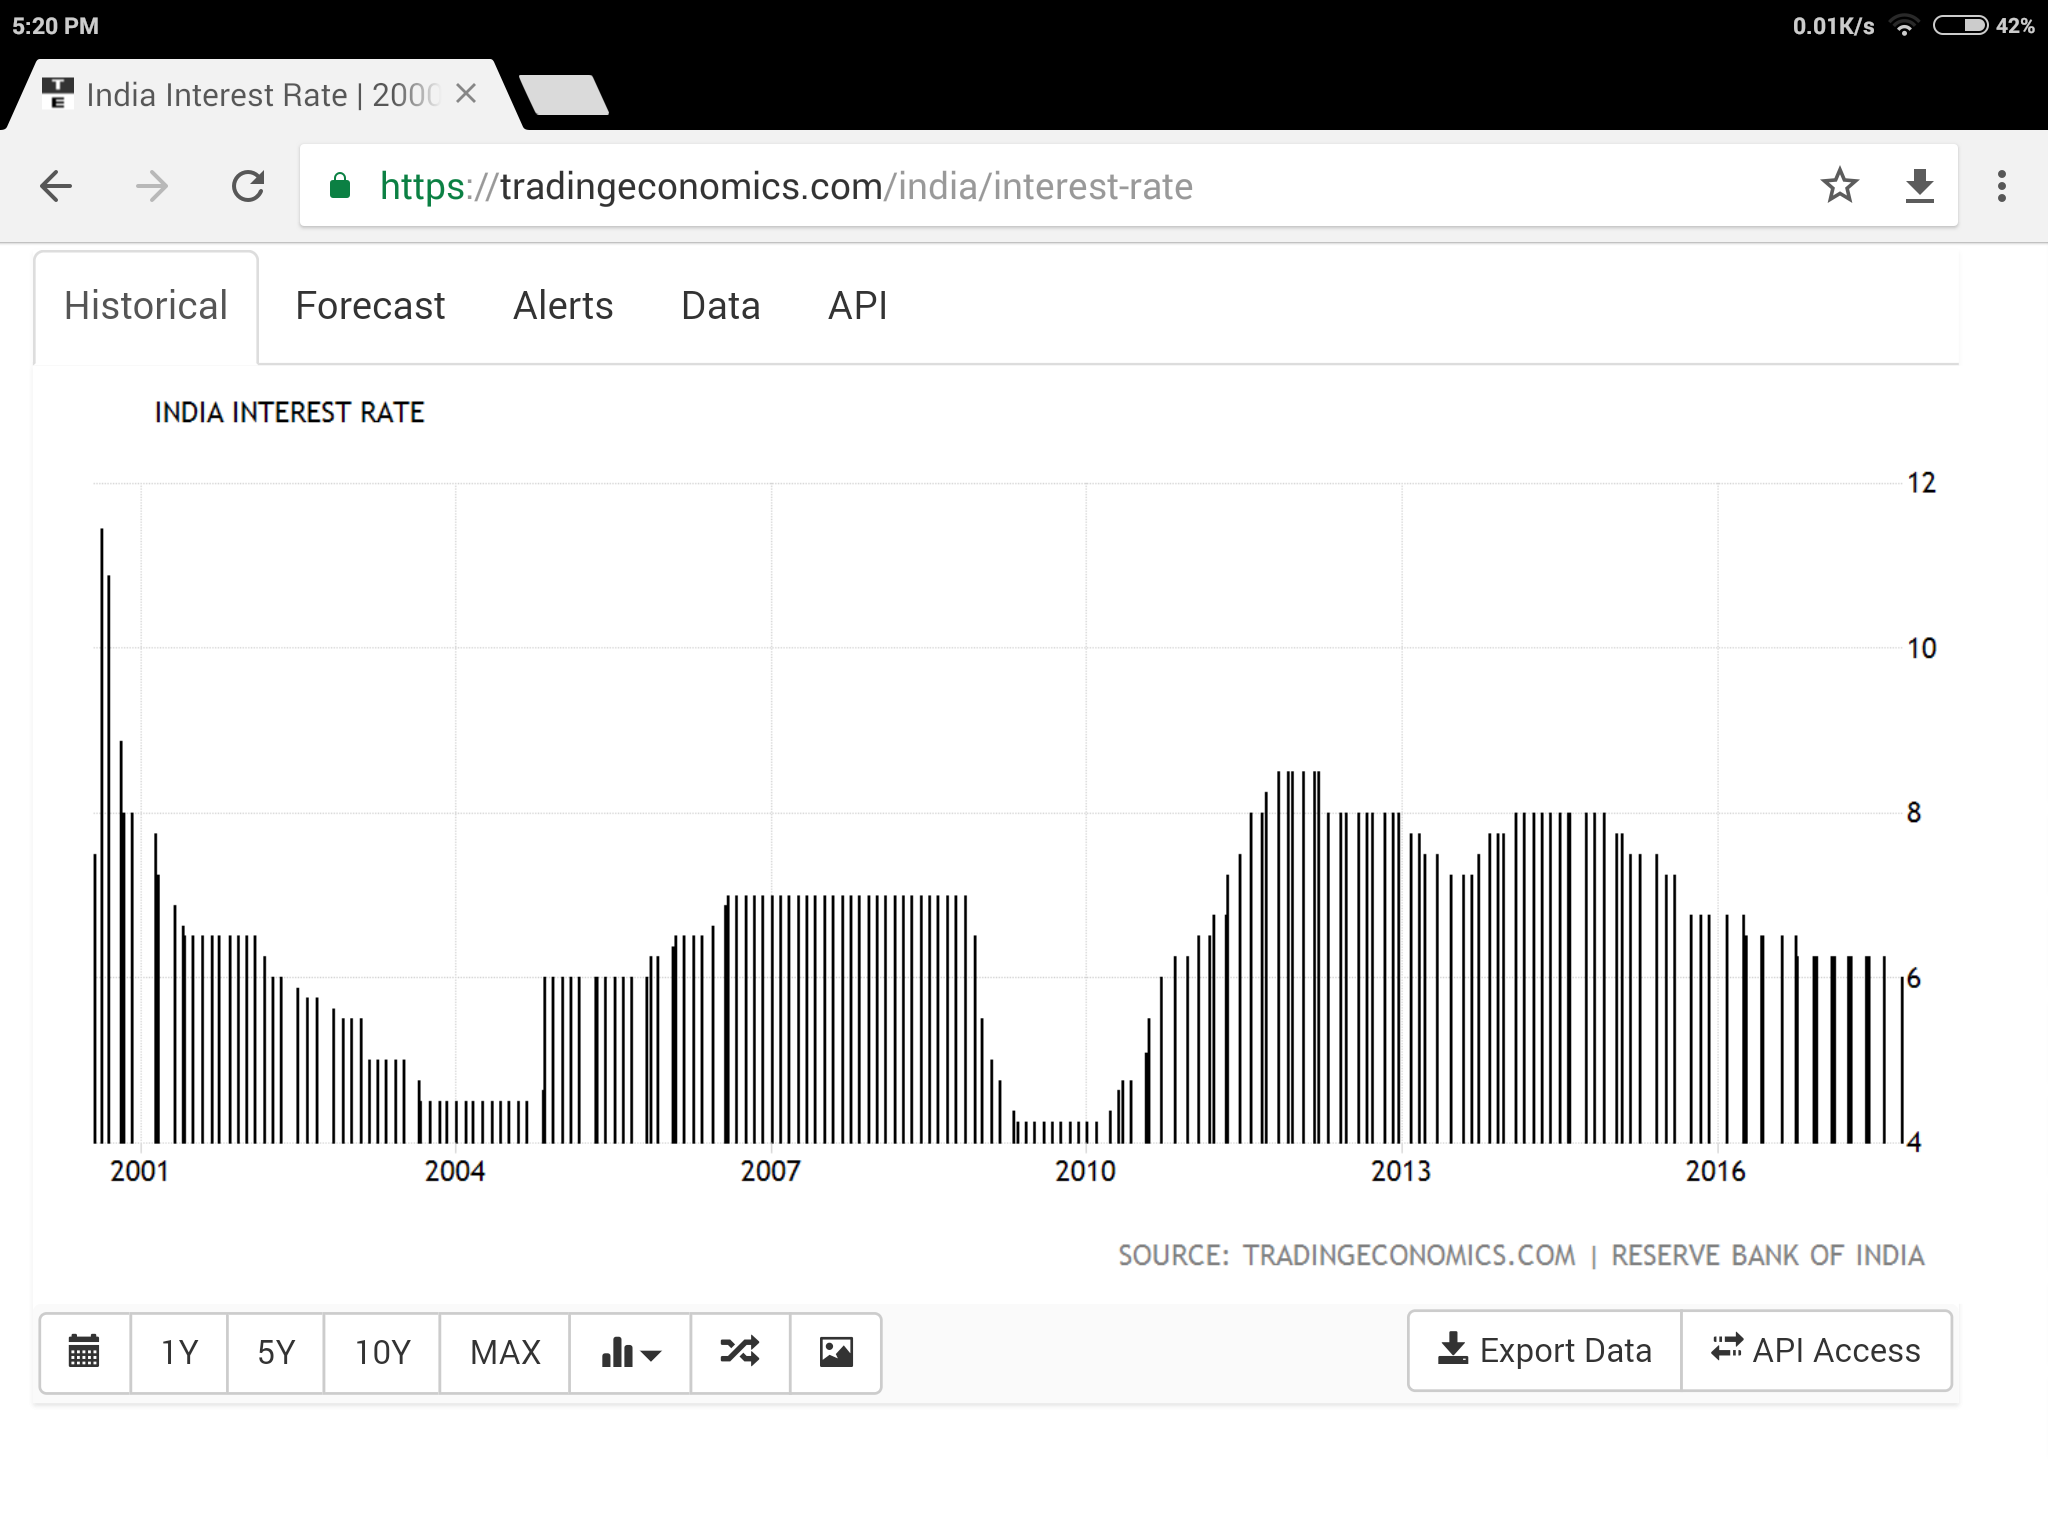
It’s true that there is a negative correlation between asset price and interest rate; however, in current scenario this does not hold true because interest rate is not much lower now than previous periods. Image of RBI long term interest rate chart attached for further reference.
Here are my thoughts of why we are near to a market top than ever in last decade. Most of it here are anecdotes and hearsay and may or may not be backed by solid data.
Firstly, what I call is the Warren Buffett Index. The more people know and discuss about Warren Buffett, the closer we are to the market top. The reason is Buffett (except for his wealth) should appeal to a very limited public and not to the masses. But right now Buffett is more popular than a rock star. More importantly many people think that they can do value investing in an accelerated way which is a pretty nigh impossible concept like accelerated pregnancy.
There is not only froth in the market, some stocks have even crossed the froth level and have gone to stratospheric levels. A company changes its name and hits upper circuit for couple of days, another tin plate packaging company trades around FANG level of valuation. These events are becoming more and more common. Almost everyone is getting calls and SMSs from firms to invest in so and so companies and double money in weeks.The rate of financial fraud is rising at an alarming rate.
Distribution is rampant. Distribution is not just performed by cunning market operators. The institutions (so called smart money) are the biggest distributors. SBI, HDFC, ICICI all have distributed subsidiary insurance firms at exotic valuations. Compared to them, the valuation of global insurance leaders like AXA, Zurich or Prudential Plc are three times cheaper. Similarly, ChrysCapital has recently exited a little known generic producing pharma stock at around 50% premium to current pharma leaders. These IPOs and QIPs are more than enough to suck out all the liquidity that came after demonetization through MFs.
All these are indicators that a market top is forming. Whether it happens in this quarter or after couple of quarters is immaterial. The direction is set. The only indicator that I found to be lacking and that may confirm my hypothesis is : Capitulation of bears and the subsequent market meltup. As long as bears are in the system, the corrections would be shallow, only after the bears have thrown their towel, there would be deep corrections.
Pretty depressing thoughts for a Monday morning…
P.S.: This is a pure academic exercise and not a buy/sell advisory.