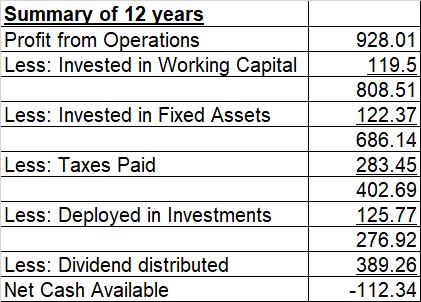
I have carried out a summary of KKCL operations for last 12 years’ operations and cash flows
Note: All figures in crs, taken from screener.in
If this is correct, the company has been paying dividends out of its capital, or rather borrowing to pay the dividend.
This is an example of erroneous capital allocation. The company should cut its dividend payout, liquidate its investments to retire the debt and rebuild its capital. At a time when the Indian GDP is growing and rural markets are throwing up opportunity, the Company has paid out more in dividends rather than deploy the cash in its business, which is absolutely ironic.
I think this conclusion is incorrect. At the most you could say, they have made investments by raising debt. If their cost of capital is lower than return on capital employed, then what is the problem? They have comfortably made capex as well as met the working capital need using the profits.
The family is more interested in the real estate business built out of dividends from kkcl. If you follow the company correctly the promoters have built huge residential towers at Dadar and that’s taken quite a bit of their attention away from the listed clothings business.
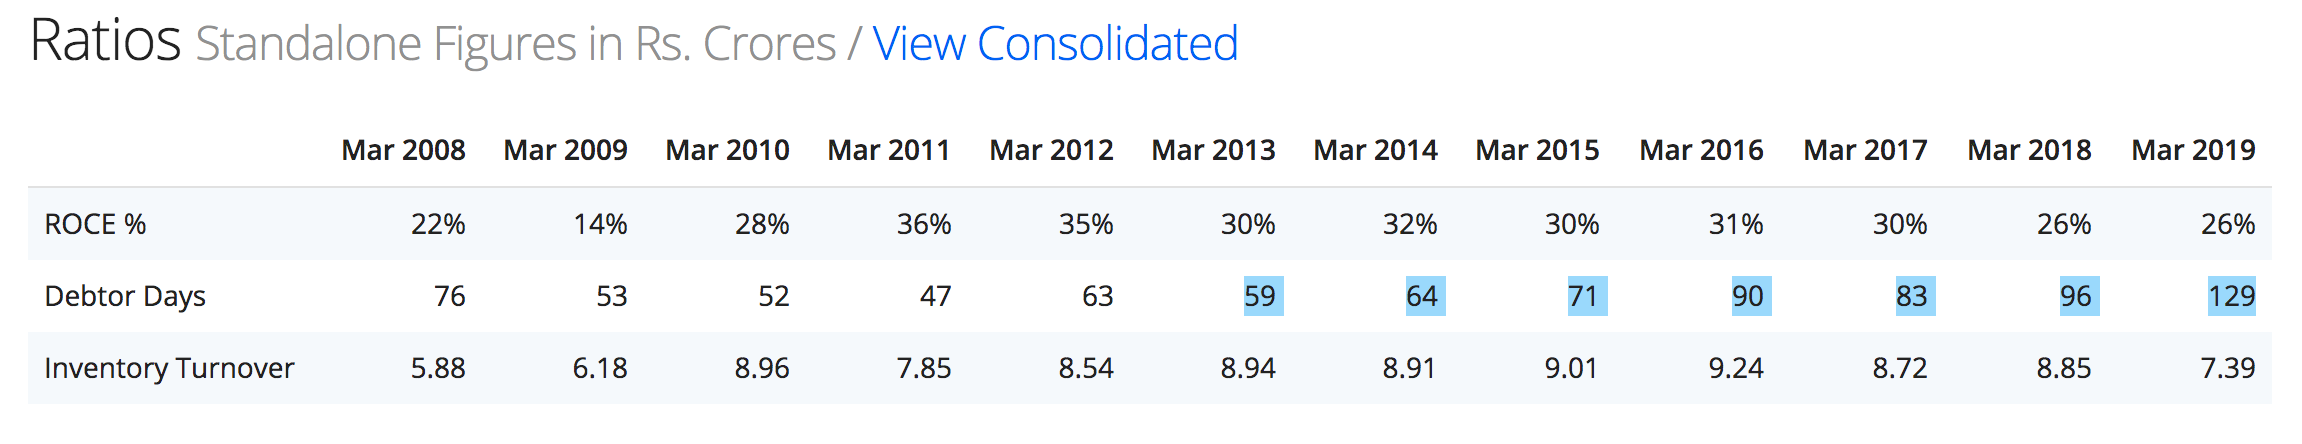
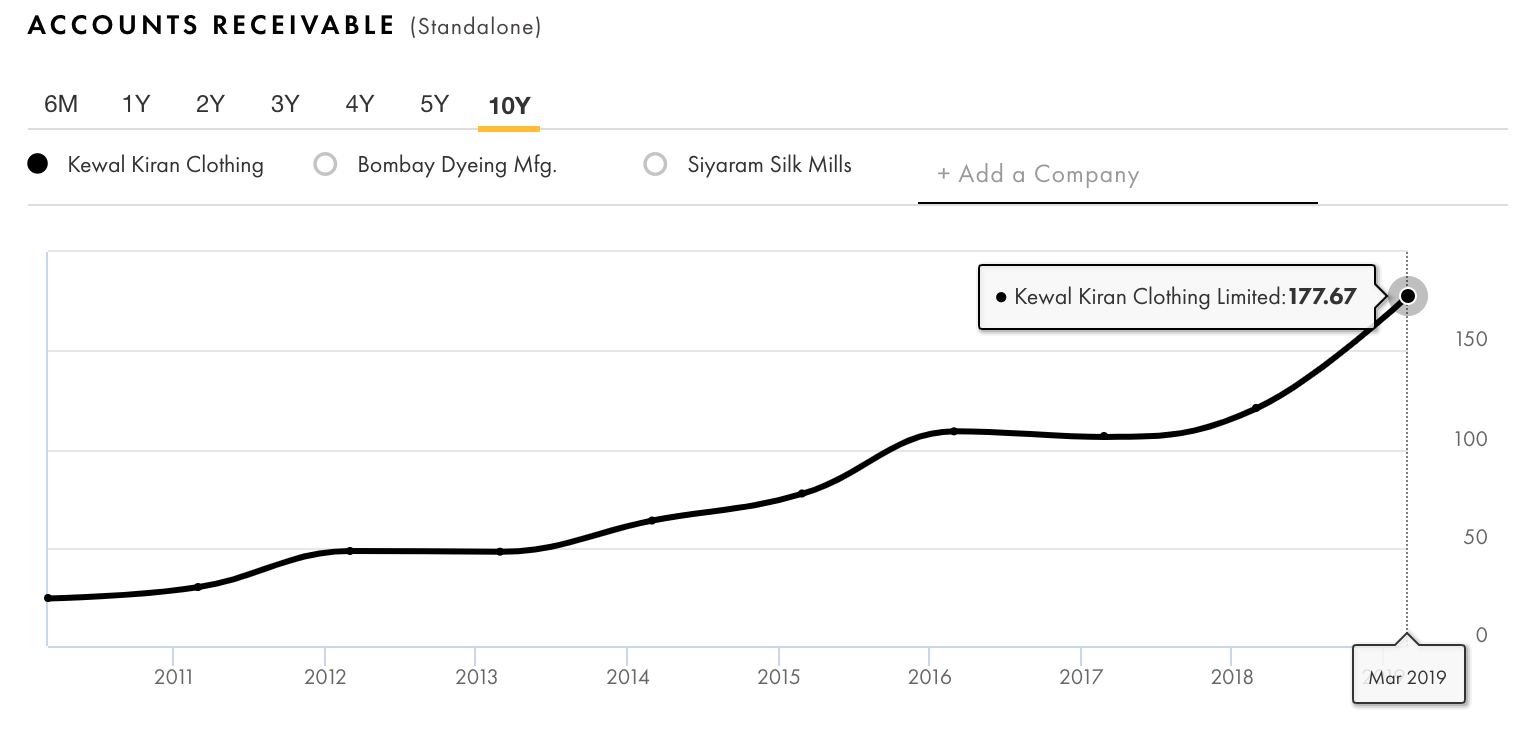
The receivables have in fact been trending upwards for the last few years. The management has clearly done poorly on the efficiency part. This is surprising because this was least expected from management who is know to be prudent and has the below lines in their annual report:
We are firm advocates of the old ‘cash is king’ adage and believe that cash inflows help brands grow and reinforce their competitive positioning. We maintain laser-sharp focus on inventory and receivables. Besides, we avoid borrowings to reduce the burden of finance cost and retain market leadership, without compromising on quality or pricing.
I see KKCLs growth was muted/low after 2016. I dont understand why its still favorite for Institutional Investors who still owns 20% out of 25% non promoter shares. I am just trying to understand what could be the possible rationale for this.
Is this business(probably industry and brands) that valuable which is still not unlocked real potential ?
Dividend distribution, cash generation and valuation?
• EBO count of 322 has grown anemically at 3% CAGR over the last 10 years. This would compare to ~8-10% for competing brands and apparel brands in general.
• Worse yet, KKCL has refused to invest in own EBOs. Franchise EBOs make up nearly 100% of stores for KKCL.
• EBO channel sales CAGR has been anemic at 2%. This implies an EBO SSSG CAGR of only 1-2% which is very weak and suggests that some EBOs may be struggling to remain profitable. An SSSG of minimum 3-4% is needed to cover cost inflation.
• Not surprising then that EBO closure rate has been high. For every ten stores opened in the last 10 years, eight have been shut. As a result, while the gross store addition has been healthy at 15%, net store addition has been only 3%.
• The company might guide for a 10% EBO store addition but that counts for little if the net addition is going to be 2-3% due to higher store closures.
• Globally and in India, the faster growing apparel categories are 1) women’s wear 2) tops (non-bottoms) 2) athleisure 3) accessories
• KKCL is caught at the wrong end and its key products are indexed to slow growing segments – men’s wear, denims, and bottoms. Denims and bottoms make up ~70% of sales. There is no athleisure with KKCL. Accessories have stagnated at single digit % of sales.
• KKCL is stuck in categories which are growing slowly and losing share within them. Not a good combination to have and something must give, and it probably has (more on the later).
• KKCL’s other brands have not scaled up as expected. The mother brand, Killer, continues to contribute ~60% of sales today which is same as did ten years back. Other brands such as Lawman and Integriti have reached some small scale but got stuck at those levels.
Unlike scores of other Indian companies, KKCL has not inducted enough professional talent in the top ranks. Such talent is needed to further scale up operations once brands have reached a certain level of sales. The four Jain brothers have been at helm for the last two decades.
The same four brothers are also directors in the family real estate business – (link). It seems, that the dividends from KKCL are deployed in the real estate business. That explains prioritizing profits overgrowth at KKCL. Let’s not underestimate the drag on management bandwidth.
|o|As we have seen above, the sector leading profitability was partly a function of underinvestment in EBOs leading to lower rentals. KKCL also had lower staff costs until FY12 but have sharply risen over the last few years (500bps over FY12-19) as they have had to beef up middle management ranks. |
|—|---|
|o|EBITDA margins have come off over the last few years – from a peak of 26% in FY14 to 18% in FY20. KKCL has finally woken up to the fact that excessive margin focus at the cost of growth endangers brand health and market shares over the medium term.|
|o|While they remain conservative on investing in EBOs, there has been an attempt to push growth through LFS, Online and Factory Outlets, all of which are margin dilutive (versus EBOs and MBOs). |
|o|Sales promotional expenses have shot up sharply from 1% of sales in FY15 to 8% in FY20. |
|o|Sales realization CAGR of 3% over FY16-20 has been lower than MRP CAGR of 9%. This suggests rising share of discounted sales. |
|o|All the above suggest weakening brands and a bit of desperation to drive sales via higher promotional intensity and lowering price points. |
|o|FY14-19 EBITDA CAGR has been 4% versus a sales CAGR of 7%. A sub 5% EBITDA CAGR over FY14-19 is very weak and compares with TCNS’ 50%. |
|o|The attempt to push sales is visible on the balance sheet also. Receivable days have grown sharply from 70 days in FY15 to 130 days in FY19. |
|—|---|
|o|We have not seen such a deviation in other players such as Page and TCNS who receivable days remain steady over the last five years. |
|o|The lengthening receivable days has hurt cashflow conversion – CFO/EBITDA over FY17-20 has dropped to 50% versus 75% over FY13-17. Given the pressure on margins, the FCF/ Sales ratio has moderated from 15% until FY17 to below 10% over FY17-20. |
|o|Consequently, operating ROCEs have moderated from 50% in FY14 to 25% in FY20, though on an absolute basis, remain healthy. From a market perspective though, the direction of incremental ROCE matters. |