
The answer to your first question: due to the capex, ROCE takes a hit. You can see CWIP was more than 180-190 Cr.
1 Like
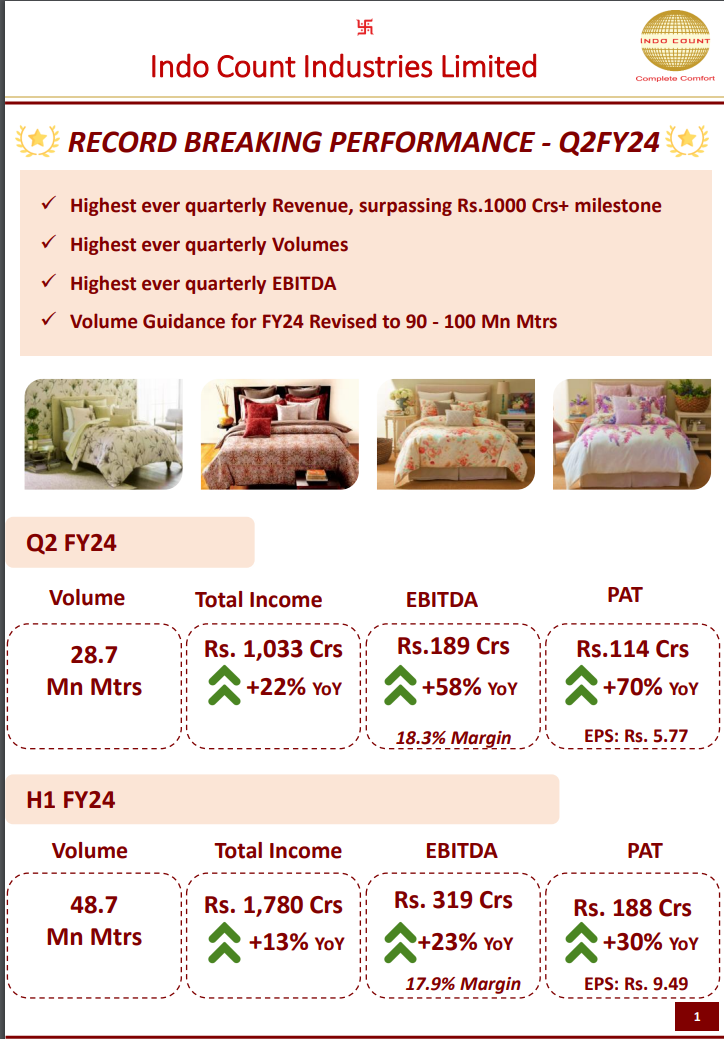
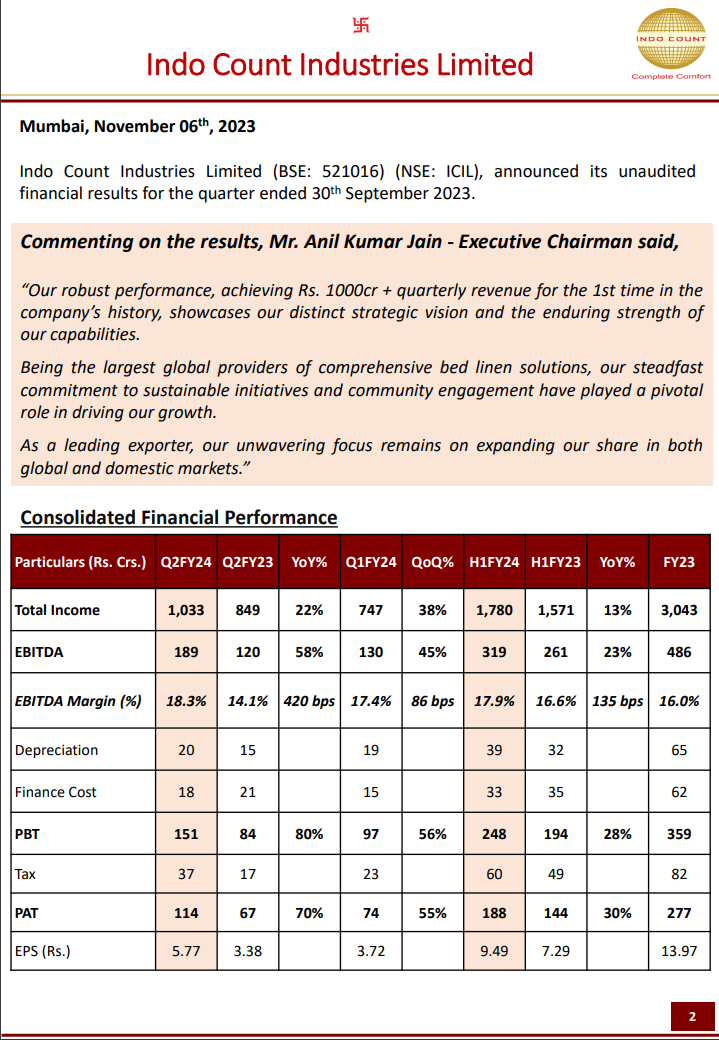
Indo Count Industries Limited: Record-Breaking Q2 FY24 Performance
Key Financial Highlights:
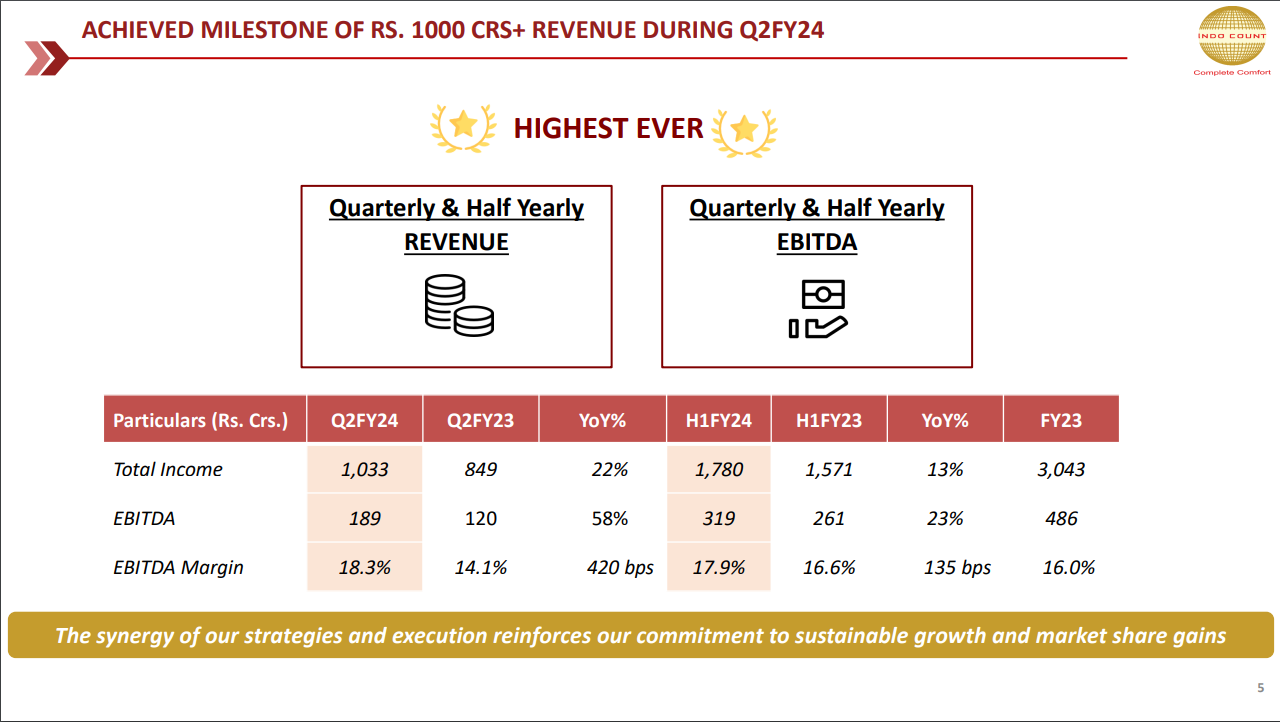
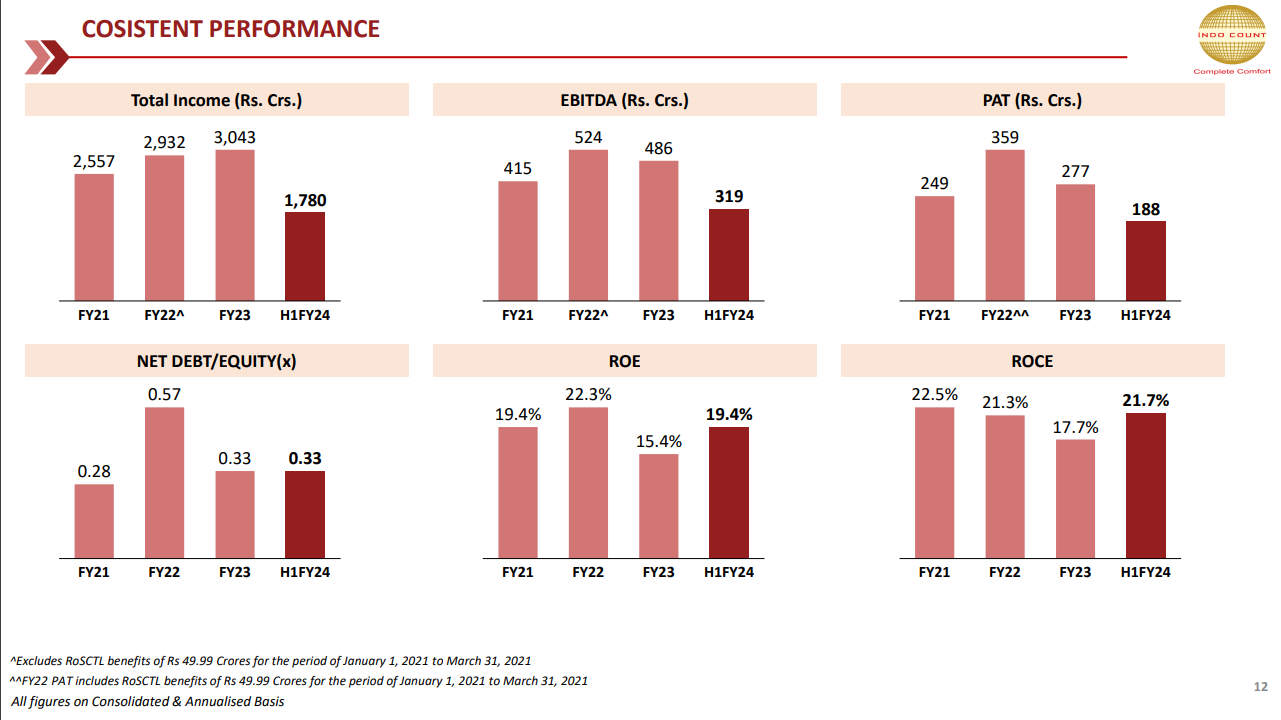
- Total Income (Q2 FY24): Rs. 1,780 Crs, +13% YoY; (H1 FY24): Rs. 1,033 Crs, +22% YoY.
- EBITDA (Q2 FY24): Rs. 319 Crs, +23% YoY; (H1 FY24): Rs. 114 Crs, +58% YoY.
- PAT (Q2 FY24): Rs. 188 Crs, +30% YoY; (H1 FY24): Rs. 74 Crs, +70% YoY.
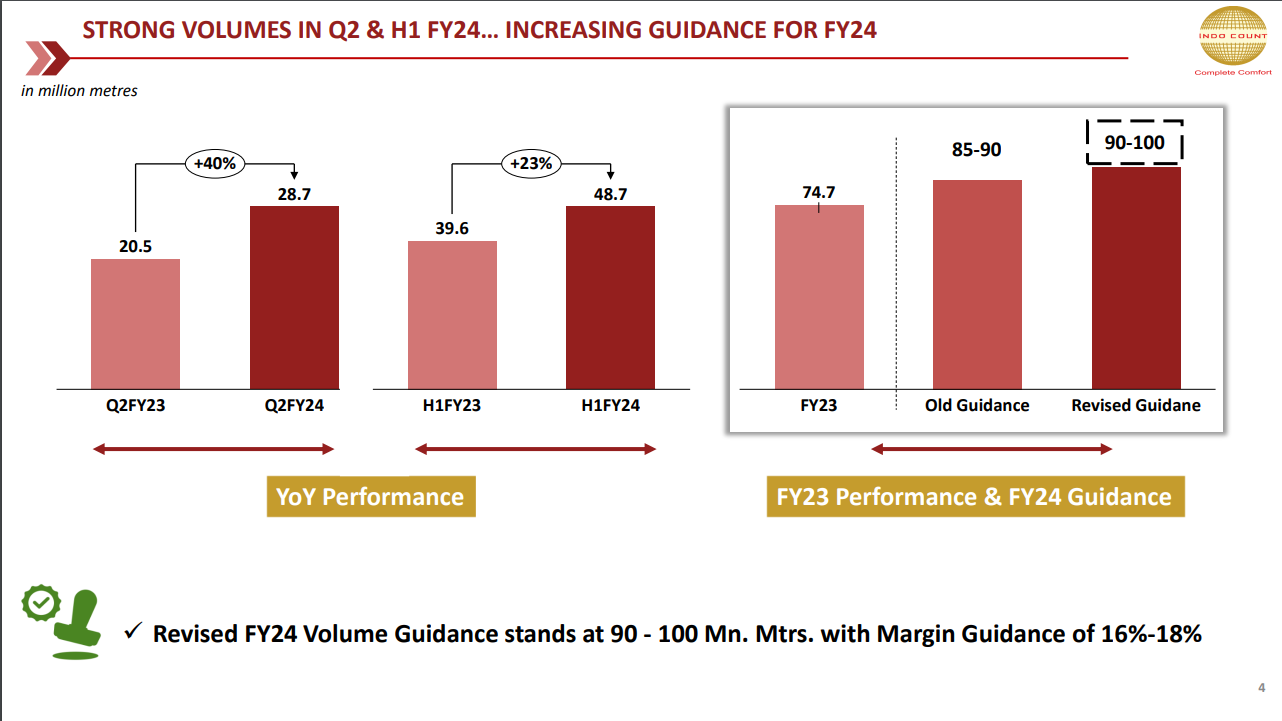
- Volume (Q2 FY24): 28.7 Mn Mtrs; (H1 FY24): 48.7 Mn Mtrs.
- EBITDA Margin (Q2 FY24): 18.3%, +420 bps YoY; (H1 FY24): 17.9%, +135 bps YoY.
- EPS (Q2 FY24): Rs. 5.77; (H1 FY24): Rs. 9.49.
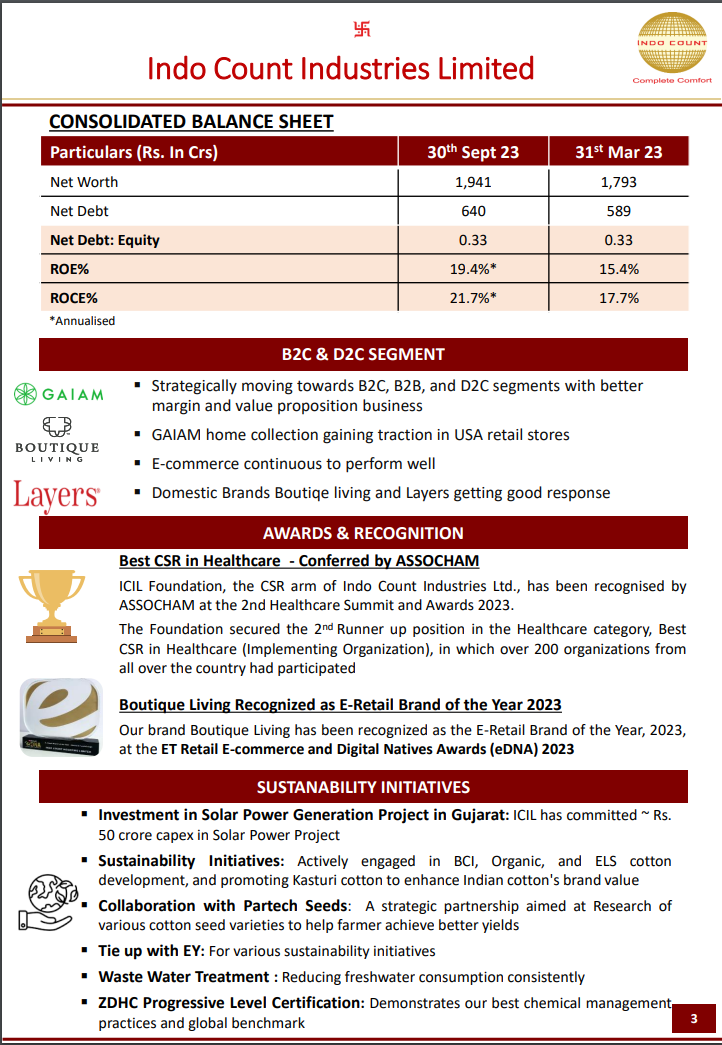
Consolidated Balance Sheet (as of 30th Sept 23):
- Net Worth: Rs. 1,941 Crs.
- Net Debt: Rs. 640 Crs.
- Net Debt: Equity: 0.33.
- ROE: 19.4% (Annualized).
- ROCE: 21.7% (Annualized).
Strategic Initiatives:
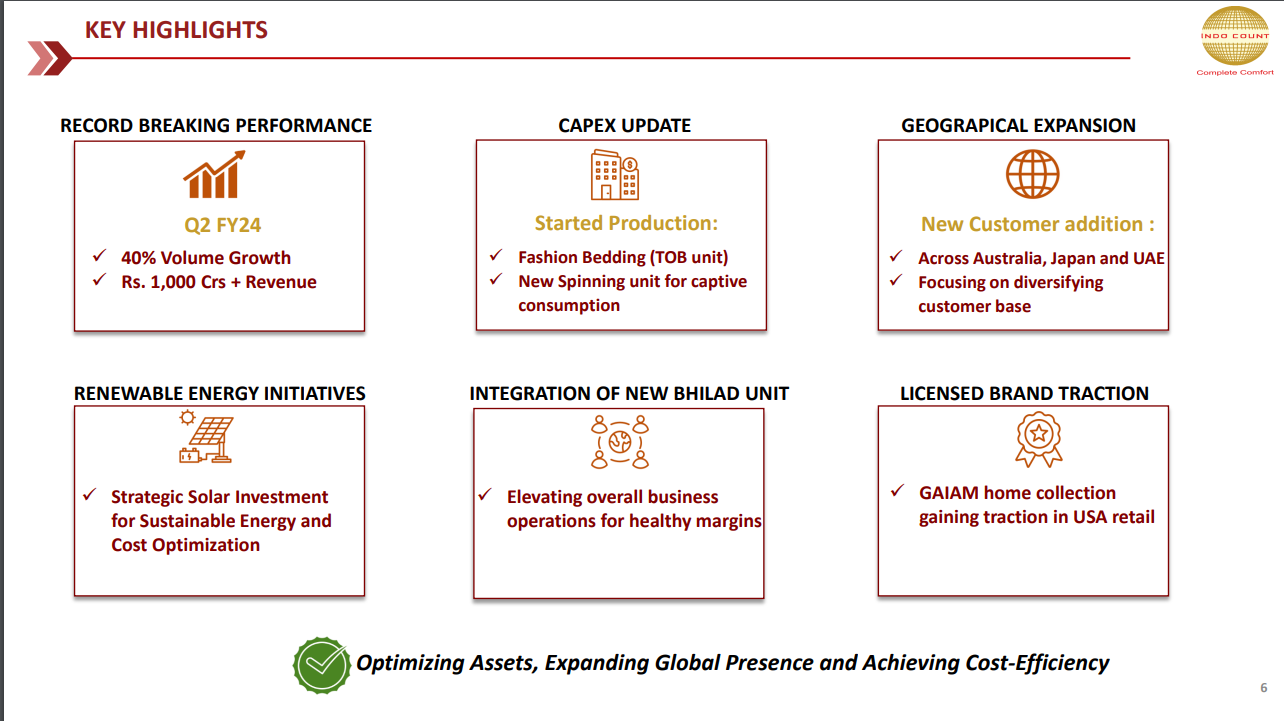
- Record-Breaking Performance: Achieved highest-ever quarterly Revenue, Volumes, and EBITDA, surpassing Rs.1000 Crs+ milestone.
- Volume Guidance for FY24: Revised to 90 - 100 Mn Mtrs.
- Strategic Vision: Mr. Anil Kumar Jain, Executive Chairman, highlights the distinct strategic vision and enduring strength of capabilities, achieving Rs. 1000 Cr+ quarterly revenue for the first time in the company’s history.
- Global Leadership: Being the largest global providers of comprehensive bed linen solutions, with a focus on sustainable initiatives and community engagement.
- Market Expansion: Unwavering focus on expanding market share in both global and domestic markets.
Segmental Highlights:
- B2C & D2C Segments: Strategically moving towards B2C, B2B, and D2C segments with a focus on better margin and value proposition business.
- Global Recognition: GAIAM home collection gaining traction in USA retail stores. Recognition of Domestic Brands Boutique Living and Layers.
8 Likes
Indo Count Industries:
Q2FY24 Short Notes:
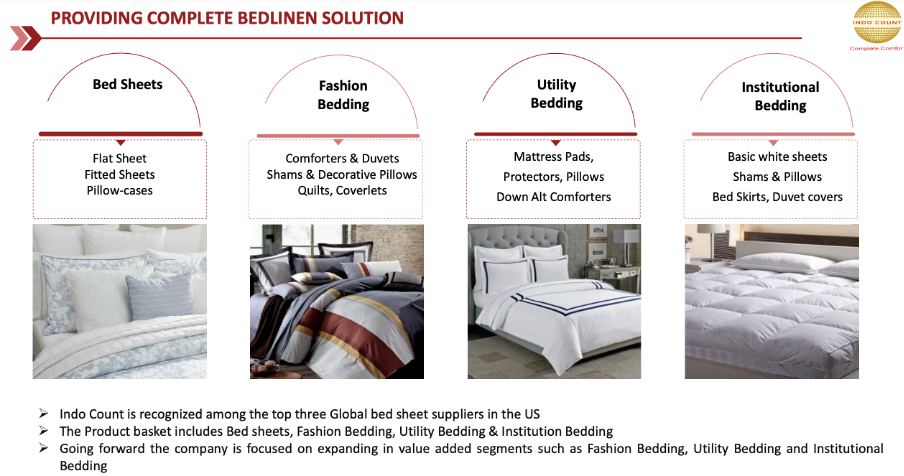
Product Mix:
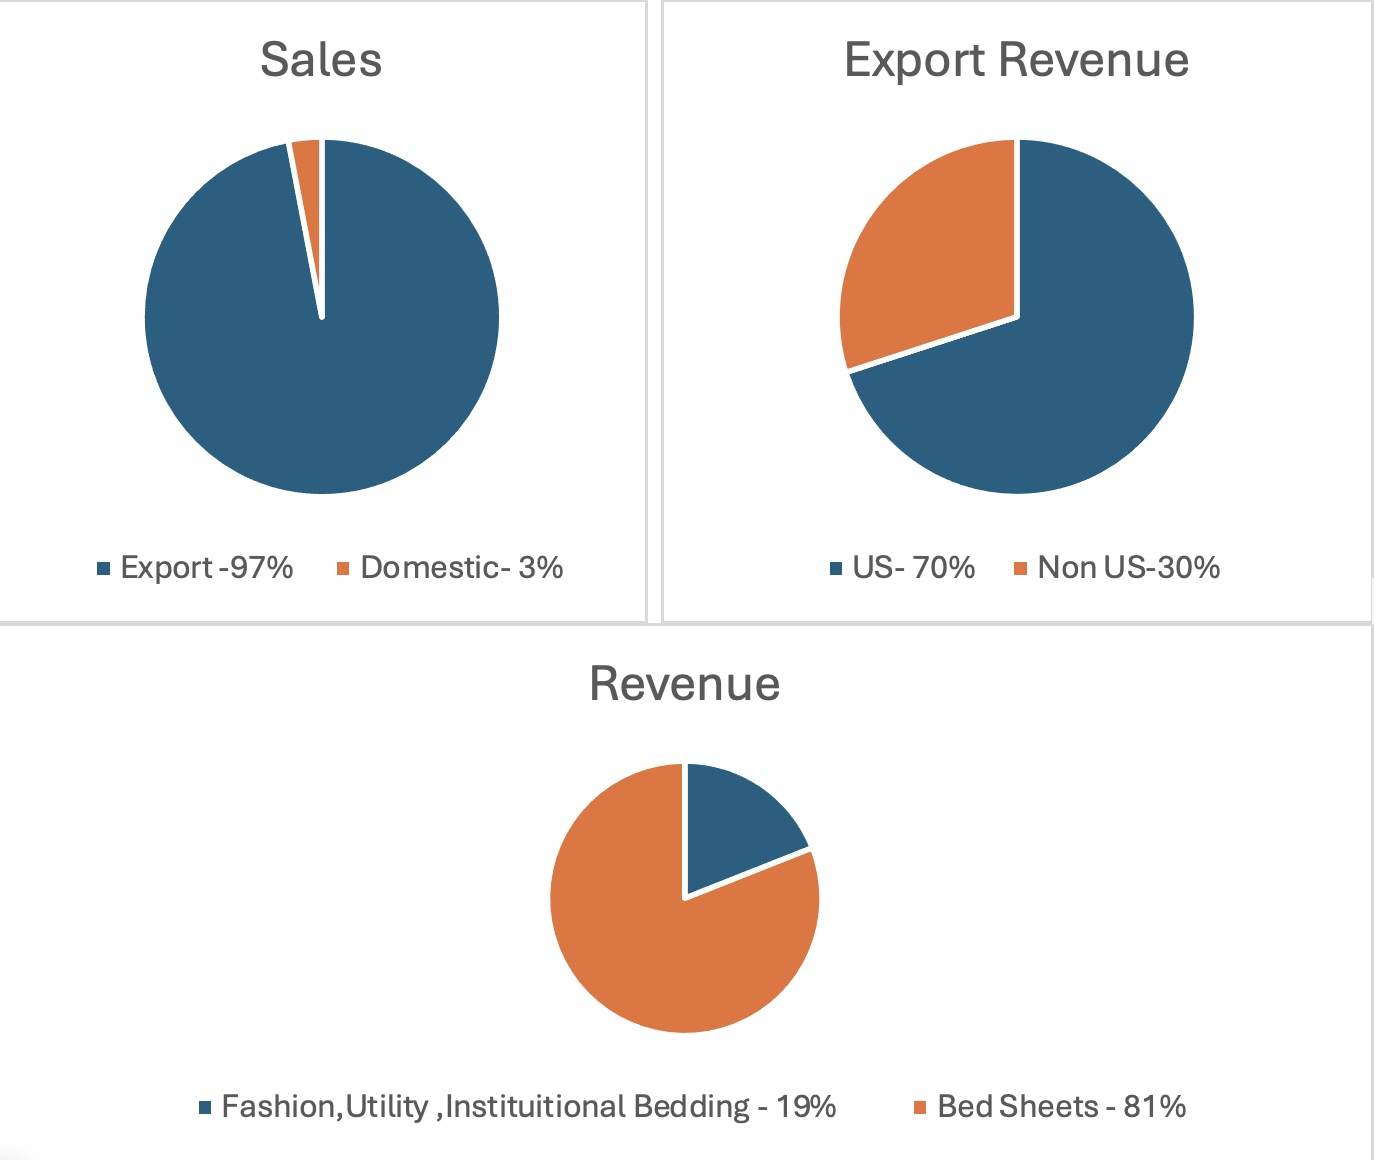
Company’s product portfolio includes Bedsheets, Fashion, Utility and Institutional Bedding. Company Plans to increase Fashion, Utility and Institutional bedding as a proportion of the sales from 19% in FY 23 to 30%. All these are high Value-added products and will improve the Margin Profile of the company. There is significant opportunity in this segment due to China plus one Strategy as this segment was previously dominated by China.
Geography Mix:
Currently generating 70-75% of the revenues from US. Company plans to reduce this to 60%
Strategy for doing this:
FTAs with Australia and UAE has helped in reaching new customers. Also, we are getting significant inquiries from Latin America and Japan. China plus one is also helping in reaching new geographies. Potential FTAs with UK and EU will be a big boost to achieve this target.
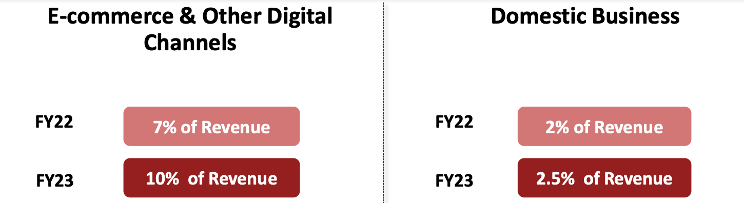
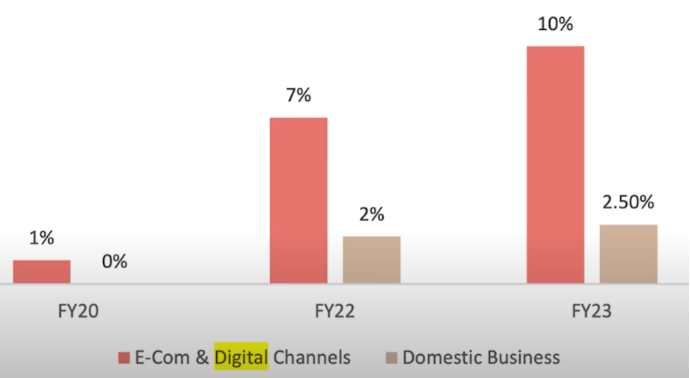
India generated 2.5% of the Total Revenues in FY 2023. Company plans to increase this to 10% and beyond in the next 5 years. Currently, Indian Demography is positive towards consumer products. For this One Aspiration Brand Boutique Living and one Value brand Layers has been launched and company is working on B2C, D2C strategies.
Volume Growth Guidance:
Company has revised the Volume growth Guidance from 85-90 million metres to 90-100 million metres for FY24.Company said due to significant order inflows they are expecting to reach the higher end of the guidance but considering the geopolitical situation they are proving a range.
Capital Allocation Strategy:
Company has completed majority of the Capex in the last 2 years and company has no plans to do capex in the next 3 years and their plan is to enhance the capacity utilization from current 60-62% to 100%. Company’s plan is to reduce debts and make debt free. Company also invests in areas like Solar Plants to reduce the Costs.
Company is having all time High EBIDTA margins in the range of 16-18%. But, all the above efforts will not only help in sustaining the EBITDA Margins but also improve it.
Overall Positive Triggers for the Company:
Company has Significant Volume growth Opportunities.
Operating leverage Advantage due to Capacity Utilization currently at just 62%
Improving Product Mix and Cost Rationalization will help in Stable or Improving EBITDA margins.
PAT Margins will improve non-linearly as interest Cost will reduce due to reduction of debt and Depreciation will reduce as no capex was planned for next 3 years.
Disclosure: Invested and Biased
10 Likes
Some Key variables which are likely to support the share price growth in the next 3-4 years:
- Consistent volume growth of 15-20% over next 3 years
- Margin expansion from 14-16% to 16-18%
- Scope for PE re-rating with higher growth and margin expansion
- Product mix change- higher share of value-added products
- Debt Free in next 2-3 years due to significant operating cash flow and no major capex planned
- Favourable macro and industry tailwinds: FTAs, China +1, Headwinds in Pakistan and Bangladesh
10 Likes
Hi Neil,
Are you still tracking the company. The company achieved 1000 cr revenue in recent quarter.
@harsh.beria93 @Worldlywiseinvestors what are your views on the Indo Count. it seems to be market leader in bed linen. Gone through recent con-call notes.
Management guided volume for FY24 to a range of 90 million to 100 million meters, new geographic expansion, spending 50 crore investment in 10 MW solar power generation project, EPS is INR 5.77 in Q2 FY24 and for the half year FY24, it is INR 9.49. Net Debt to Equity ratio 0.33.
Regards,
Satya Yenumula
4 Likes
Pick up in western markets post inventory destocking, expected volume pick up in Q3 due to holiday season and higher contribution from value added products are positive triggers but one should watch out for the impact of the Red Sea issue on the cost/potential delays. Results on Jan 29 should provide better clarity.
Disclosure: Invested and biased
Guidance intact wrt volumes and margins.
Usually bed linens does well in holidays and festive season across globe. Let’s see concall now.
Looks good.
5 Likes
Going by Vardhaman textiles ltd concall which happened few days back, home textile business has improved. They also mentioned that inventory level at customers has come down to normal level which is leading to increase in demand.
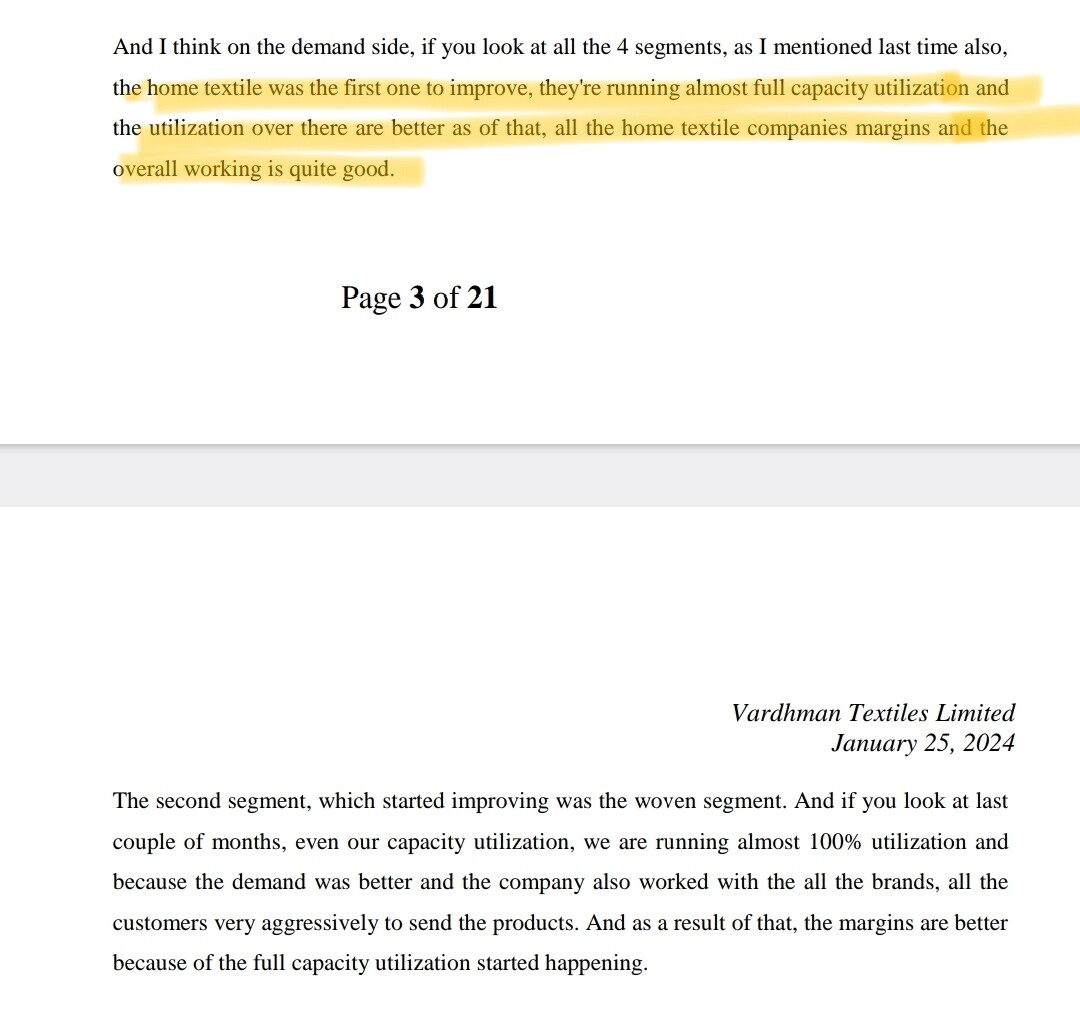
6 Likes
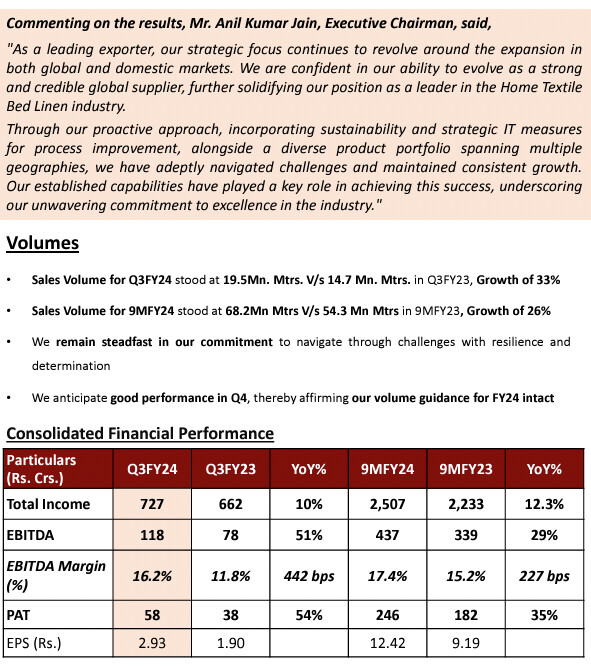
Q3 FY24 Quick Notes:
Revenue and Volume Growth Potential:
Company has achieved 33% volume growth in the Q3 FY 24 and achieved 26% volume growth in 9M FY24. So, volume wise company has shown good growth and company is confident of achieving the midpoint of the Volume guidance ie 90-100 million metres given in Q2 FY24. For the 9M FY 24 company has done volume of 68.2 million metres. So if company achieves around 95 million metres approximately they will do a volume of around 26-27 million metres which is a very good number. Company is confident of achieving because there are two big seasons for the company in USA, ie Fall winter(Q2) and Spring Summer(Q4).
Even though company has shown good volume growth revenue has grown only by 10% in Q3 FY 24 as realisations dropped by 18%. Company said decrease in prices of the cotton has contributed to it and company is of view that cotton prices will remain stable and makes them competitive in the international market. Realisations will also improve in Q4 due to product mix .
Company plans to double the revenue in next 3-4 years.
Indian players have only 5-10% market share in UK and Europe. Pakistan and Bangladesh enjoy 35% market share in these areas. FTAs with UK and Europe will help in improving market share in this geography.
Capital Allocation:
No major capex in the near term, since all the capex has already been done.
Company is currently focussing on Digital Transformation in partnership with Accenture.
Company is also focussing on Sustainability by developing solar power Plant.
Company plans to become debt free in next 3-4 years.
Margin Improvement:
Company earlier addressable market size has tripled by entering into Fashion, Utility and Institutional bedding in the last 3-4 years. In FY23 19% of the sales was contributed by these segments. Company plans to increase it to 30%. All these are value added segments and will definitely improve the margin. Currently China has 50% market share in this segment. China+1 and our recent Capacity addition in Fashion Bedding Segment will help in growing market Share here.
Red Sea issue impact:
Issue is only on cost side and not on Container availability.
Shipment time increased by 12-15 days.
Company has less sales from Europe hence will be less impacted.
11 Likes
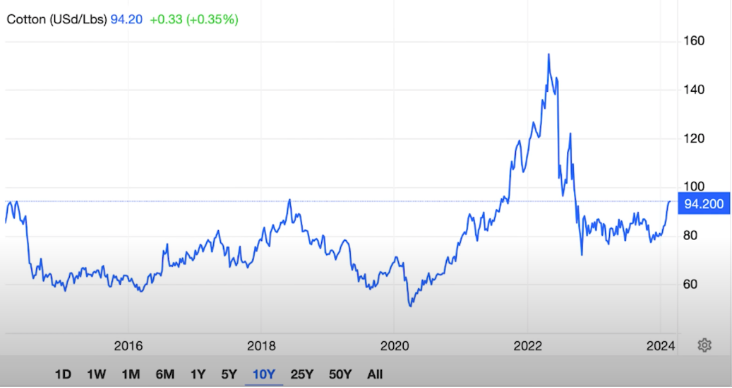
Nice Data. Hope Cotton Prices stay stable as 50% of total expenses is for raw material.
Added to Watch list -
3 Likes
Does indo count mimic the international cotton price’s
1 Like
Would Indo count benifit from EFTA. Pls share your thoughts.
1 Like
Indo Count Industries Ltd
Indo Count is one of India’s largest home textile manufacturer and exporters with an extensive product range, which spans across bed sheets, quilts and bed linen. It has a presence in top nine out of 10 top big box retailers in the US.
- Exports to 50+ countries, with US as largest market contributing to 70-75% revenue, company commands 20% market share in US
- They also have strong presence in Europe, Australia etc
- 97% revenue is from export and 3% from Indian market (
- Company is focusing on several D2C brands( direct to customer ) for Indian market
- Company has 4 Manufacturing facilities with ~153 million metres per annum
Investment Rationale
-
Company aims to double revenue in three-to-four years. It is focused on increasing the contribution from institutional bedding, fashion utility, e-commerce, and the domestic business.
- Revenue double on optimum capacity utilisation without incurring additional material capex.
-
The management expects demand in the US market to be better in FY25 as compared to FY24 and market to grow by 5-6%.
- The management is focused on the bed linen market, which constitutes 50% of the home textile market. It commands a 20% share in the US bed linen market.
-
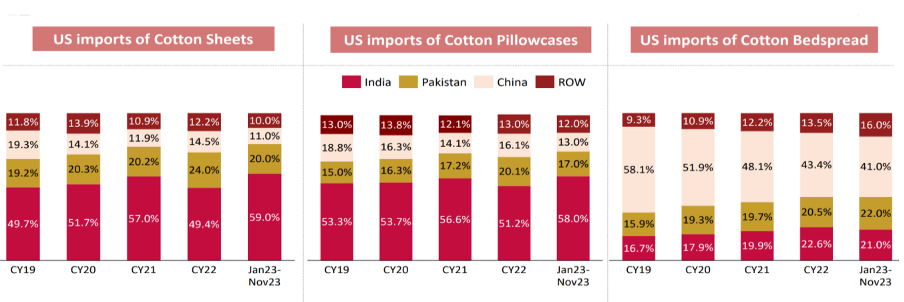
ICNT gains from the rising share of Indian home textile players in the US market driven by the China+1
- Indian exporters have gained market share from China due to the US ban on cotton from the Xinjiang region, higher manufacturing cost, and its focus on the domestic market.
-
The management is confident of achieving volumes of 90–100mn meters with 16–18% margin.
-
Greater contribution from value added and fashion bedding to 30% from 19% in FY23 and operating leverage will result in margin expansion.
- It has invested INR70cr with value addition in focus.
- It aims to raise contribution to 30% over the next three to-four years which will result in margin expansion.
- Premium products offer higher realisation (~20%) than conventional utility bedding. Capacity utilisation stands at 62%.
-
Company aims to grow the domestic businesses at an exponential rate and expects 10% contribution from the e-commerce segment.
- The management feels India’s market share can grow to 80%.
- D2C initiatives
- India grows into a 5 to7 trillion economy definitely the middle class is aspiring for better end good
-
Cotton arrivals in the market are healthy. Higher international prices are behind the recent run-up in cotton prices. The management said this run-up was driven by speculation and added that it doesn’t affect the company as it has hedged input cost till October.
- Focusing on increasing market share in non-US markets
- size of the EU/US home textile market is pegged at USD35bn/USD32bn. UK and Japan are USD5bn each.
- ICNT commands 7–8% share in the UK sheets market. It has a showroom and offices in the UK.
- New customer addition: Across Australia ,Japan and UAE
- EU - Pakistan and Bangladesh who are having 35% and 25%;
- signing of FTAs with Australia and the UAE and a higher likelihood of an FTA with the EU and the UK
- B2C & D2C Segments: Strategically moving towards B2C, B2B, and D2C segments with a focus on better margin and value proposition business.
- Experienced promoter in the home textile segment
- ICIL was established in 1988 by Anil Kumar Jain, Executive Chairman, who is a first-generation entrepreneur and has experience of more than three decades in the textile industry.
- He has been instrumental in establishing ICIL as one of the leading home textile export houses.
- Aggressive capex in last few years
- ICNT has expanded capacity to 153mn metres from 90mn metres.
- It completed brownfield expansion of 18mn metres in FY23 and acquired the textile unit of GHCL (45mn metres).
- Expected 17% volume CAGR over FY23–26 on market share gains in the US and healthy replacement demand.
- As a company have recently established and invested around Rs. 60 Crores in a fashion bedding unit
- Hence has adequate capacity to meet the needs of growth
- ICNT can achieve an optimum capacity of 145mn metres. It has a 76-acre parcel in Bhilad (Gujarat). It has utilised 38 acres and can expand capacity by 45mn metres to reach a total capacity of 200mn metres
o It uses 1.4lk spindles for captive consumption which constitutes 25% of its total requirement. - The company is investing in renewable energy to optimise energy cost.
- India’s cotton yield per hectare is 466kg and can grow to 600kg as efforts are underway to improve it.
- industry is growing at 7-9% and we are growing at 10 to 12% ahead of the industry.
- 25-30% Volume growth for Year , Margin guidance is 16-18% for FY24
Fundamental Analysis
Market cap = 7013 (>1000 cr)
PE = 20.6 < 43 industry PE)
PEG = 1.20 (should be < 1)
ROCE = 15.1%
ROE = 15.43% ( neutral)
D/E = 0.47 ( should be < 1)
CAGR sales growth 3 yrs = 13.1%
CAGR profit growth 3 yrs = 21.8%
EV/EBITDA = 13.4 (which is > 10)
Operating margins = 16.6%
Total reserves increased = YES
Total borrowings decreased = YES ( from 2022)
Total fixed assets increased = YES
Cash flow from Operations in Last 3 years (Positive + sequential growth ) = No, sequential growth
Net Cash flow for last 3 years (Positive + sequential growth) = No, sequential growth
Debtor days - reduced from 62.6 to 49.6
Inventory days - reduced from 238 days to 220 days
Days payable - increased from 40 to 61
Cash conversion cycle – reduced 258 to 224
Working capital days - slight decrease from 189 to 150
• Consistent growth of FIIs and DIIs and Stable Promoter holdings
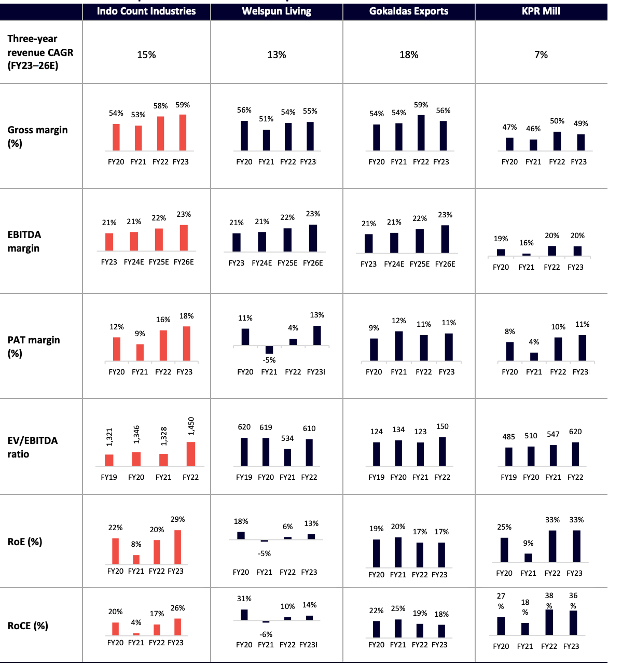
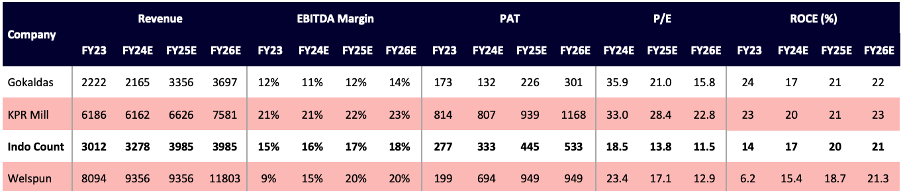
Peer Analysis
Segment Analysis
UK and Europe together around 15% of business on the revenue side
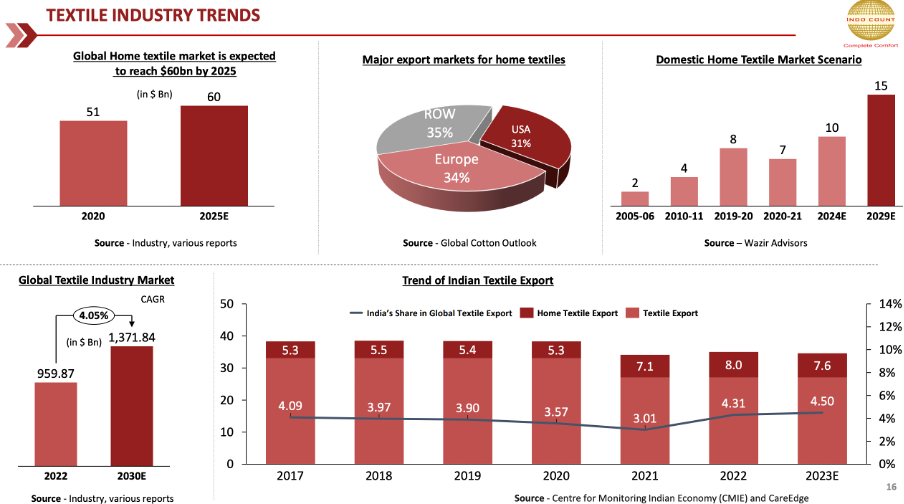
Market Growth
Home Textile Market: 2.5 billion dollar
Value Added Market: 11 billion dollar
Key Risks
- The Red Sea crisis has increased lead times to 35 days from 20 days. Challenges in global logistics
- Risk of product, customer, and geographic concentration
- ICIL’s revenue profile continues to be concentrated, with the top client contributing around 21% (PY: around 26%) and the top five clients contributing nearly 46% of the total sales in FY23 (PY: around 66%), although the risk is mitigated to some extent given the established and long-standing relationships with these customers
- Susceptibility to fluctuation in raw material prices and forex rates
- Raw Material accounts to 50% of total expense
- The company remains exposed to raw material movements and may have to absorb any adverse fluctuations in raw material prices.
- However, the risk is mitigated to a certain extent, as it mainly follows the order-based production policy, which minimises the raw materials and inventory fluctuation risk
- Being a net exporter, it is inherently exposed to foreign currency fluctuation risk
- Competitive industry
- The global home textile market is mainly driven by demand from the US, which is the largest home textile player. This demand is catered by countries like China, India, Turkey, Pakistan, Vietnam, etc.
- The Indian export home textile market is dominated by a few large players such as Welspun India, Indo Count, Himatsingka Siede, Trident, etc.
My Outlook on Indo Count
- Leadership in bed linens
- Management anticipate good performance in Q4, thereby affirming our volume guidance for FY24 of 90-100 million meter as compared to 74.7 last year
- Company is expected to achieve 90-92% peak operational capacity and double its revenue in next 3-4 years
- Benefit from China Plus one
- Premiumisation trend – better margins
- Expansion beyond US markets : Markets such as Europe, Australia, Middle East and in long term company reduce revenue contribution from 70% to 60% while US market will continue to grow , This reduction in contribution from US is expansion from other countries
- Expansion in Indian Market too – Through D2C brand , current revenue is 3% from domestic only – High scope
- Targeting revenue growth from 2.5% to 7-8% in the next 3-4 years from domestic business
- Focus on Digital Platforms: Across US, India, Middle East to grow its business –
- Reported 10% of revenue from e-commerce
- Expecting growth in this channel
- Enough capacity to meet 2X Demand – Current capacity 153 Million metre per Annum and Volume is 74.7 MMPA, Utilization Rate – 49%, Additionally can use Bhilad Facility to get 45 MMPA more capacity
- 50 crore Invested in Solar , which will increase the margins and reduce operational cost, Operational by Q4 FY24
- Stable cotton price: Price corrected significantly, that will help company margins
- Focus on Fashion Bedding and Institutional Bedding : As its more service oriented , hence more margin , the segment revenue growth is expected from 19-20% to 30%
- plan to have a target market of $11 billion
Stock is showing trend to grow in near term by an upside by 30%, As company achieves volume growth guidance in Q4 and show growth in FY25,
Disclaimer: Not yet invested, Planning to invest
16 Likes
How does it compare to Welspun? The company is expecting to achive topline of Rs 15000 crore by 2026.Currently it is at 9300 -9400 cr. Below is from Concall transcript
Dipali Goenka: So we are looking at a commitment to be towards the INR15,000 crores in 2026, we maintain that number and we will continue to look at maintaining our commitments that we have given
to the market.
Indo Count Q4 Export Update
Export Value: Rs 1123 up by 38.3 % YoY and up by 67% QoQ
Export Volume: up by 41.2% YoY and up by 21.6% QoQ.
Data from source not validated
2 Likes
Really no difference. I have been an investor in both, in the past, and while they track each other on financial and business metrics, Indo Count stock tends to have more momentum giving thrills with its sustained price moves. Welspun on the other hand is more sedate. It may get stuck in a range for many months, often giving false breakouts, testing investor’s patience.
1 Like