
UPDATE Added Equitas, Manappuram and Muthoot based on the requests from some members. Added relevent analysis. Added Tax Costs so that all costs % + net profit margin % should add up to 100. Added value labels for 2016 series.
General notes on the charts - Charts with shades of green - higher the better. Charts with shades of red - lower the better. Blue - KPI specific for the industry. END Of UPDATE
Peer analysis of listed and unlisted MFI companies using data extracted from Capitaline. I have also included Bajaj Finance and Capital First in this list as these are close to MFI than other NBFCs. Unfortunately, I couldn’t find numbers for Bandhan.
Size - Companies and the size of their balance sheet. Bajaj Finance is the biggest, Janlakshmi is biggest MFI. Bandhan is bigger than Janalakshmi but I am still collecting it’s data.

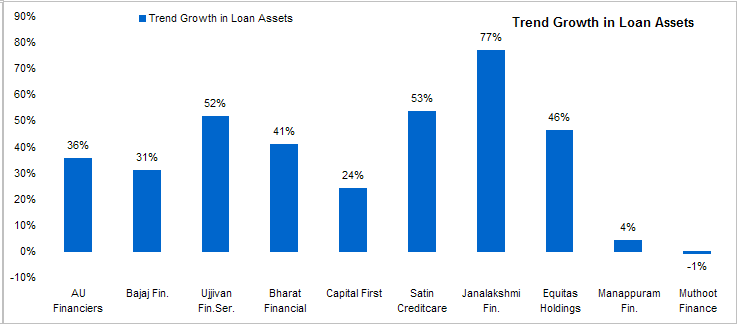
Growth rate of loan assets - Industry is growing after AP fiasco. Growth rates are impressive even for larger players. This number is the slope of a log linear regression line on the chart of loan assets over a 5 year period. This number is somewhat backward looking but I think it captures the long term trend rather than spikes and does not get impacted by base effect as in case of CAGR. Muthoot and Manappuram are growing again over last 2 years even though the chart show they are stagnant.
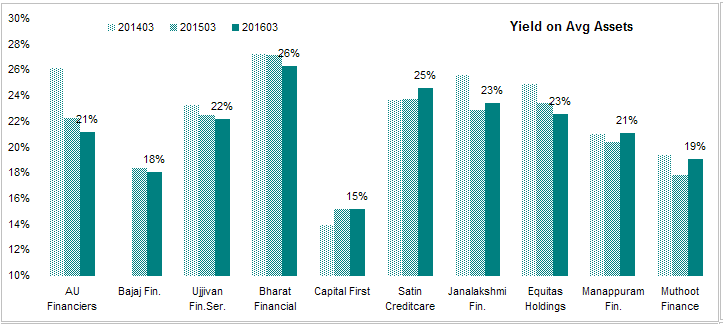
Yield on Assets - I generally classify lenders based on rates they charge as that determines profile of the borrower and risks. Bhrat Financial charges highest rates while AU is the lowest among MFIs. Bajaj is actually the lowest in the list. These rates are quiet high compared to banks, other NBFCs and HFCs but much lower than indigenous money lenders. Industry should take share from indigenous money lenders.
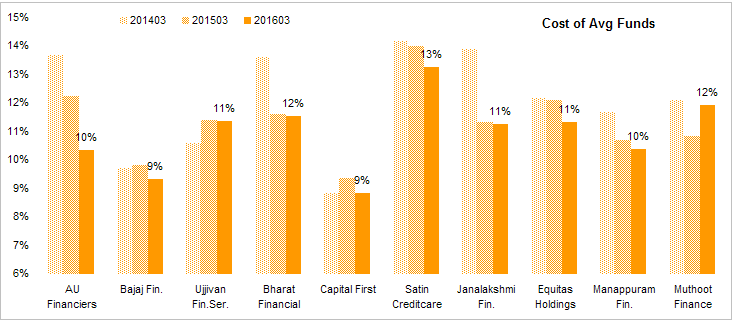
Cost of funds - Most important metric for MFI industry. This is reflection of confidence placed by funding sources on the business model of the industry. Some of these are backed by PE/VC funds as equity. Bigger MFIs have lower costs and that help them get even bigger. Sort of self reinforcing model. Bajaj with the strong corporate backing has low cost of funds. Capital First with with it’s well connected CEO has managed to keep it’s costs at the lowest level. these costs are low although not as low as banks or HFCs.
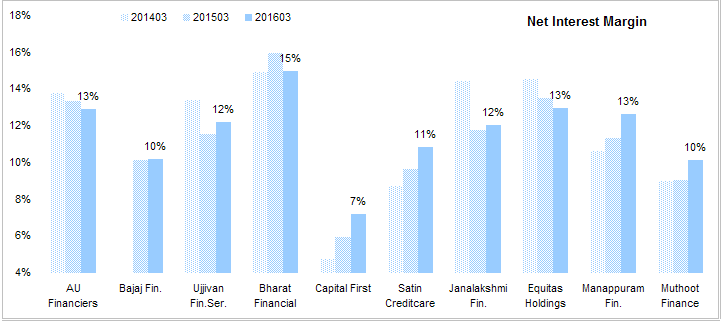
Net Interest Margin - Every bankers’ KPI. This industry has the highest NIM among the financial sector due to their high yield on advances. Capital First has lowest NIM despite having lowest cost of funds primarily because of it’s low yield on assets. Bharat Financial has highest NIM, legacy of the it’s predatory practices in AP. NIM appears to be inching towards average. Companies with lower NIM have seen it going up while those enjoying high NIM are seeing that advantage getting diluted. This is an indication that focus will now shift on execution rather than funding.
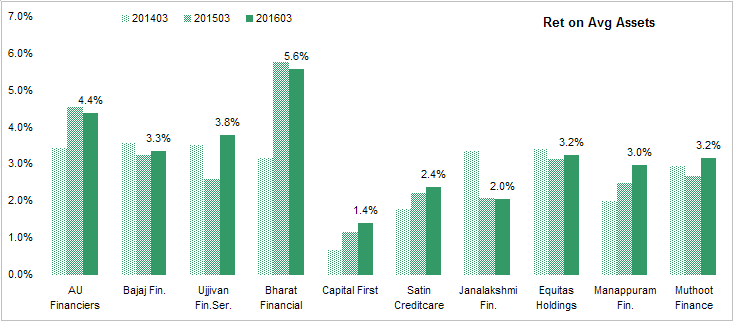
Return on Avg Assets - NIM tells only half the story as assets are funded by both debt and equity and NIM captures only the debt costs. ROAA is IMO the most important indicator for any lender. In cae of MFI industry, ROAA pattern is similar to NIM mainly because leverage is uniform across the industry.
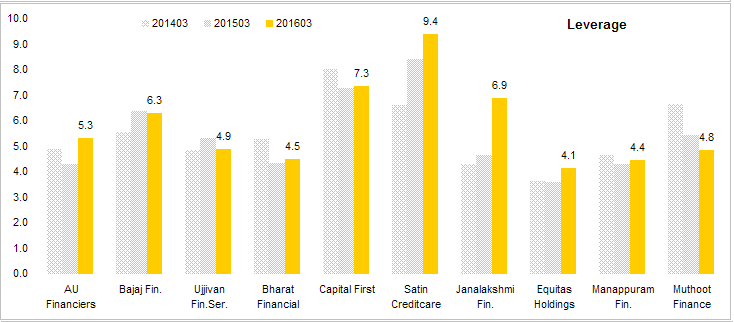
Leverage - Total Assets/ Total Equity. This is the most important balance sheet number from a risk perspective. Industry has managed to keep low leverage and capital adequacy above required minimum mainly because it has been able to attract equity funds from PE/VC/IPO etc. There is some room for leverage to grow but these companies are still being conservative here.
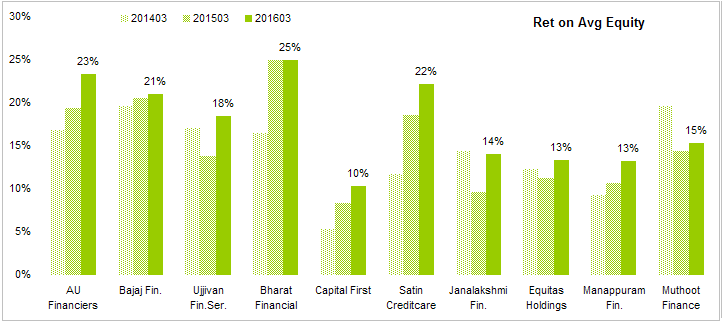
Return on Average Equity - Most important number from an investor’s perspective. The one number that sums it all. Bharat financial has managed highest number mainly because of it’s high NIM but as NIMs are reverting to averages, I am expecting this to fall. AU Financiers has seen a big improvement. Satin has high ROE but that’s mainly because of high leverage so not really impressive. Capital First isn’t even recovering it’s cost of capital.
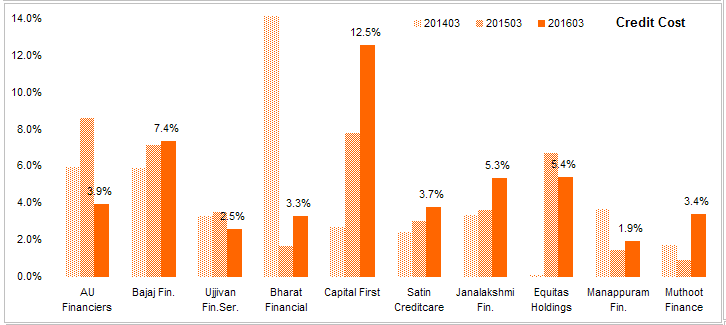
Next few charts compare the cost structure of the companies
Credit Costs - Provisions and write-offs as a % of total Income. Credit costs are low compared to Banks,NBFC and even some HFC which is surprising given the nature of the assets these companies have. Sometimes I think these costs are too good to be true but given the PE/VC backing of the industry, I don’t think these costs are misrepresented. Credit costs also very among companies in the industry with Capital First and Bajaj Finance having higher costs then MFIs. Apparently poor borrowers are more honest than the well-off who borrow from Bajaj to buy 70 inch TVs. Ujjivan is consistently lower than peers with AU Financiers making good improvement. No idea why capital first costs are so bad.
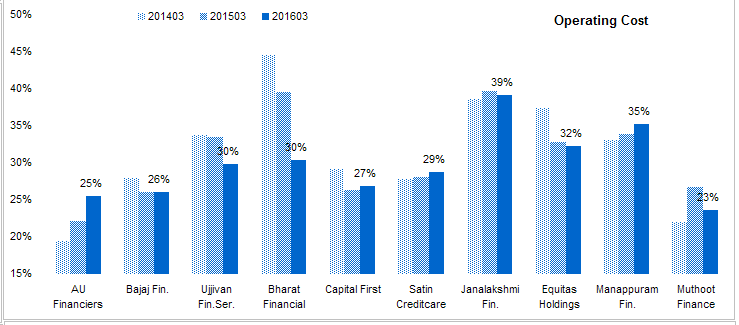
Operating costs - Everything except provisions, interest and taxes as a % of Total Income. Industry has high operating costs as ticket size is small. This is the cost of running the show. IMO, going forward, management of operating costs will separate wheat from chaff as SFB licence will reduce interest costs.
Bharat has made good improvement while AU’s lead is gone. Ujjivan is catching up but there is some distance to go.
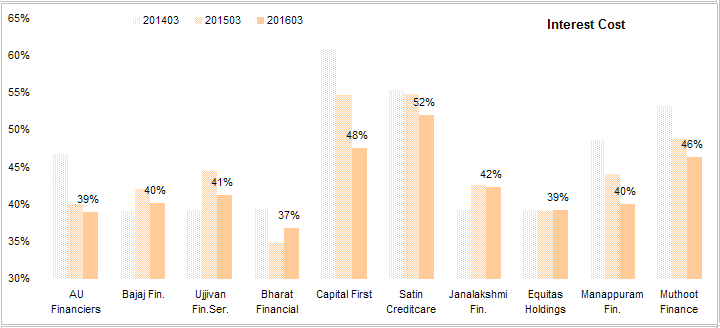
Interest costs - Interest Expense as a % of Total Income. Although capital first has low cost of funds, this is not able to earn high return on assets making it’s interest costs among the highest. Satin is small to it has high costs. Rest of then are close to average with Bharat having a lead here.
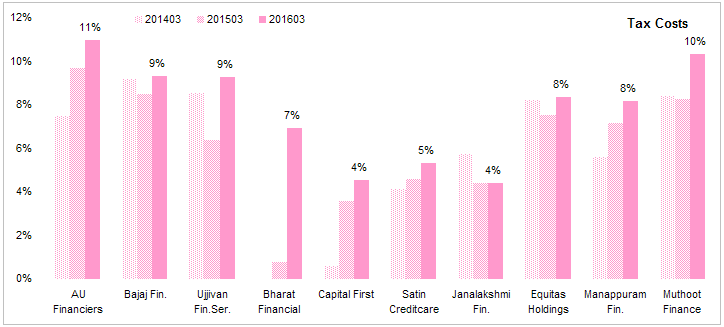
Tax Costs - Adding tax costs so all costs + Net profit margin should add up to 100% for completeness purpose. Any company with unusually low or high taxes should be checked as tax costs tend to revert to mean. Bharat Financial’s taxes jumped after tax loss carry forward from earlier years expired.
Net Profit Margin - The bottom line. This is what is left after all expenses are paid and provisions are made. AU and Bharat has made good improvement here.

Overall, I think Bharat scores well in many metrics while capital first scores low. However, I think Bharat’s advantage is shrinking. AU is making good progress but we will have to see how well it can replicate it’s success in Rajasthan in other states where will have to head-on with biggies in the industry. It’s IPO is expected next year. Capital First’s bad numbers are puzzling. Bajaj is doing good but very expensive valuation, perhaps a reflection of it’s growing franchise. Manappuram and Muthoot are growing again and well adjusted in a new restrictive regulatory environment.
Disc - Invested in Bajaj Finance.