Thanks @Yogesh_s. Yes, I include dividends while calculating NAV and sale and sub sequent purchases are also considered. Even I do calculate NAV almost daily (I skip if there are no actions).
I still feel there is some luck factor and I am awaiting a bear phase and see how I handle the situation. Once I am confident that I am doing decent, I would slowly move my MF portfolio to Equity. Also I have goal based tagging to my MF investments so I thought of not touching it. May be retirement part of that portfolio can be moved to direct stocks. I still feel timing could be the factor. I started off around 2012. So markets gave superlative returns since then. Let us see how things pan out in next 3 to 4 years.
XIRR and NAV returns are same when there are no cashflows between beginning and ending period. If there are cashflows between beginning and ending periods, XIRR and NAV methods will give you different returns.
NAV method gives you time weighted returns (TWR) or return to strategy. XIRR gives you money weighted return (MWR) or return to investor. Difference comes from timing and size of cashflows. NAV based returns are independent of cashflows. i.e. NAV returns does not change even if there large or small cashflows in the portfolio. This is the correct way for mutual funds to calculate their returns as they do not control when investors buy or sell MF units.
MWR returns take into account timing of cashflows. If MWR returns are less than TWR returns for the same period then investors market timing skills are not good as it indicate investor is generally buying after a positive return and liquidating after a negative return. Similarly if MWR returns are higher than TWR returns for the same period then investor has superior market timing skills as it indicates investor is adding cash to portfolio after a negative return and taking cash out after a positive return.
long term TWR is generally considered as return to strategy as it is the return you are likely to get if you continue to apply the same strategy in the long term. MWR return are the actual returns investor earn as it takes into consideration timing and size of cashflows.
Quiet often mutual fund earn a good return (TWR) but investors in mutual fund earn a lower return (MWR) as they are generally bad at timing the market.
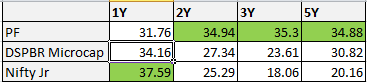
I have completed 5 years after restructuring my portfolio and tracking it based on XIRR and NAV method.
Here is the performance.
The portfolio has slowed down and is undergoing time correction and I am sitting at 16% cash. Normally I remain fully invested. I am finding it difficult to find attractive stocks as almost all of them are trading at exorbitant prices. I am finding it difficult to get past this phase of the market.
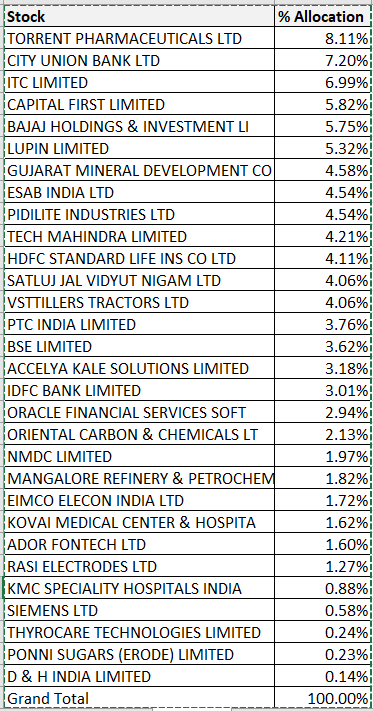
I continue having a long tail stocks which are either due to low conviction or valuation not attractive for increasing the allocation.
Top 15 contributes nearly 3/4th of the size and thus those stocks impact the overall PF Performance.
Well Balanced Portfolio Govind!
Can you provide the rationale for holding a investment company in your top stock bets specially Bajaj compared to other cheaper options available like Tata Investment etc.
Thanks Prasad. Bajaj Holdings has been a good compounder for me. There are a couple of reasons why it is one of my high conviction bets.
First is, it is a proxy to both Bajaj Auto and Bajaj Finserv. Secondly they do invest in other equities and bonds. As per the mandate they are supposed to remain a hybrid investor (Equity+Debt) in their allocation.
Promoters have been steadily increasing their holdings. Being a holding company, it is quite obvious that it is having nil debt and hoards of cash.
As per their annual report, they say their cash will be used if there is any business opportunities arise for Bajaj Auto or Bajaj Finserv which as an investor in BHIL, i would be more than happy to have that situation.
Thirdly, I like the stocks which are away from limelight still remain a decent compounder. This way you get to pay a price somewhat closer to their intrinsic values rather than overpaying or underpaying etc.
one example is City Union Bank. This has given almost the same returns like any other frontline private sector banks but lags the limelight…so I prefer silent performers and would not be comfortable with momentum stocks or market favourities. This strategy has been working well for me so far.
Currently my allocation is 83:17 (Equity: Debt). The allocation is determined by the market. Generally I believe that I need to worry about what I control and I dont want to worry too much about the things that are beyond my control. I don’t have any skill to predict growth rate, what management would do, what would be the GDP growth rate, where oil prices heading towards etc. Rather I would try to be more reactive and see what is the price I can pay with respect to the value offered by the stock market.
Now coming back to the asset allocation, it is determined by based on the attractiveness of the stocks at a particular point in time. If none of the stocks are cheap or in my buy range, my monthly installment stay in cash. if something comes cheap, I end up deploying my cash. if I see a stock which had run up a lot, then I sell it and cash component increases irrespective of the market condition.
Like I explained in my portfolio thread, my source of money is my salary. So I can do SIP sort of periodic monthly investment. Once I had built a portfolio, I can add the delta amount every month based on which of my stocks are cheap or any other new stock has become attractive where I can initiate a position. There would be times when I get opportunities to switch from any existing stock to new idea completely in one shot. All those decisions will be based on level of attractiveness in the new or existing opportunity that I have and fully priced nature of any of my current holdings etc.
By this process, I keep reviewing my portfolio every month and take actions if required. Diversified nature helps me to ride volatile phases and I am dependent on my alpha generation based on stock picking and timing and patience.
Unless one is very skillful and astute stock picker who can be swift in changing portfolio and predict trends and growths, sticking to one investment philosophy and being patient will help you to be successful.
Disclaimer: Please take my point with a pinch of salt. I am neither an expert nor have been proved 100% right on all my investment decisions . I am happy to share my points as it helps to me learn from fellow investors.
@govindarajanv, according to value research, a SIP started from Dec 2013 till Jan 2019 in DSP small cap regular (G) shows a return of 10.48%. Could you please elaborate how you arrived at 20.11%?. TIA.
My bad. I calculated from 2013!. Infact from 13 Dec 2012 it shows a resturn of 16.25% if investment is done in SIP. Maybe a lumpsum ammount may give the returns that you mentioned. If you could clarify that would be great. Thank you
Yes Mahesh. I have calculated for the lumpsum. Other way is to calculate, is to mimic every investment i have made into my PF and see how much XIRR the fund would have given but for the sake of simplicity, I opted for point to point returns.
Power of dividends, yield on cost has grown from 1.4% in 2012 to 7.46% in 2018 though this includes some special dividends and I have also added some high yield stocks recently but if I discount those special cases and based on past payout, 55 paise would have been the fair dividend amount for 2018. I got inspired by ‘TIP’ guy who used to run a blog that focuses on dividend growth investing. I am quite sad that he is no more active in his blog.
It would be appropriate if we use XIRR method for calculating the return. Don’t get confused with dividend cash flows, they are not going to make much difference in your CAGR because small annual cash flows compared to invested capital. You can use value researchonline for tracking the return of the portfolio. Just register every transaction and brokerage charges. I am sure you will be surprised by knowing the returns.
Yes I do evaluate returns using both XIRR and CAGR as mentioned in my older posts.Dividend growth rate can be used as a proxy to validate whether it is in sync with Capital appreciation which is one way (not a fool proof way) to check whether your cagr is a result of RE-rating or improvement in the fundamentals of underlying business in the proportionate weightage.

 . I am happy to share my points as it helps to me learn from fellow investors.