
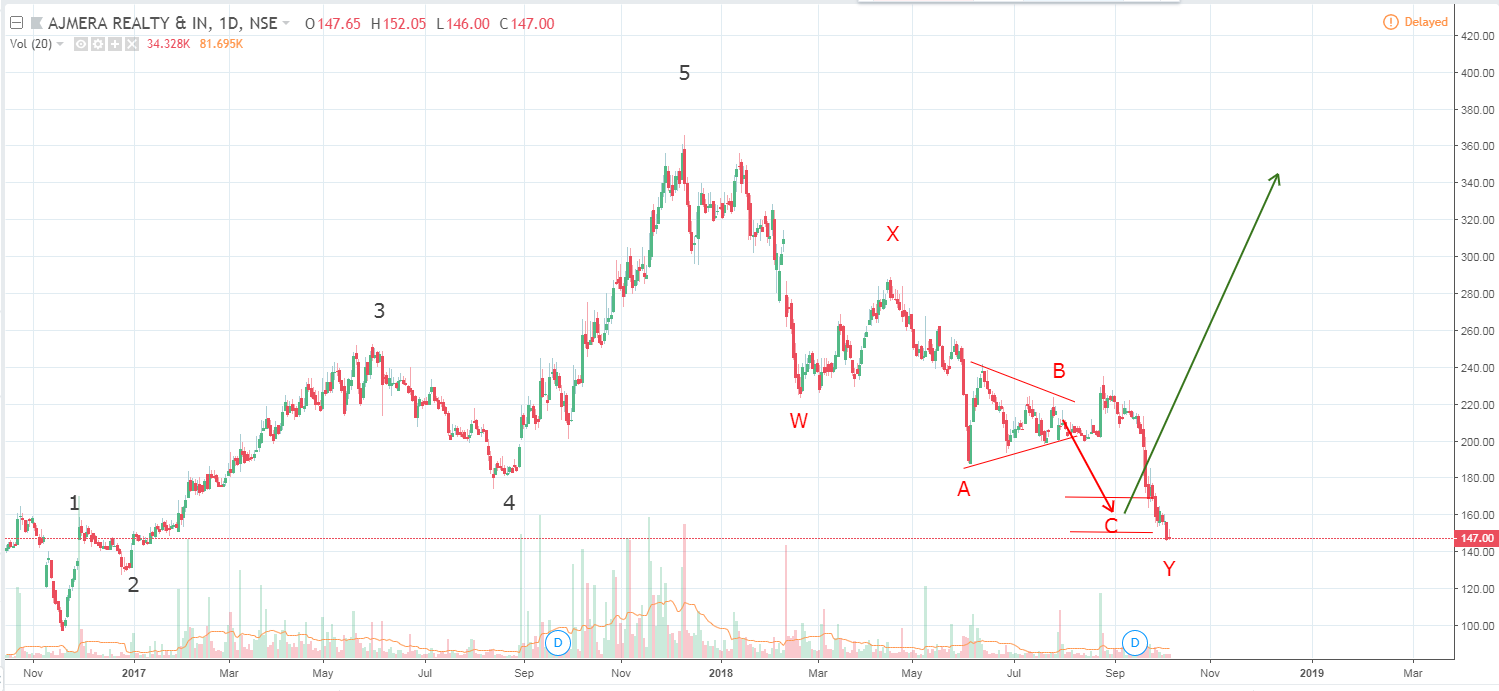
It was indeed a fake break out. After that it broke down and reached the target for the symmetric triangle at 149. Couldn’t read into the subwaves, so there may be more downside in this subwave C of wave Y, but it has reached the target for the symmetric triangle.
2 Likes
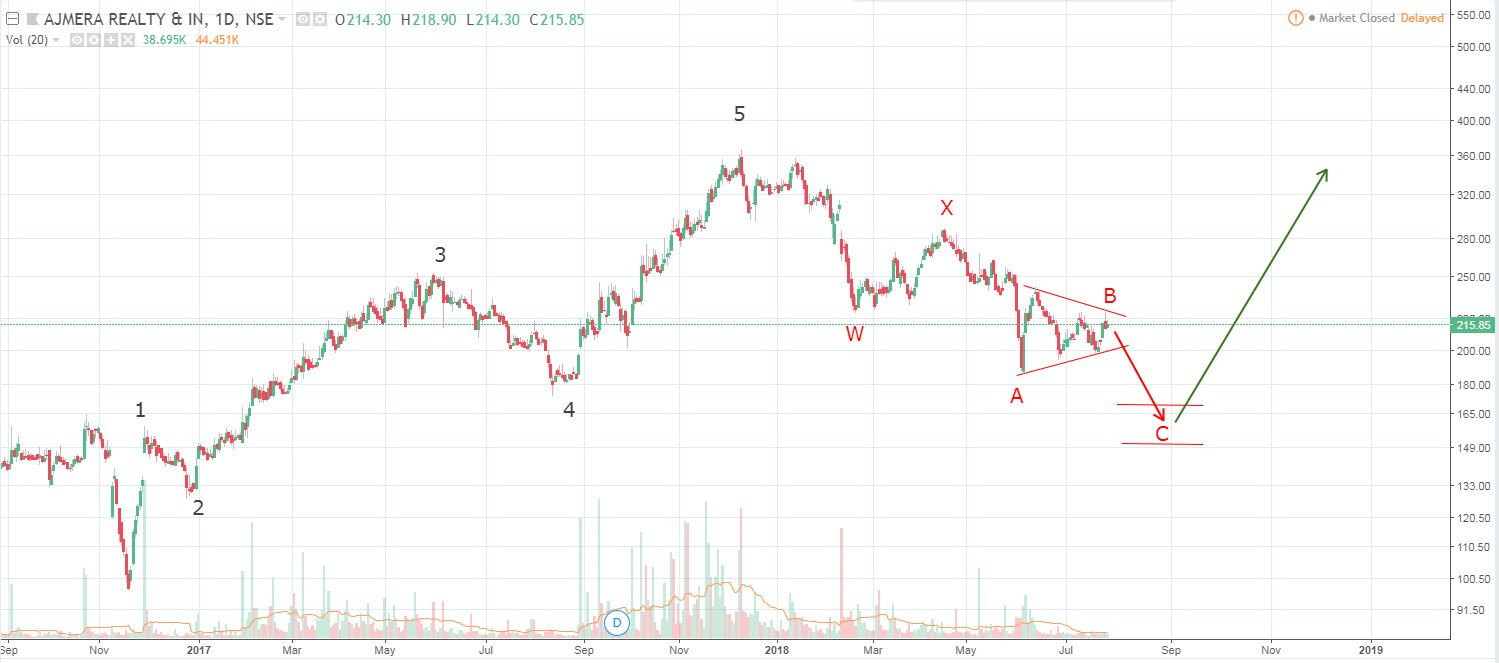
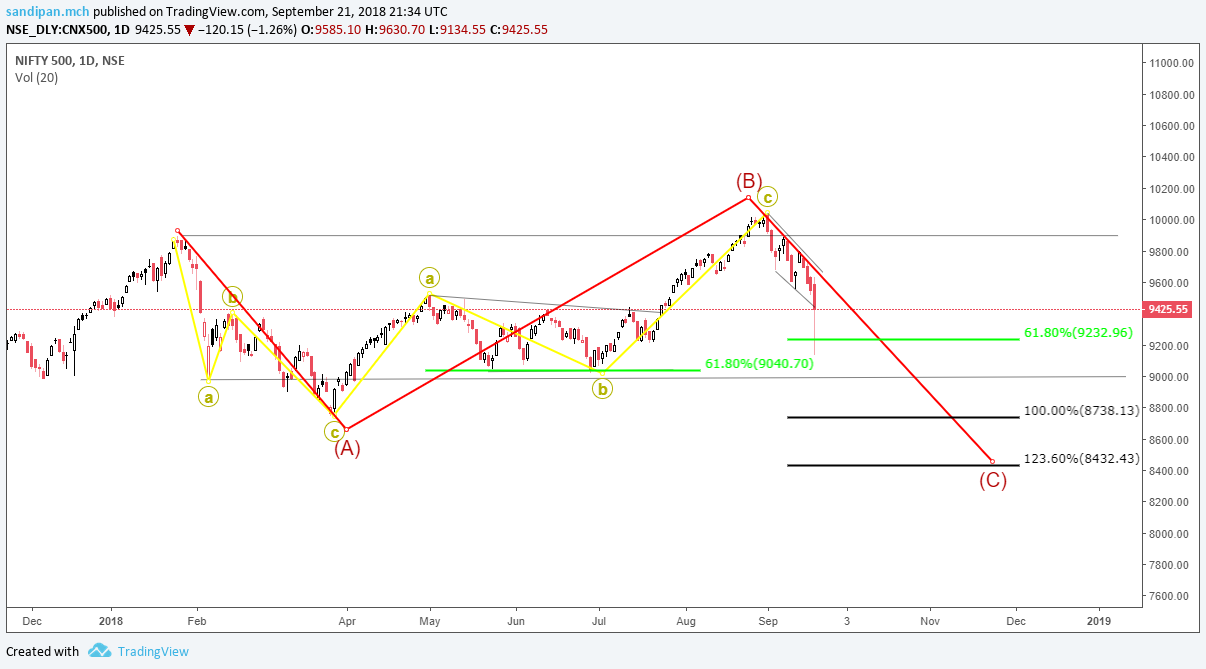
Presenting here what I think coincides with @PE_Ratio’s wave count.
I feel that a clear 5 wave upmove finished and now we might have experienced a violent (5 poorly defined waves) A wave down. If the A wave has finished then we could see a B wave up. How long it goes on and how high it goes up needs to be seen.
4 Likes
Hi Hitesh, IMHO, There’s a lack of 5 sub wave structure between 4 and 5. That’s why I was sticking to conclusion that there’s a last leg of rally left, before it actually starts the correction.
In my opinion wave 4 is undergoing an irregular correction with wave B completing as abc around alltime high. Now we might be progressing with wave C. These C waves usually turn out to be scary.
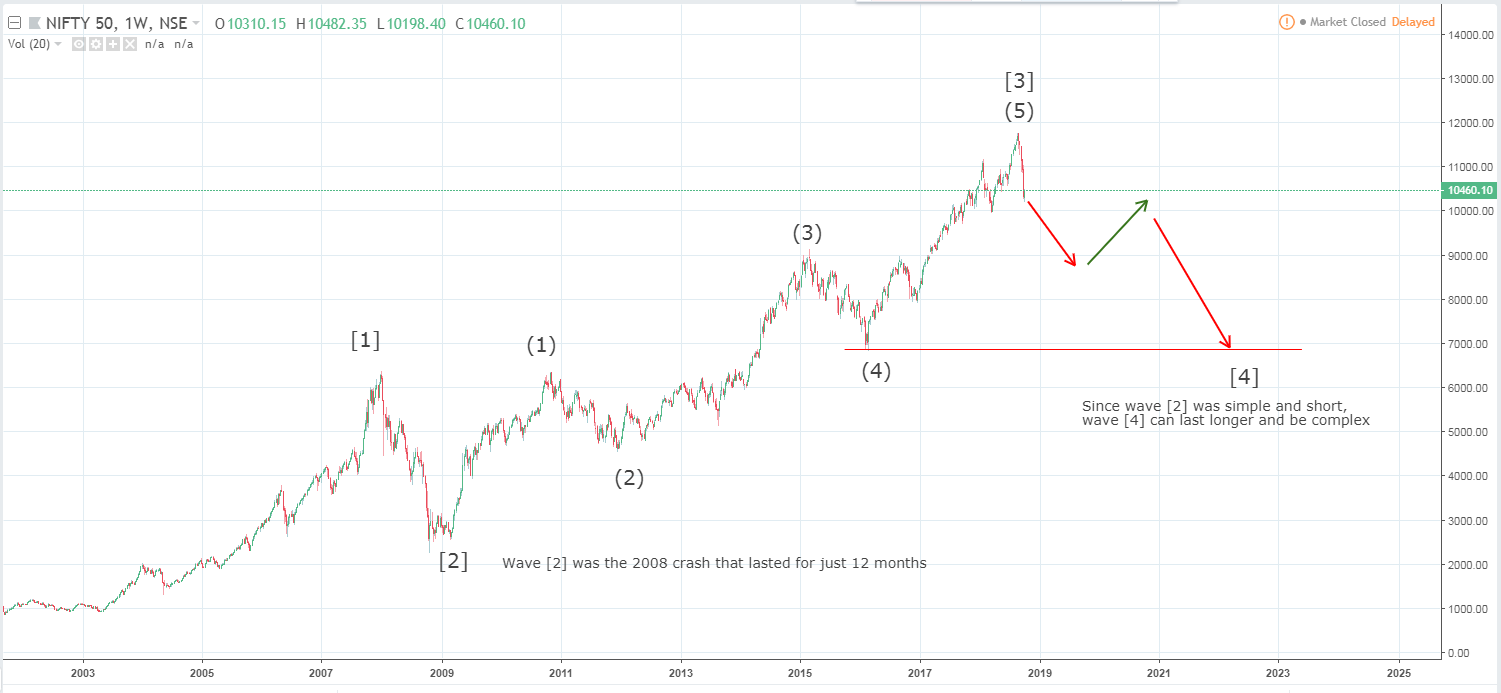
As we saw a simple wave 2 consuming less time, wave 4 usually turns out to be more complex and time consuming. If this is the case, final wave C might take out 9951 lows. The next leg of rally might be quick because irregular corrections usually show heavily bullish sentiments.
Its hard to count internal waves in this C wave but seems like today’s bounce might be smaller wave 4 which can again turn out to be complex.
I can be totally wrong as well. 
1 Like
I’d mark wave (4) differently. Like this.
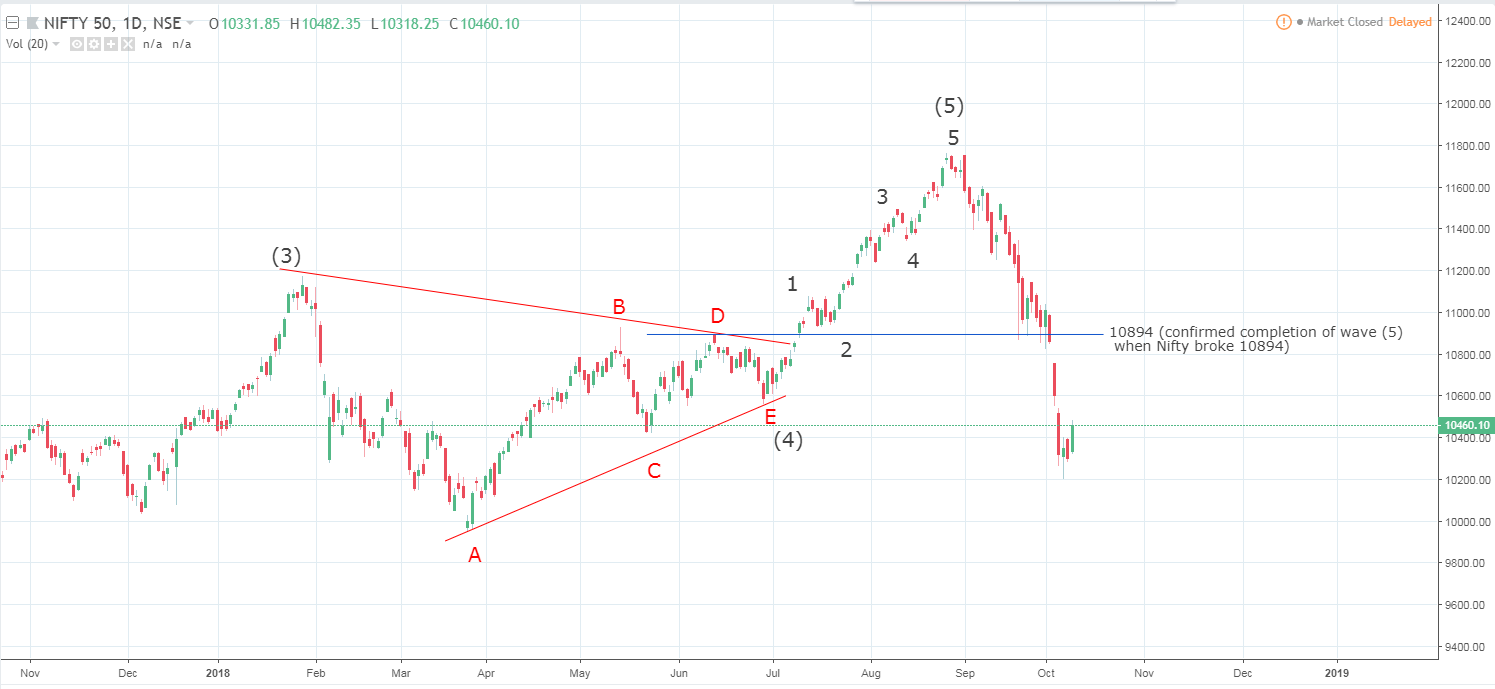
EW rule: Usually triangles appear in wave 4 or B. Here it fits perfectly.
And wave (5) also seems to be a perfect 5-wave one.
If Nifty had not broken 10894, I’d have marked
A as (4)
B as 1
C as 2
D as [i]
E as [ii]
(5) as [iii]
and if Nifty had not broken 10,894, I’d have marked that low as wave [iv] and then the move up would have been in wave [v]. That was my early EW count, which projected target somewhere between 12500 to 13,000. But when Nifty broke 10,894, this count was no more valid. And the only other count that looks valid to me is the one I’ve posted above.
2 Likes
I think the character of a downwave A on an A B C correction fits the current downmove perfectly. A waves are usually scary and violently down and dont offer any major chance to exit till it finishes and Wave B up begins.
My bet on a wave B would be a kind of weak stop start kind of rally which might be more stock specific.
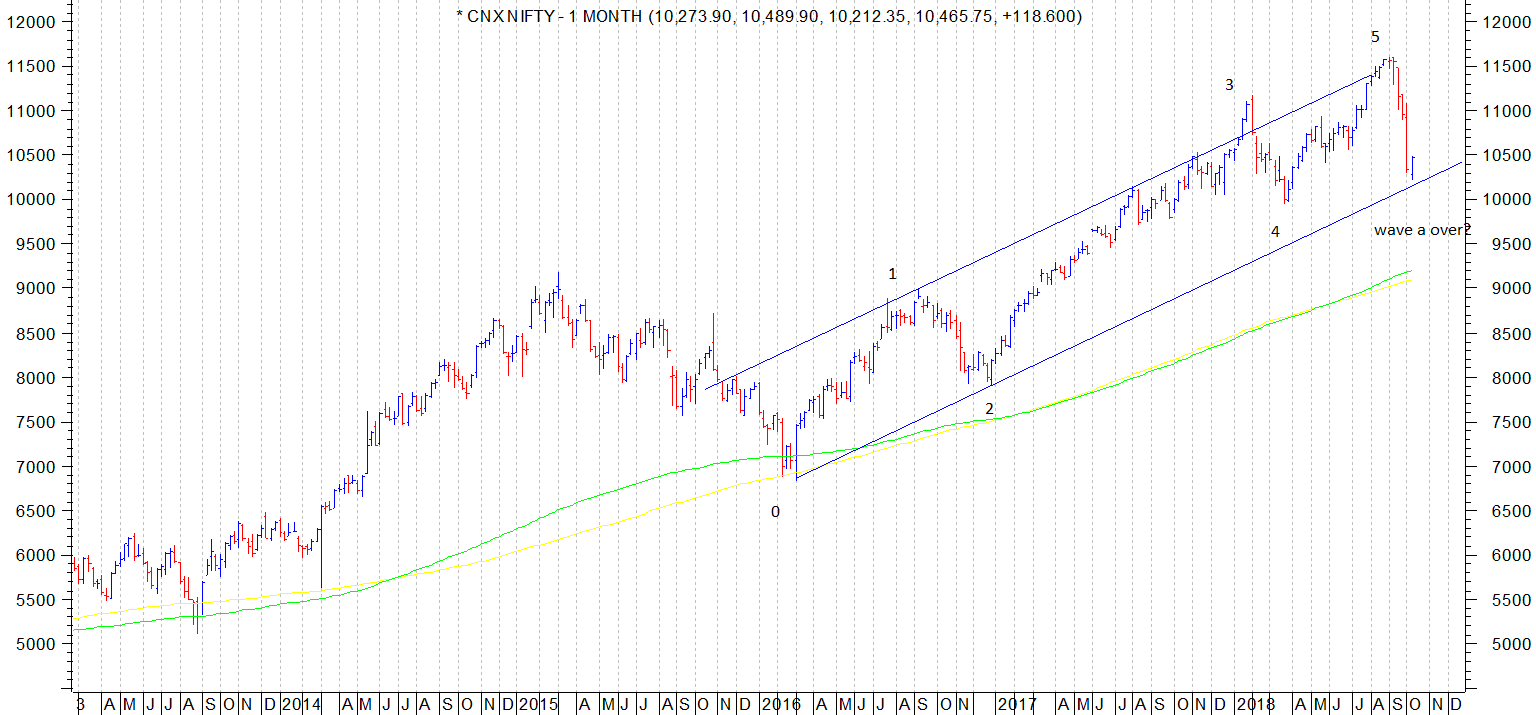
Here, we’re only looking the completion of five waves up in the inner degree. And the scary thing is that Nifty is completing fives up in the outer degree also, so the correction will be huge. If it corrects up to wave (4) of inner degree levels, it may crash to 6800. With US indices starting to crash, the probability of Nifty going below 7000 is also very high. Wave [4] can be a complex correction and last longer as per the rule of alternation.
I don’t know about technicals…but 7000 if at all we get there will it not be once in a decade opportunity to build solid portfolio of bluechips?
1 Like
The market is definitely going lower as all indications point to this one after 10 years. The levels it might touch can be so scary that the posting on this blog also will become negligible. Howards Marks in his latest interview opening quote says" You can’t predict but you can prepare" . I don’t know how many of us are!
1 Like
At this stage, 9000-9500 looks like a high probability event. Nifty going near 7000 requires a unique turn in a set of future events which may or may not occur.
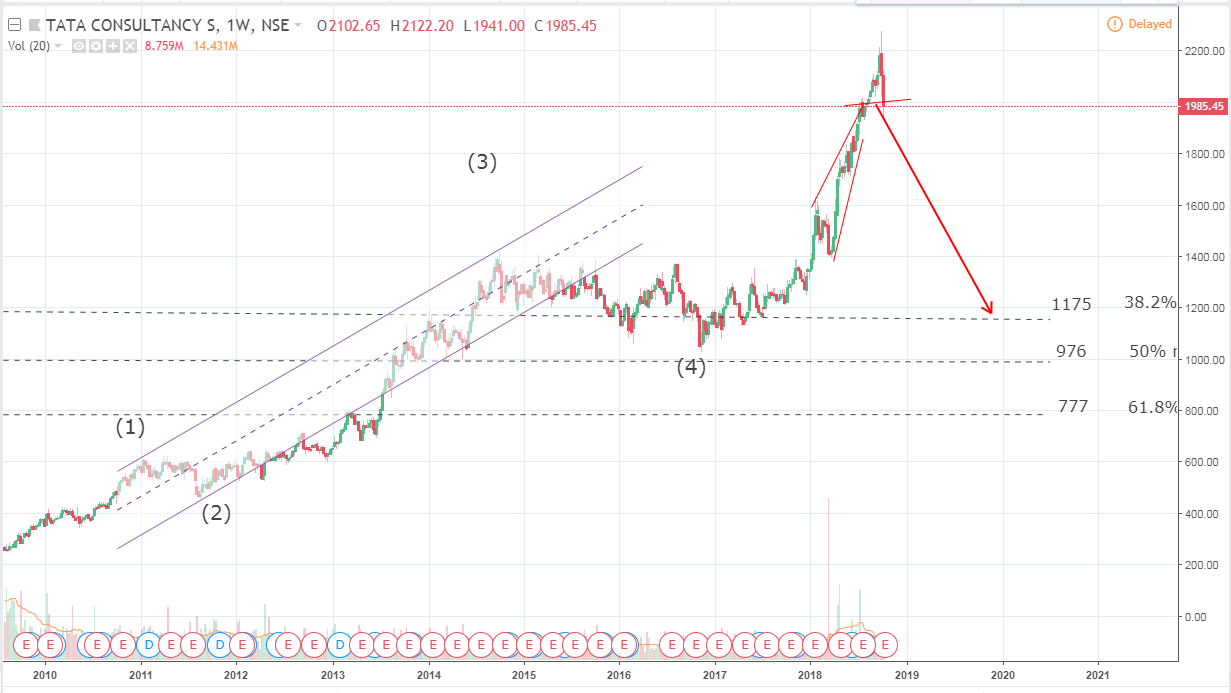
High-weightage Nifty stocks like Reliance, HDFC Bank, TCS have just completed 5 waves up and started correcting. If you look at their charts, you’ll totally believe 7000 is possible. 50% retracement of wave Nifty wave [3] will end at 7000 too.
If Nifty doesn’t go through price correction as above, but rather time correction, then it should end somewhere around 8100, which is 38.2% retracement.
But why should wave 4 retrace 50% or eve 38%? According to your wave count, TCS has completed 5 waves. I guess according to your wave count, TCS completed wave 3 in second half of 2014 but did not see a huge correction thereafter. From about 1400 it went to about 1100 - a roughly 20% drop. Again its probably futile to say this because there is no science in it but a dip to 9000 over next 3 years - i.e., a relatively shallow but prolonged correction (as opposed to sharp and deep in wave 2) is what seems more likely. Why do you think Nifty must correct at least 38%?
When a wave completes, you can use channel or Fibonacci ratios to project target.
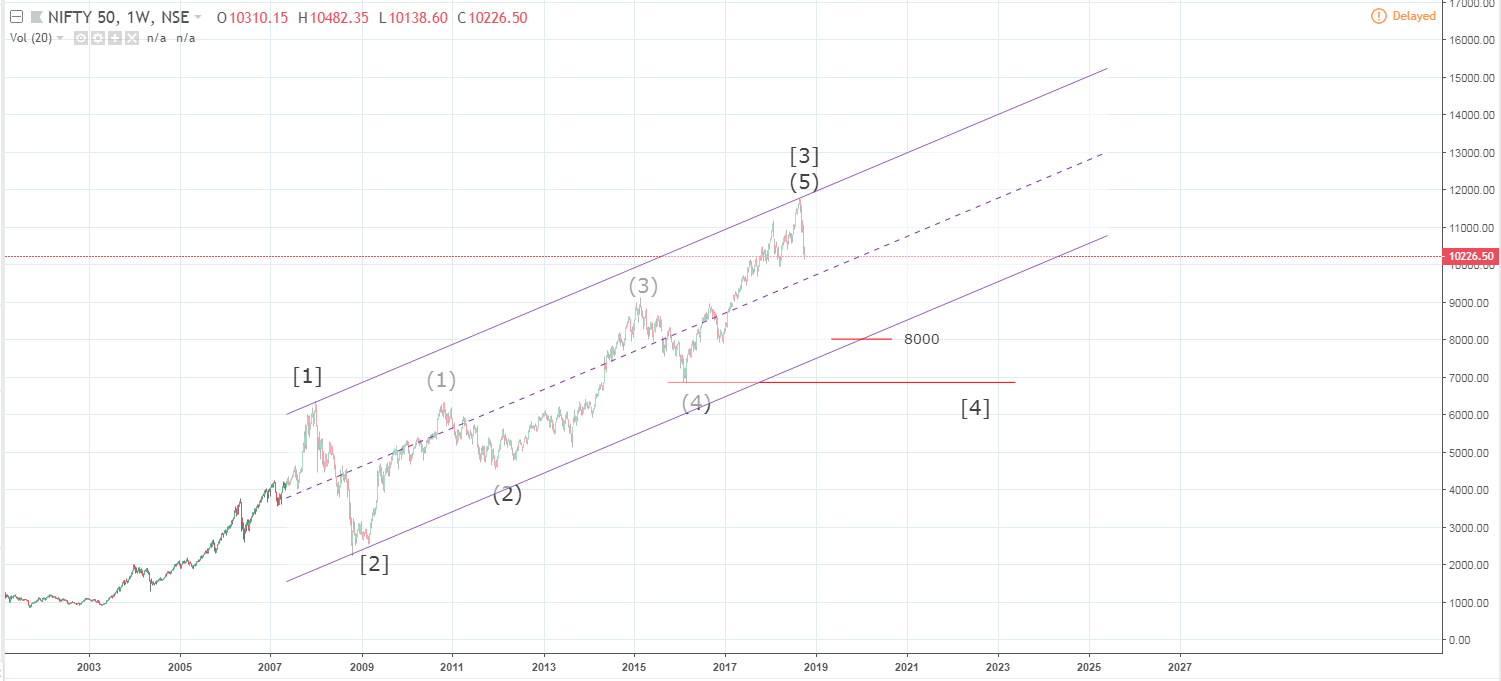
If you look at the Nifty channel, it looks like a hefty correction is set to take place. If it corrects for 1 year, you see the channel support is at 8000.
According to EW, minimal target is up to the end of the channel. This wave usually breaks the channel. So, below 8000, and even 7000 is possible. But if it goes through time correction, it may stay well above 8500/9000 and then move flat for years.
On your question on TCS, look at the channel. Wave 4 broke the channel and corrected for 2 more years. Though wave 4 retracement was minimal, it was according to the channel guideline.
That’s why I think Nifty should correct at least 38.2%. But then it’s just a guideline. Nothing is holy grail.
2 Likes
Thank you all for the technical analysis provided. @PE_Ratio, @Capsule91 Considering most of the charts are showing weaknesses as per analysis above, I would like to understand what strategy you adopt for portfolio allocation. Is it 50% invested, 20% short/sell, 30% cash or you plan to be in more cash based on some future trigger in charts?
Considering a range of around 9000 or so for the nifty as a fair range to buy there still seems some way to go for markets. 9000 and nearabout range is important because it had earlier been a perennial resistance for many years beginning 2008 till the breakout happened and the indices broke out to form a new high at around 11700. Usually once a strong perennial resistance is broken a pop up of around 30-50% is seen which seems to have completed at nearly 30% pop up level of 11700. Now going forward the change of polarity principle indicates that the earlier resistance of the region of 9000 could be a support on declines. Now this 9000 is not etched in stone. It can be in the range of 5% plus or minus this level or even more. But for purposes of a working hypothesis this can be considered a region to watch for support. If it doesnt hold then we might have to brace ourselves for the levels indicated in the earlier Elliot Wave counts put up by PE ratio.
Coming to the headwinds to watch out for, currently we are experiencing these in form of high crude, weak rupee, NBFC fiasco and so on. Now with global indices perched precariously, it could add to a heady cocktail of headwinds.
In such a scenario if one does want to be brave, then those who dont believe in technicals should look out for businesses for strong business visibility for atleast next 2-3 years with minimal variables. Especially minimal effects of crude, rupee levels, election outcome etc. And prepare a list of such companies and decide the levels to buy and then buy but very gradually in small lots.
The most ideal thing to do of course is to park funds in fixed income instruments and take a vacation or stay away from markets till some kind of sanity prevails. The problem of holding cash is that the urge to piss off the cash is very strong and often leads to buying poor businesses which usually correct a lot in such circumstances. The other problem is of getting paralysed by market levels at exactly the opportune time when the time is ripe to buy.
The ideal thing I think is to go by the buy list and keep buying in a staggered manner and try to build a portfolio of strong businesses with a lot of tailwinds for next 2-3 years and hope to get lucky with the stock picks.
18 Likes
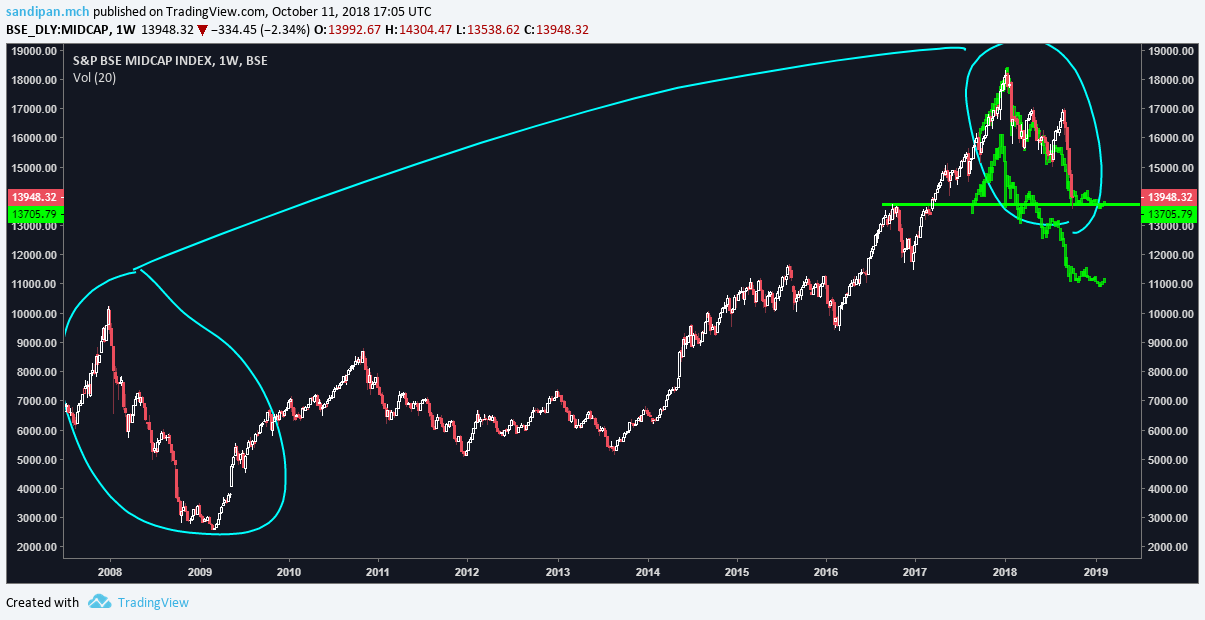
just an add on to @hitesh2710 sirs conviction of a good support around 9k…
one of the elliot wave possibility i have is this one, where the whole post 2008 to 2013 was a wave 4…
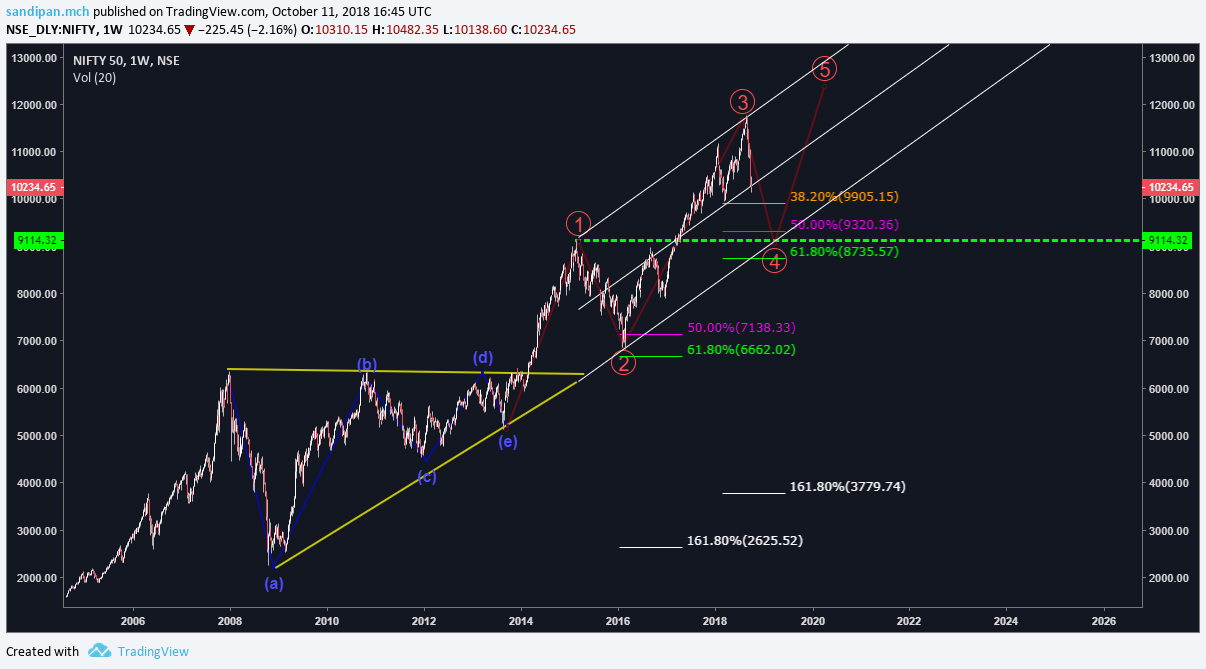
i find a wyckoff reaccumulation structure there, which is very common in wave 4 , and post that, the markup happened in phase e, which was totally impulsive, which sir calls as…
so i feel this is subwave 4 in nifty ongoing of wave 5, and the lowest it can go without invalidating the count is 9114 exactly, considering this as a possibility…
i once had a doubtful idea this could be a expanded flat correction of subwave 4 of wave 3(subwave 5 is not not done in that case) ongoing in nifty, since the small n midcap counterparts, were not impulsing at the same time and doing wave 4…
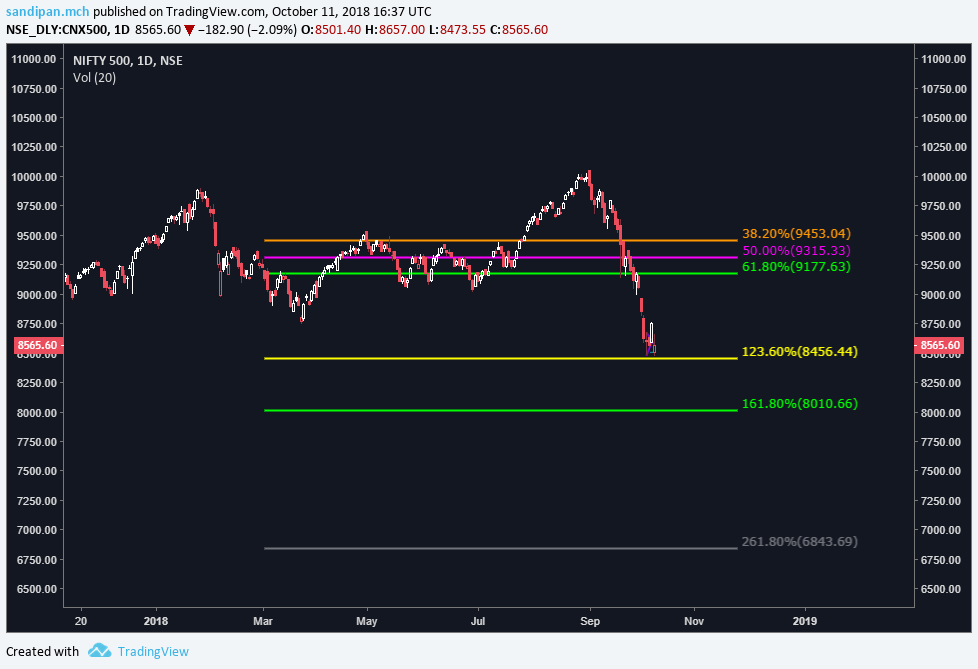
the N500, has come to a very important level in fibo series, now…
this might be interesting… so many stocks grossly oversold…
and as i was saying a couple of days ago… i am feeling more relaxed in the longs in day trades this week than the shorts… and actually making more profits in th elongs compaed to the shorts, and more no of shorts have hit the stoplosses…
the selling might have temporarily calmed down…
2 Likes
aurobindo pharma has been reacumulating it seems, but it has got a lot of resistancein the higher 700 region, dont know how the operators will manage to get the sellers out f there, or they themselves are selling there…
presently the price action has resistance from the gann arc, and the green line is the gann master 1x1 fan… which has been a support after breakout in august…
meanwhile i heard hdfc gave a buy reco with accumulation in the 680 range…
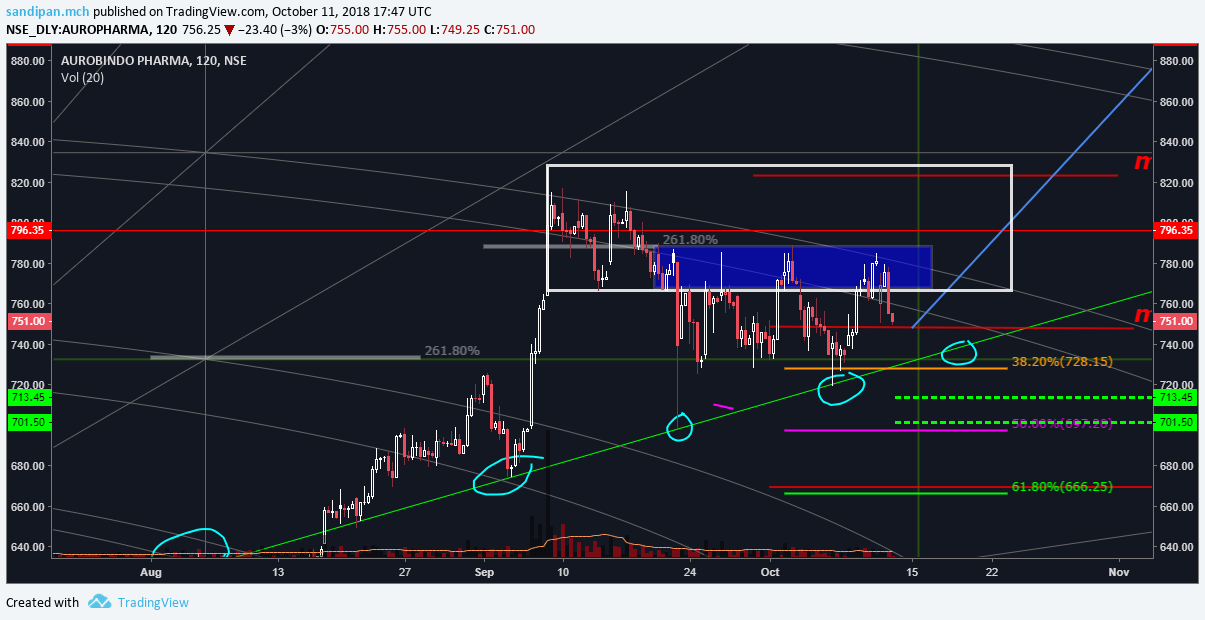
the lower 700 is where the 50day moving averages are …
i did a video analysis of this chart a couple of days earlier in trading view… sharing it here…
disclaimer… not current position, intersted
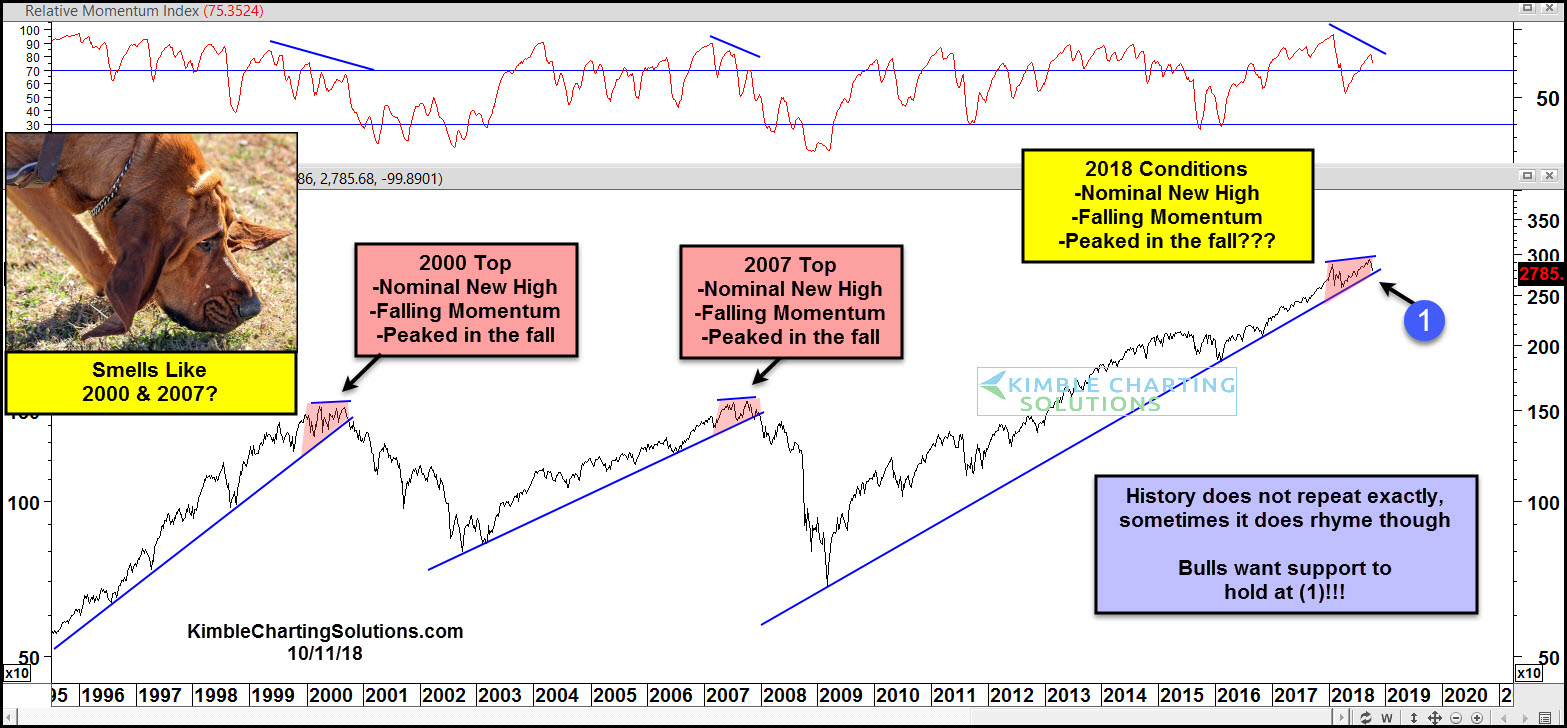
The major corrections which are Happend During 2000 & 2008 is having some characters which are missing for this crash as per my observation
-in 2000 before the crash in just 4-5 months most of IT scrips are rised 2-3 fold valuation are very high for those scrips from 100-150 pe. And it was happened globally
-Where as also in case of 2008 before crash in 2007 from August to 10jan 2008 all Scrips are more than doubled market was rised around 40%in matter of 4-5 month, market was highly leavraged in f&o by retailers, and global crash, sub prime etc
-In current market all above points are missing broader markets is already 9 months in correction. If earning improvement along with crude Softening happens we may see market rally in next few months in broader market
3 Likes