
Perfect, matches my point and figure count…
1 Like
KIOCL
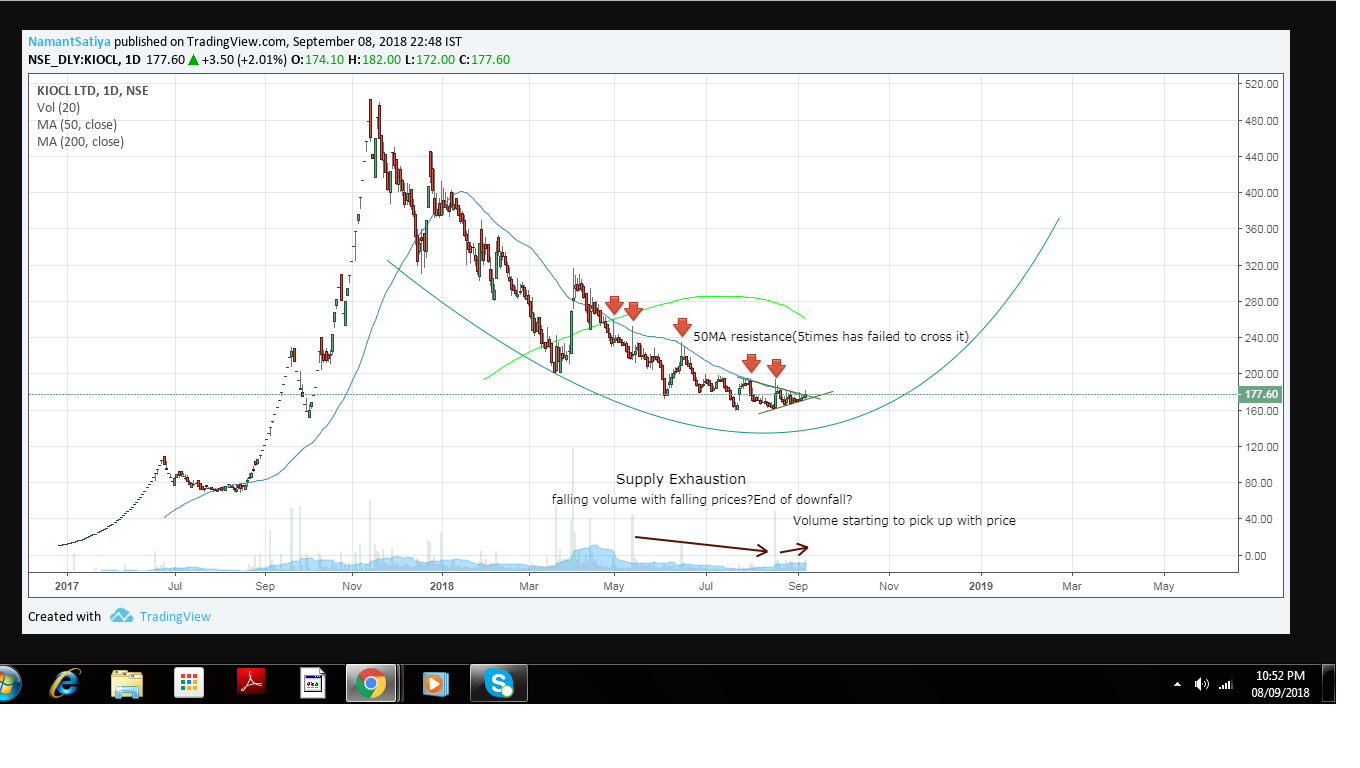
Looks like a case of base formation.Has been facing stiff resistance by 50MA(have marked the instances on the chart.Volume on fall has reduced drastically and now looks like all supply has been absorbed.To me looks like accumulation is going on and it is read for a change of trend.Some volume pick up can be observed.As of now 160 looks like a solid bottom.
Looking for fundamental triggers for change in trend to be supported.On friday buyback news of CPSE companies has come out which can support price.Other fundamental and technical criticism is welcome.
@Capsule91 @phreakv6 @manivannan.g your views would be appreciated.
Hey Sorry to ask this questions… As Ian biw to technical analysis…
How did you guys manage to get theae charts… Do you guys subscribe any website… If yes can you let me what s it…
This is the share price chart u get on google search. Type in ‘cyient share price’ on google and u will get a chart.
For other charts see tradingview.com
1 Like
Sure will try… Since I new and its really exitinting to learn all these things… thx hari
Is some one tracking charts for Ashok leyland, lupin, ajantha pharma, aarathi drugs, everest industries and thyrocare tech…
whats the charts looks like for these…
I should rephrase and say that this could be a probable base formation if the fundamentals are also changing. No idea on the fundamental story.
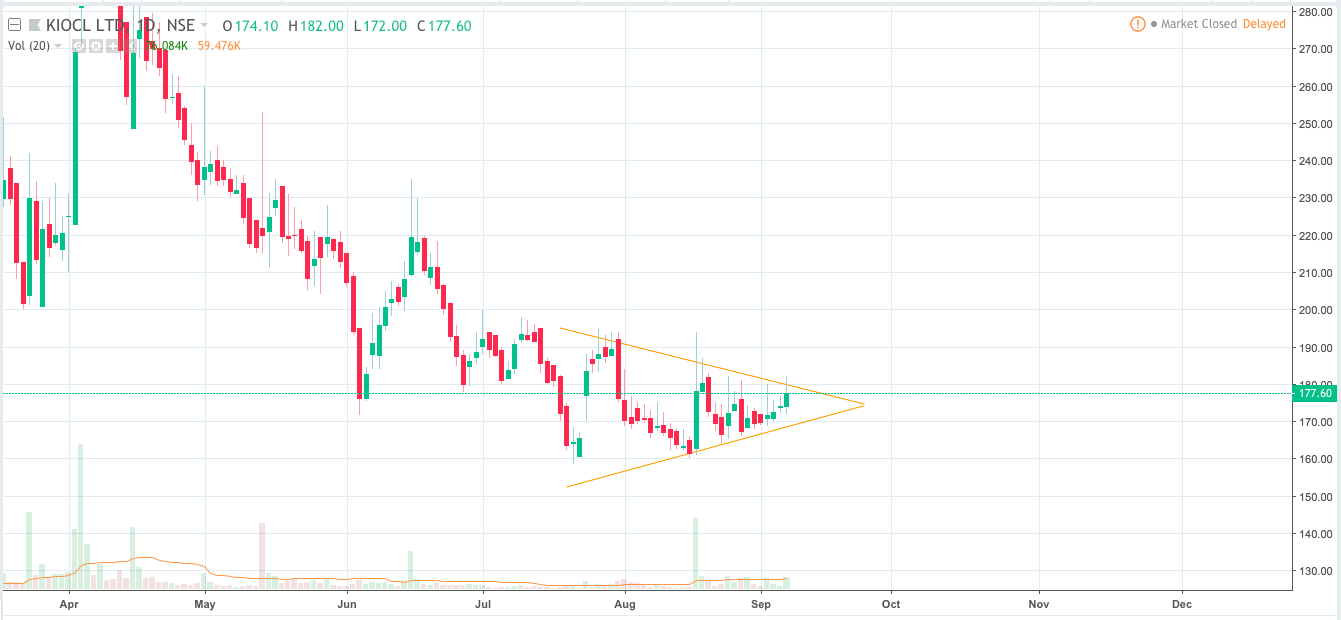
To me it looks more like a symmetrical triangle. Ascending triangle we would need a price hitting a single resistance point with higher lows. I don’t see that here. However I do see some action coming here above 50MA and the triangle breakout.
I mostly find your posts misleading fellow boarders.
Don’t see any ascending triangle here in KIOCL.
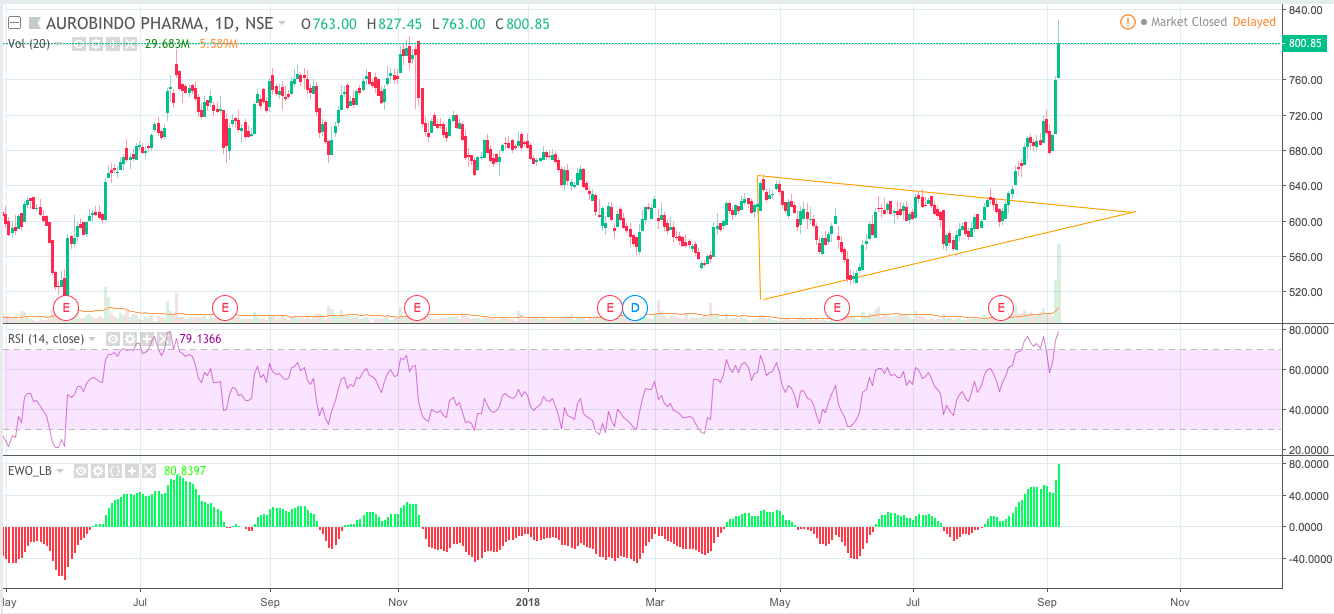
Don’t see an ascending triangle in Aurobindo either that led to the breakout.
Rounding bottom in Avanti? Maybe you meant to say rounding top. I don’t see a rounding top either. Because it was a sudden spike and a sudden fall.
In a rounding pattern, there must be consolidation at the top or bottom. In a rounding top, first the uptrend will end in a climatic level of volume, then the consolidation will happen at lower volume/dropping volume (no profit taking), then again fall down in heavy volume, and keep falling accompanied dropping volume.
1 Like
Hi, Thanks for your opinion.
This is the asc triangle which I mentioned about:
This is KIOCL:
You are right, on the technical chart, this is not a rounding bottom. I was deceived by the simple chart, which I posted in the previous post
Either you could reply in those misleading posts on how those are misleading… would be a good learning for me and others, otherwise pls feel free to flag them.
1 Like
this is a simple chart to analyse imo…
https://www.tradingview.com/x/w1Esak8t/
a change of character across 200-235 space, on a demand rally would show if there is really supply exhaustion…
although the point u make, regarding volume surge without downward movement, might signal bottoming out, but i would like to see a true demand rally happening, clearing previous levels of climactic volumes…
unless that happens, this is very much a downtrend channel to me…
pretty much what happened with avanti, a classic distribution [i am a bit less literate about rounding tops bottoms and sides, so dont know what it is]…
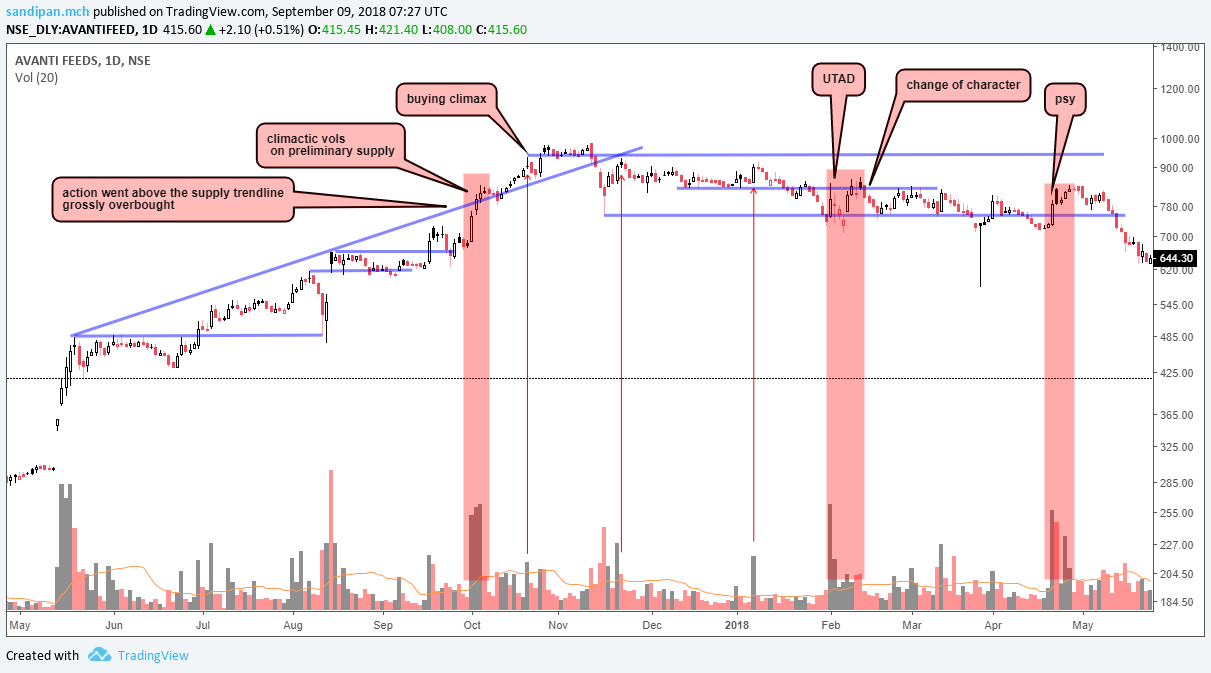
the first climactic volume was significant as an advance block candle stick pattern , and also propelled the action to a grossly overbought situation, primed for a distribution…
1 Like
Again the chart you posted is not a ascending triangle. It’s a symmetrical triangle.
Refer to this picture - https://goo.gl/images/AeaYrn
1 Like
Agree, i phrased it wrongly. I intended to say, it was similar to Aurobindo’s triangle breakout.
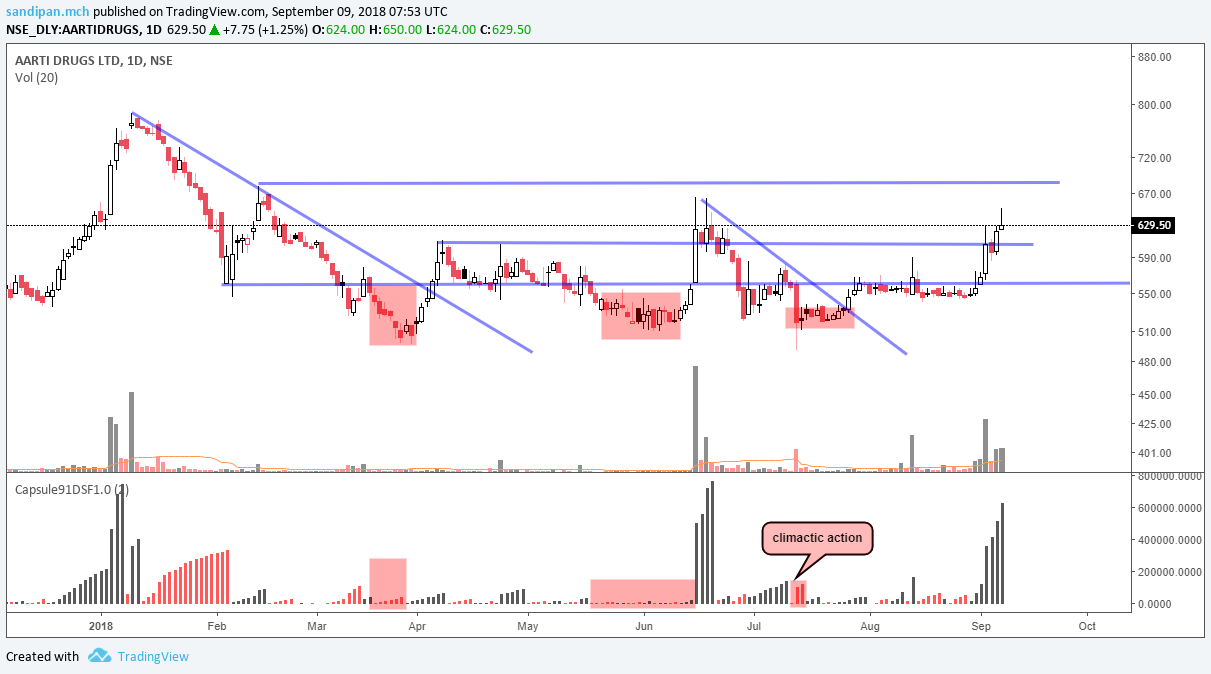
aarti drugs…
i am following this chart from your list
there is a very complex thing that is happening on a 3 year basis, but lets leave that and if i focus on the recent 2018 action, after an upthrust on a beautiful demand rally, started the shakeout rounds…
these drops i believe are done for freaking out the retail and making them sell, an engineered fall… meanwhile the smart money absorbing the shares…
but what is particularly interesting is after a certain level, i see the market comes to a gross indecision point, where there are no more sellers, and the candles stops trending, which is followed by rampant buying , and repeat…
during july, there was a climactic action which i loved… came to a grinding halt, with so much volume, with no downward significant movement and also a wick…
not a classical hammer candle, but enough info is loaded there to tell, that the violent shakeout rounds are done…
the levels of 684 making a support, would be a very good case for the bulls to take on from there, as the stock would be in the strong hands very much buy then
considering the longer term action… this is a 3 year old re accumulation process, which is almost nearing to an end…
the completion to be marked by a change of character from resistance to support, at the said level and trendline… also that is the first level to show the change of character, so there will be break and retests of prior highs also[aka back up action]…
once those happens, i would be considering making entries
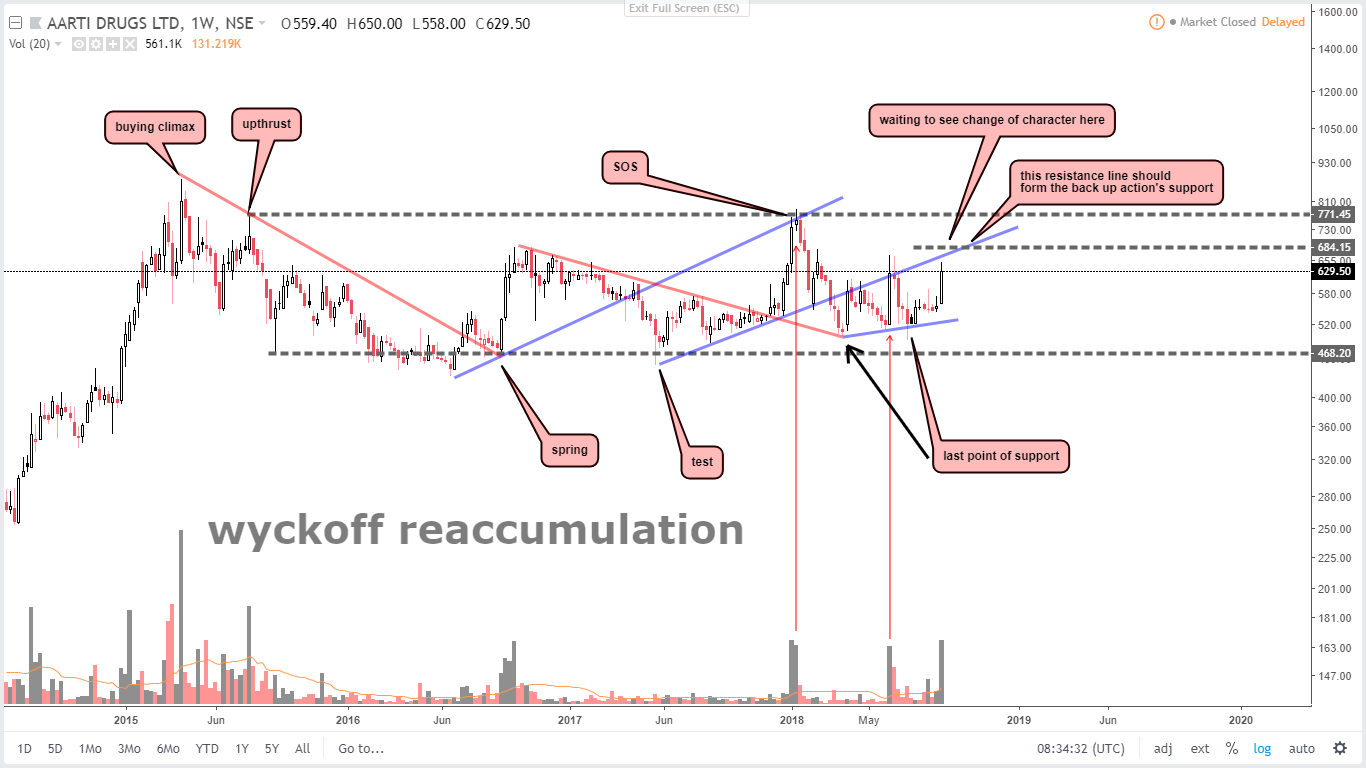
from point and figure charting i have calculated a major rotation point to be encountered in 1400-1500 level, 1579 to be precise as the best case scenario i have, which will also mark the completion of a primary wave 5 in the chart acc to my elliot wave count
also note, the market reaction to the march 8th incident, in the tarapur plant when novaphene explosion happened… although the revenue loss was a mere 2.5% estimated annually and the plant being insured, back then in march it was a damn bearish market, which didnt react to this news much… evidence of the stock already being in strong hands…
disclaimer…tracking the chart, no positions taken yet
[if there were sell calls from the media below 614-560s, it would be an indirect evidence that the accumulation is going on]
2 Likes
These are symmetric triangles, though not convincing pattern formation.
To give an example for misleading chart - Sun Pharma chart which you posted.
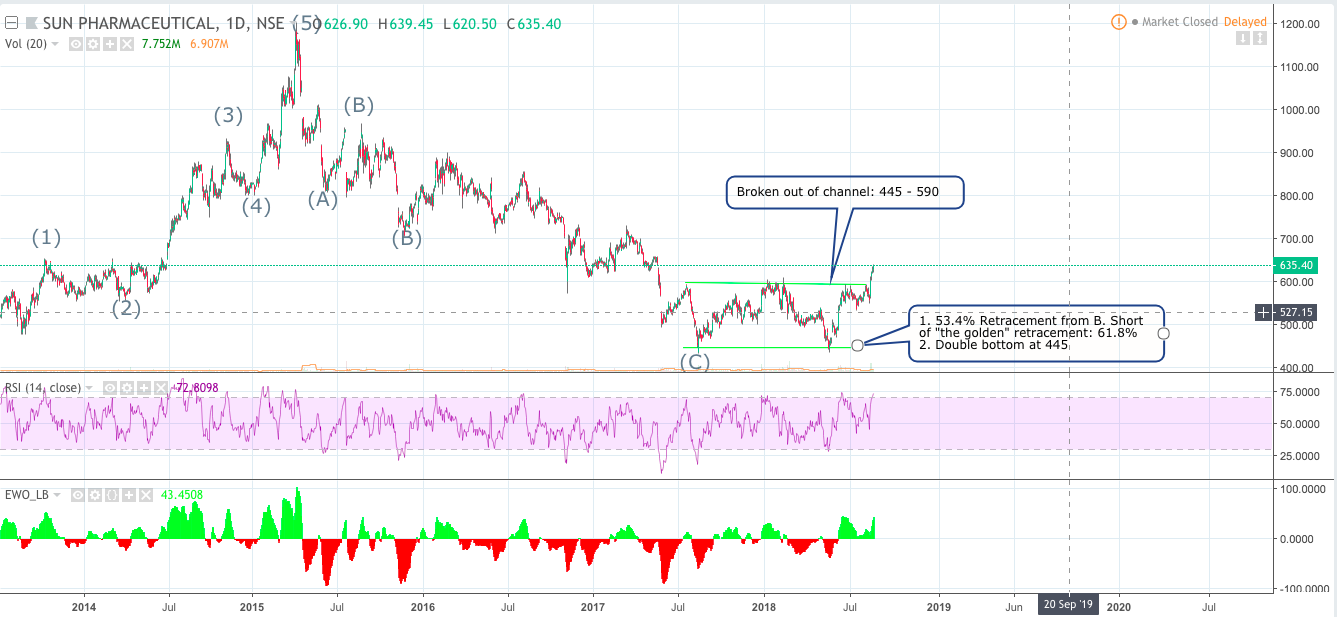
Random numbers plotted for the Elliott Wave count. Looked to me like confirmation bias.
You took 470 as the beginning of wave (1) and 445 as end of wave (c)/wave [2]. Wave [2] can never go below the beginning of wave [1]. But here it does, which is wrong (so these are not wave [1] and wave [2]). This violates rule no. 1 of EW.
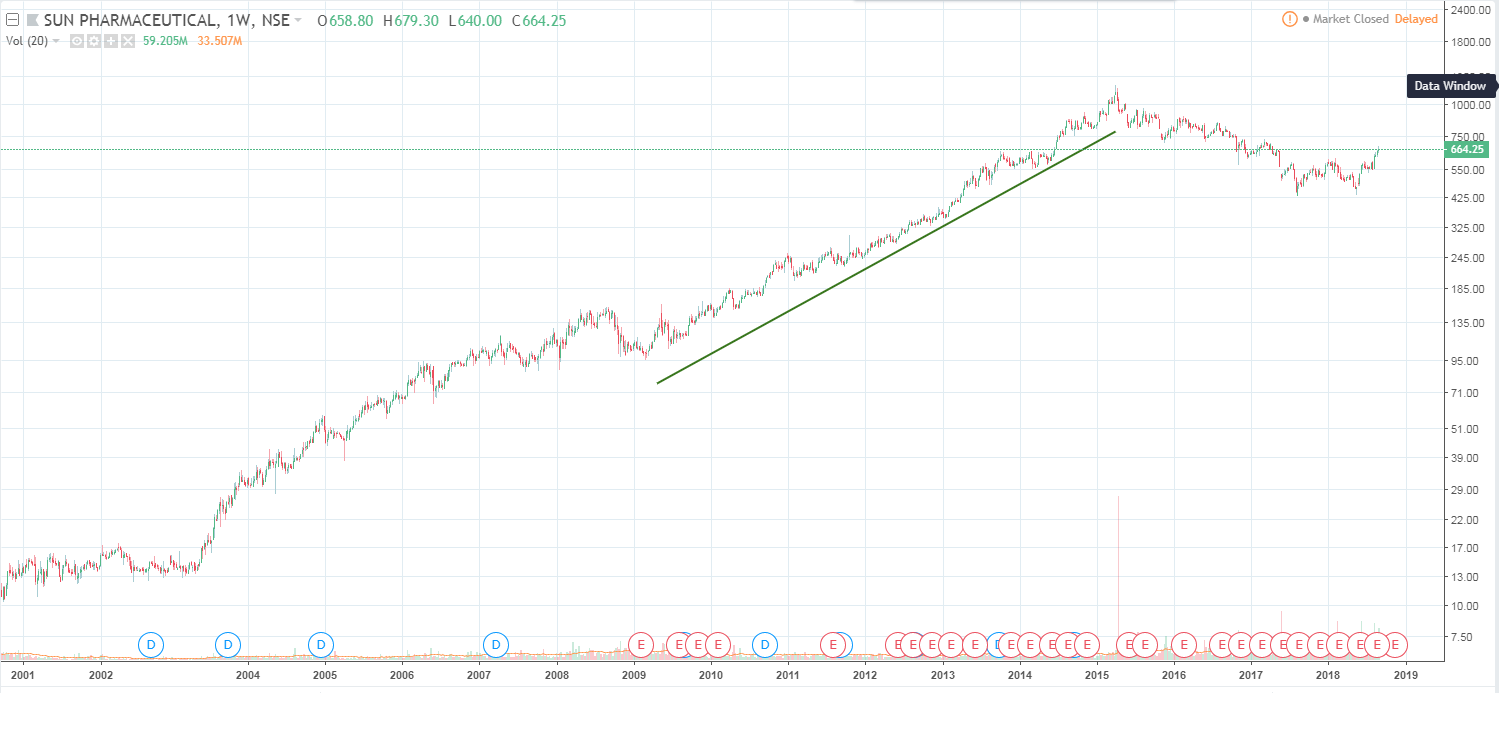
If you go even further in the past in the Sun Pharma chart, the wave (which you called as waves (1) to (5)) started way back in 2009.
Also in your chart, you mentioned that wave (C) is 53.4% retracement of wave (B). If it retraced 53.4% of wave (B) like you mentioned, wave (C) should have been within the wave (B) range, and not go further beyond wave (B). Random EW points accompanied by random calculation.
What worked in Sun Pharma was the double bottom.
2 Likes
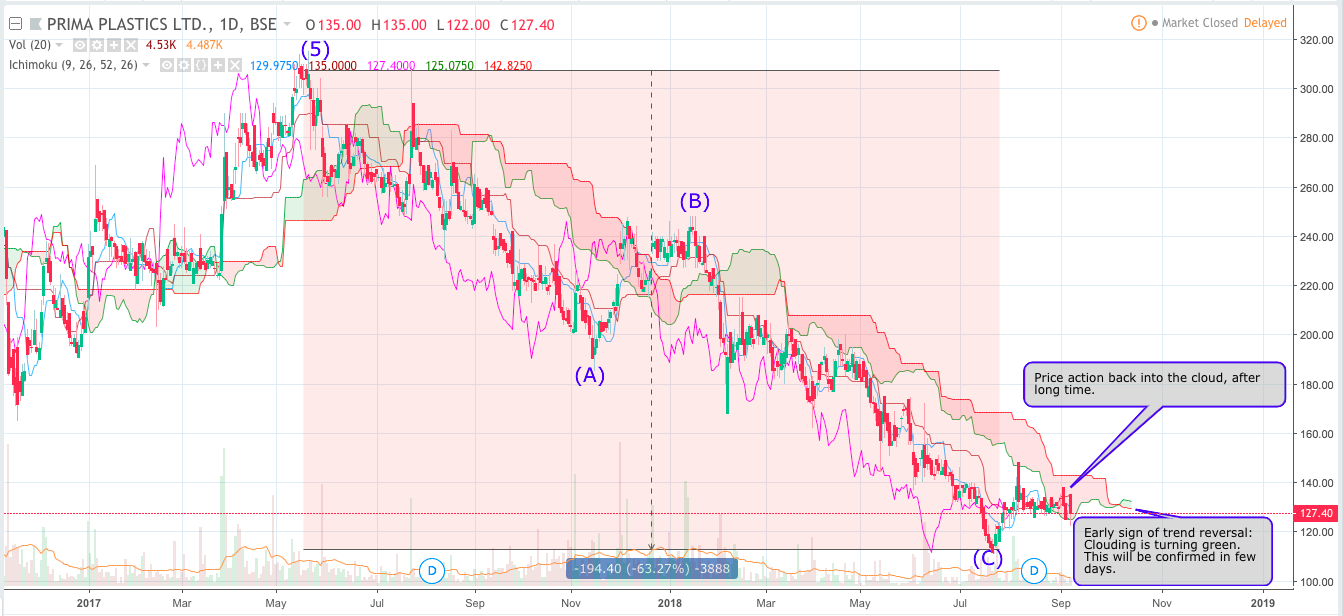
Alright. What if we put a elliot wave count to this. Isn’t this a 5wave fall? Not an expert in elliot wave theory. Just curious
Yiah 5 waves completed and correction post that…
reliance looks good even after such a stellar move…
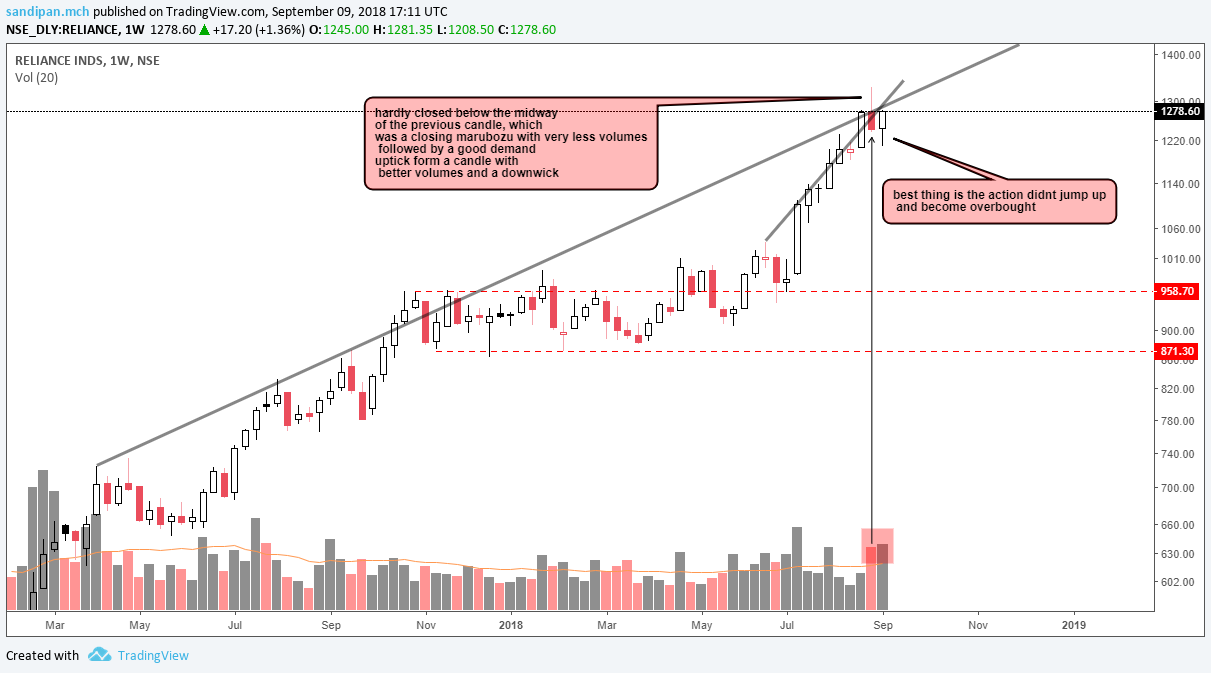

disclaimer… no holding and a lot of regret missing the classical flag accumulation ![]()
airtel is getting absorbed into the strong hands
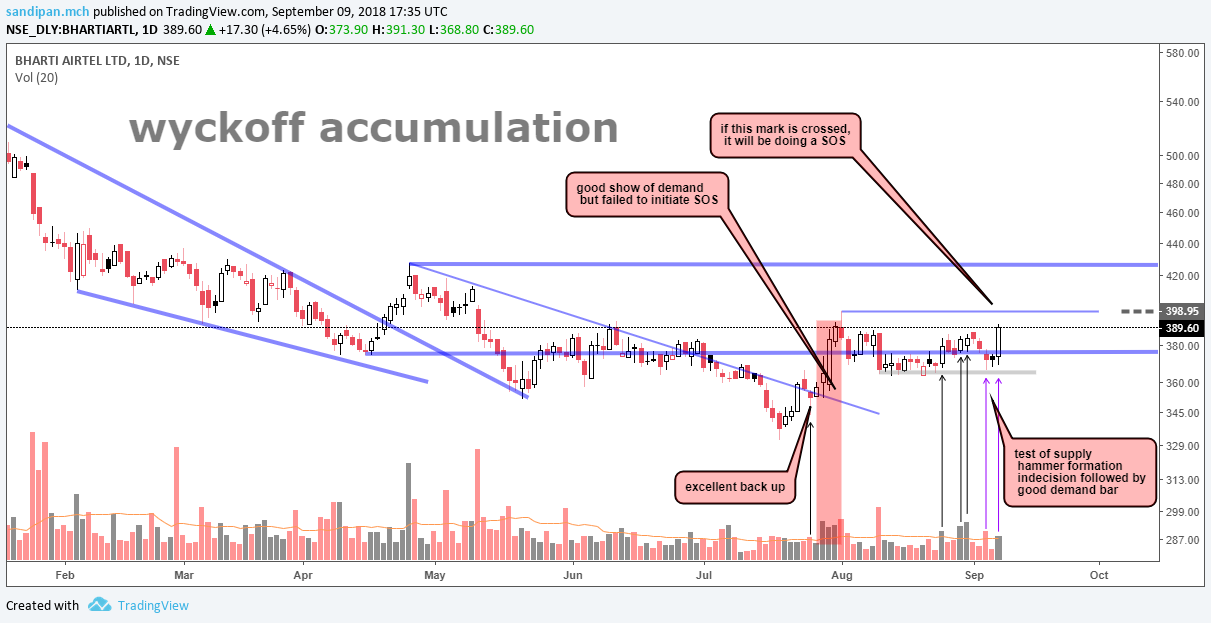
after the show of strength, the supply generated off it would be important to know, if the absorption is complete or not, and the action is ready for a last point of support
as of now, it looks like a positive structure, and change of character is will soon happen
the drop on volumes of 9th august, dosent look like a climax with an opening marubozu candle on it, but to clear the things off, the on balance volume clearly shows, that there has not been any loss of volumes due to that,and it has maintained a base, indicating, there was no major offload out of the accumulation base…
disclaimer… no position