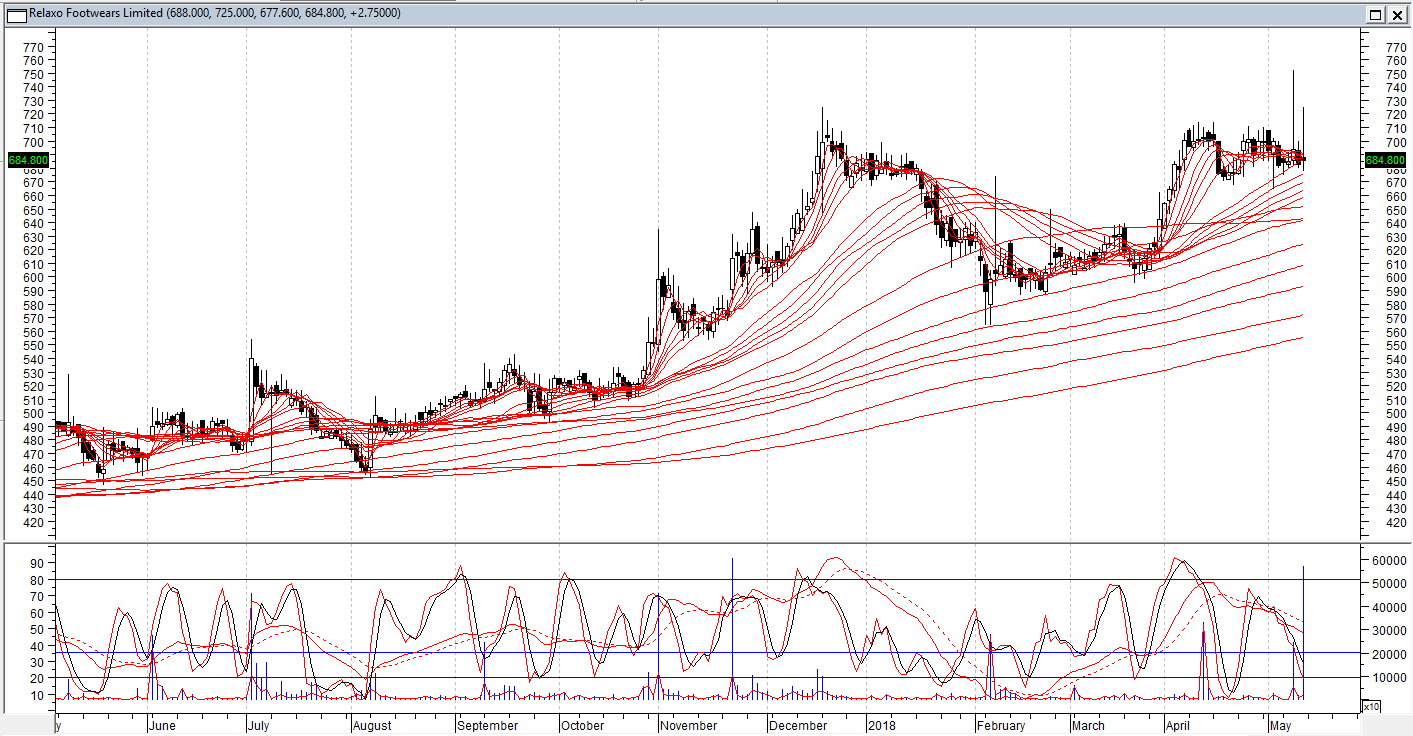
A price action seems imminent, as I found on another chart that Bollinger Bands are nearly 50 percent narrower than normal. Relaxo has not been able to cross the high of 702.05 made in Dec 17 on closing basis.Recent volume spikes on daily chart have not led to any price action. Overall I will be cautious. The possibility of a sharp downward movement cannot be ruled out.
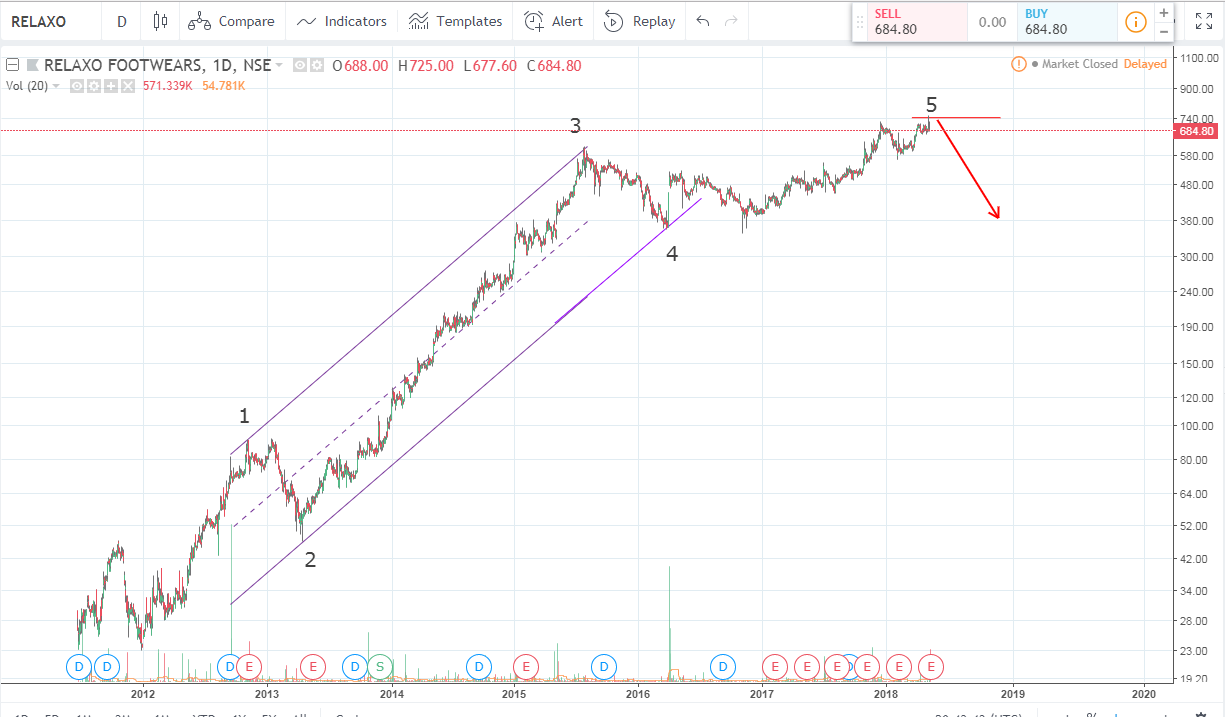
@Capsule91 This is my interpretation of Relaxo chart. I see five waves up completed. So, I’d expect huge correction to happen. Currently wave 5 retraced from 740, which was 0.618 of distance traveled from wave 1 to 3. Give it some time and see if it is really the case. i.e. completion of wave 5.
I see a triple top with a false breakout. I also see a flag pole. A wedge and some other patterns. I can also see a head and shoulder. I am seeing all the patterns at the same time. I dont really know what to make of it. I can also see a truncated 5th wave along with a full blooded 3rd wave. That cant be normal right?
In Cup & Handle pattern, volume should confirm too. Here, it doesn’t. Also, the handle should form at/below the resistance point (which is equivalent the other side of the cup).
Here it ran past the resistance quite a lot and formed the handle, so there too, it doesn’t confirm to the pattern.
In some cases, it may just form a cup without a handle. In those cases, the stock will keep rallying past the resistance point without forming a handle (like in this case, but here, the volume doesn’t confirm the cup & handle pattern, so it should be some other breakout)
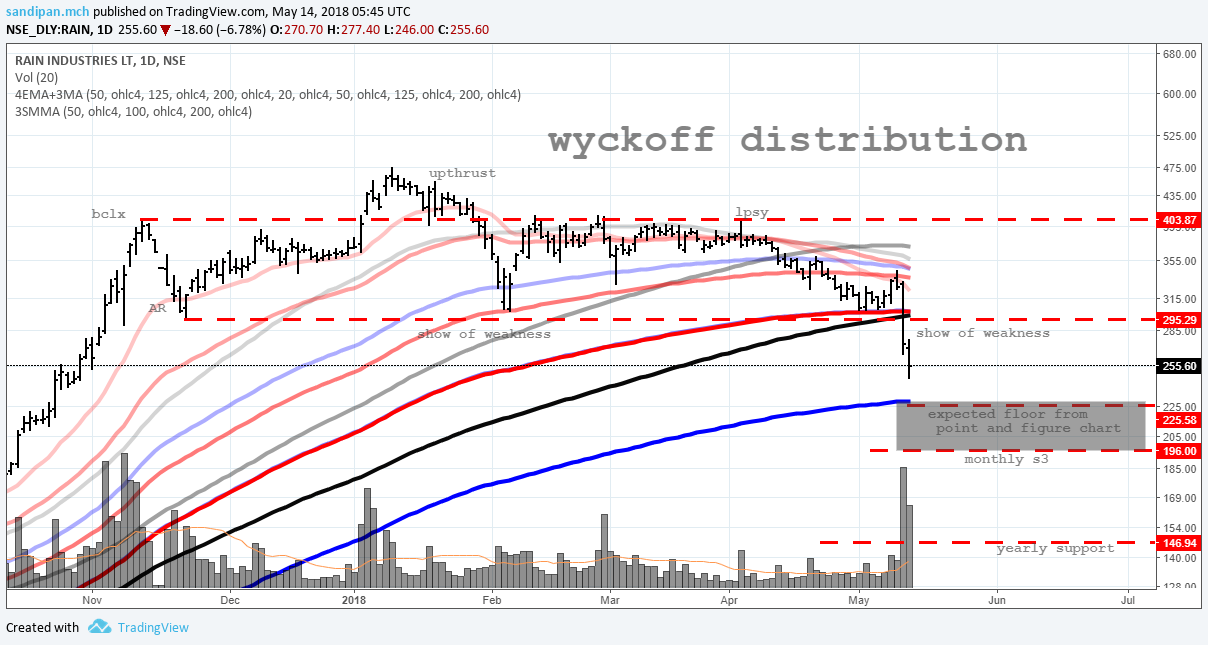
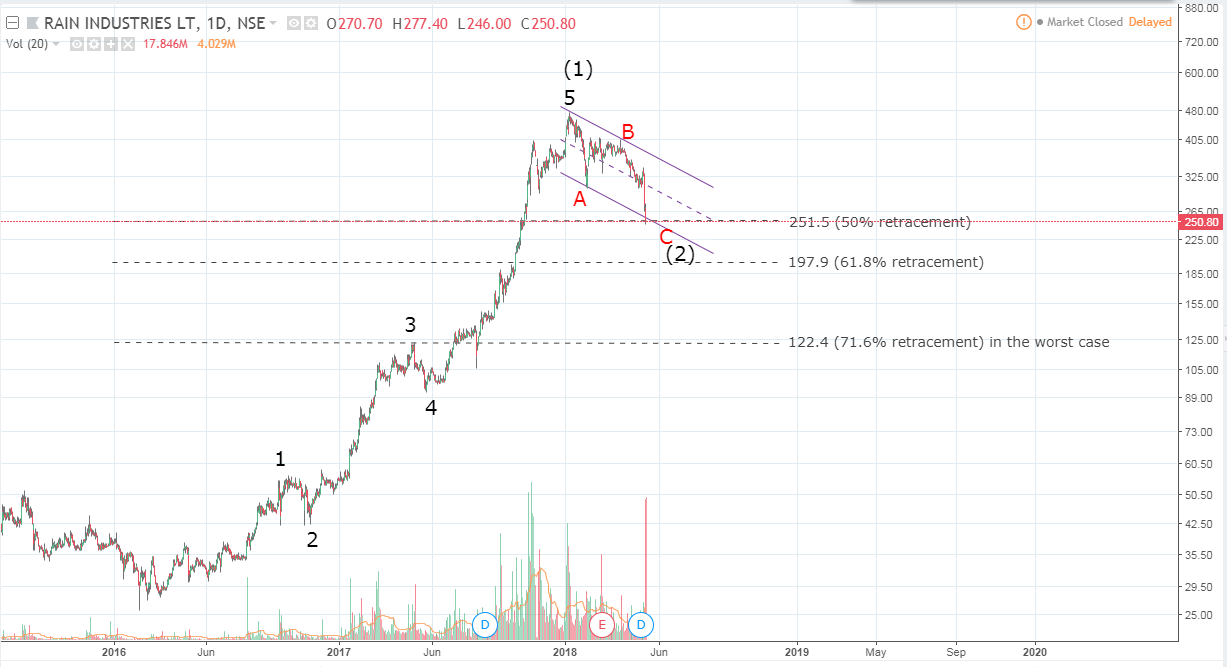
wyckoff distribution pattern in rain industry…
although the floor is expected to be around the 200day wilder moving average [dark blue],
if redistribtution starts after this distribution then the test of the yearly support is lively, form a pure technical pov…
thank you @Agarwala nd @PE_Ratio ,
the valuations the company is trading at is quite expensive in my eyes…
what you both guys have been refering to is a possibility fo wyckoff distribution in ur own style of TA…
what happens post the double top, with bearish divergence, is going to be the key imo…
if the price action falls like a falling wedged out of the price range support in my chart, then it is definitely going to be a case of distribution…
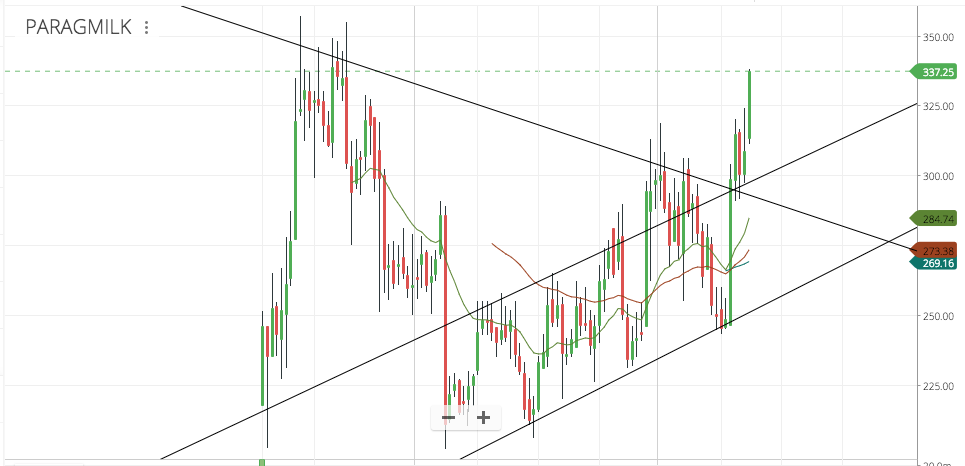
Parag Milk Foods - Few previous attempts to break out of the channel failed but this time its broken out of the channel as well as downward resistance trendline.
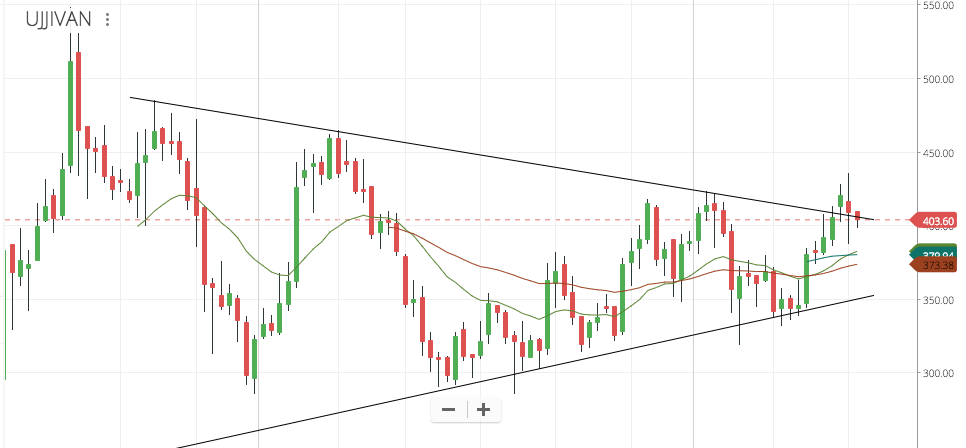
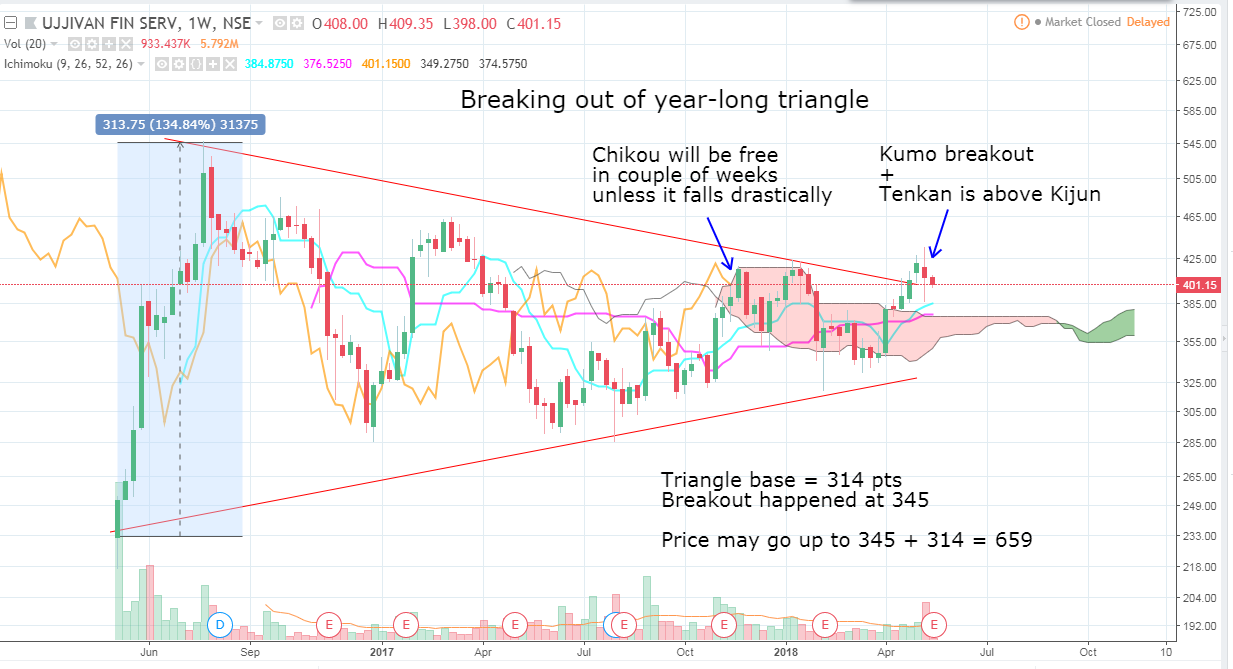
Ujjivan - Retracing back to the resistance trendline on the weekly charts. Since results were pretty good, I think it should stay above and breakout with volumes post Karnataka results. Its a dicey situation though since the BJP’s promise to waive farm loans in KA will spook the markets if they win.
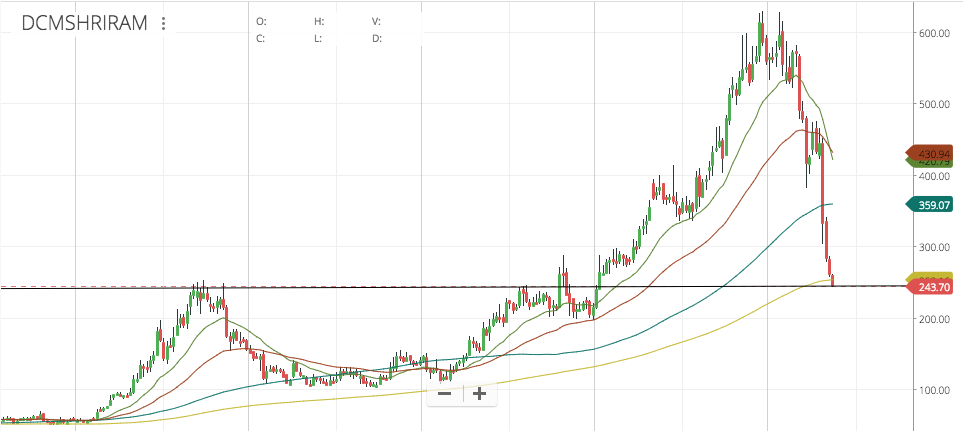
DCM Shriram - Below 200 EMA on the weekly and falling like a junk stock. At some point SOTP valuation of the Chlor-Vinyl, Chlor-Alkali, Farm Solutions, Bioseeds and Fenesta should make this a value buy but at this point it could be a falling knife situation.
Hind Copper chart is looking very interesting. I usually do not pay too much heed to technicals but when backed by very sound and improving fundamentals, it can be a deadly combo.
What is the most prominent sign on charts that a long consolidation is coming to an end.
It went below weekly 200 EMA [Red line] sometime in Nov '10 ~400; is consolidating since. Went above weekly 200 EMA ~85 in Oct '17, and is back down sandwiched between weekly 200 EMA and other averages. Should we wait for it to move above weekly 200 EMA? There is higher bottom formation in last few years as well. What does charts tell you here (even if we ignore fundamentals)?
@Mridul - Current price is resting on the support of the tops made between Aug 2016 to Aug 2017 so at current levels it is a head i win, tails I don’t lose much situation.
However for certainty, it could be better to buy above 200 DMA, or even safer is a close above 110 (on the weekly) when it would be certain bullish territory.
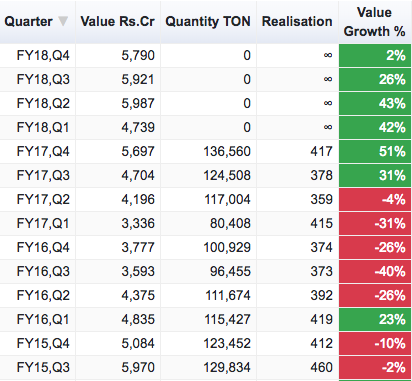
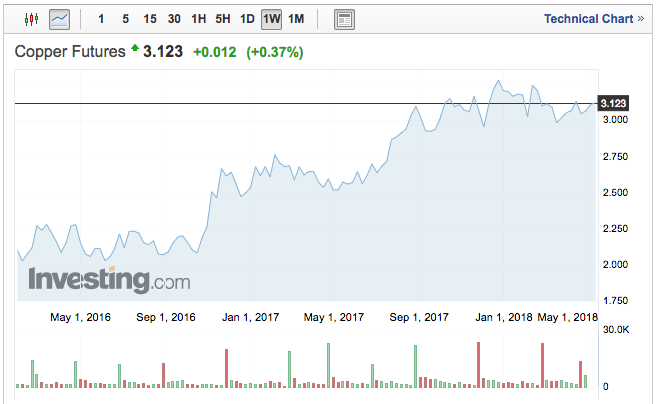
Seen in conjunction with copper exports and copper commodity prices, I can see why its currently where it is.
Exports were doing great in Q1, Q2 and Q3 but hasn’t done much in Q4 despite the underlying commodity prices being much higher than Q4, FY17 which means volumes have dropped (Volumes are missing in FY18 for some reason in the export data).
So unless there is support from commodity price and a pick-up in exports, I think it will remain at these levels for sometime.
Sorry if I have digressed from the TA part but its hard for me to see just one aspect.
@Capsule91 I first thought it would correct till 270s, and then go up in wave (3) after Q1 results (expected it to be very good). But since the CPC volumes were less and more tax provision and forex loss, negative sentiment is around and hence wave (2) is still not over. It slightly went below the correcting channel and bounced back. Also, wave (2) has now exactly retraced 50% of wave (1). If it doesn’t hold this, then the next level to look for is 198 (which is 61.8% retracement of wave (1)).
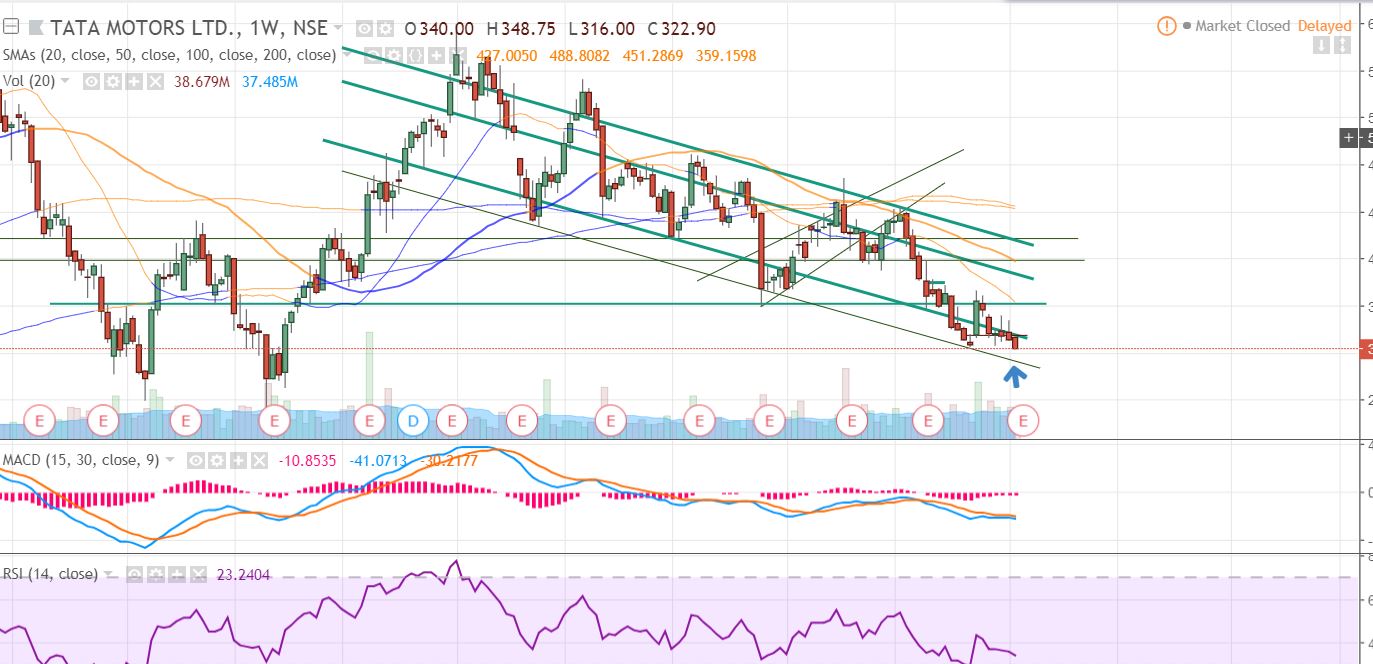
Wow So much crowd here thanks to @Capsule91 for letting me know about valuepicker… …Guys look Tata Motors I think It will bottom out near 315-300 range…what say ???
I would recommend to view Hind copper now through Guppy multiple moving average system on daily charts… there is now a bunching up of the moving averages…this indicates possibility of a big price movement in the next few days maybe in 2 weeks…the stock is under good accumulation…
On long term charts, above 74 Hind copper remains bullish…so would recommend to buy it on upside breakout only
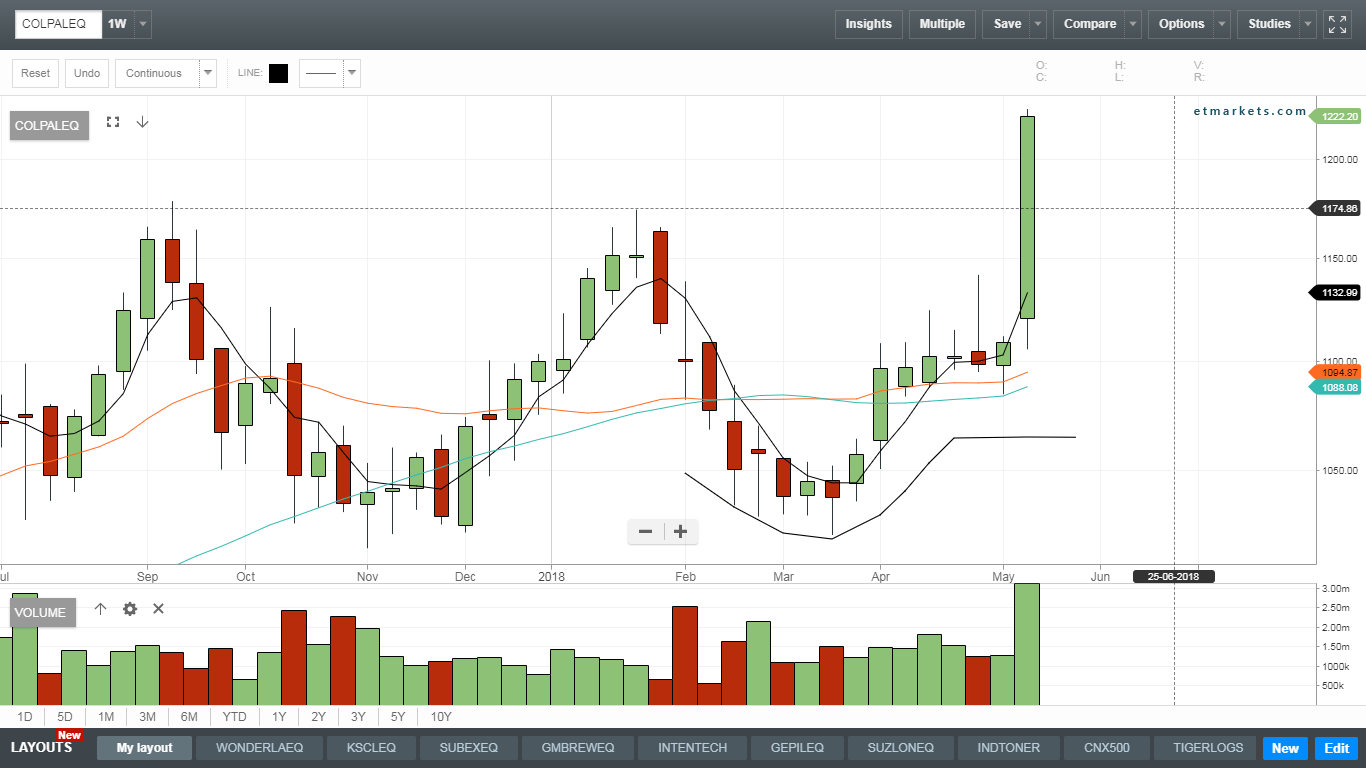
Nice rounding bottom on colgate followed by a platform and ofc a breakout to all time highs on huge volumes.
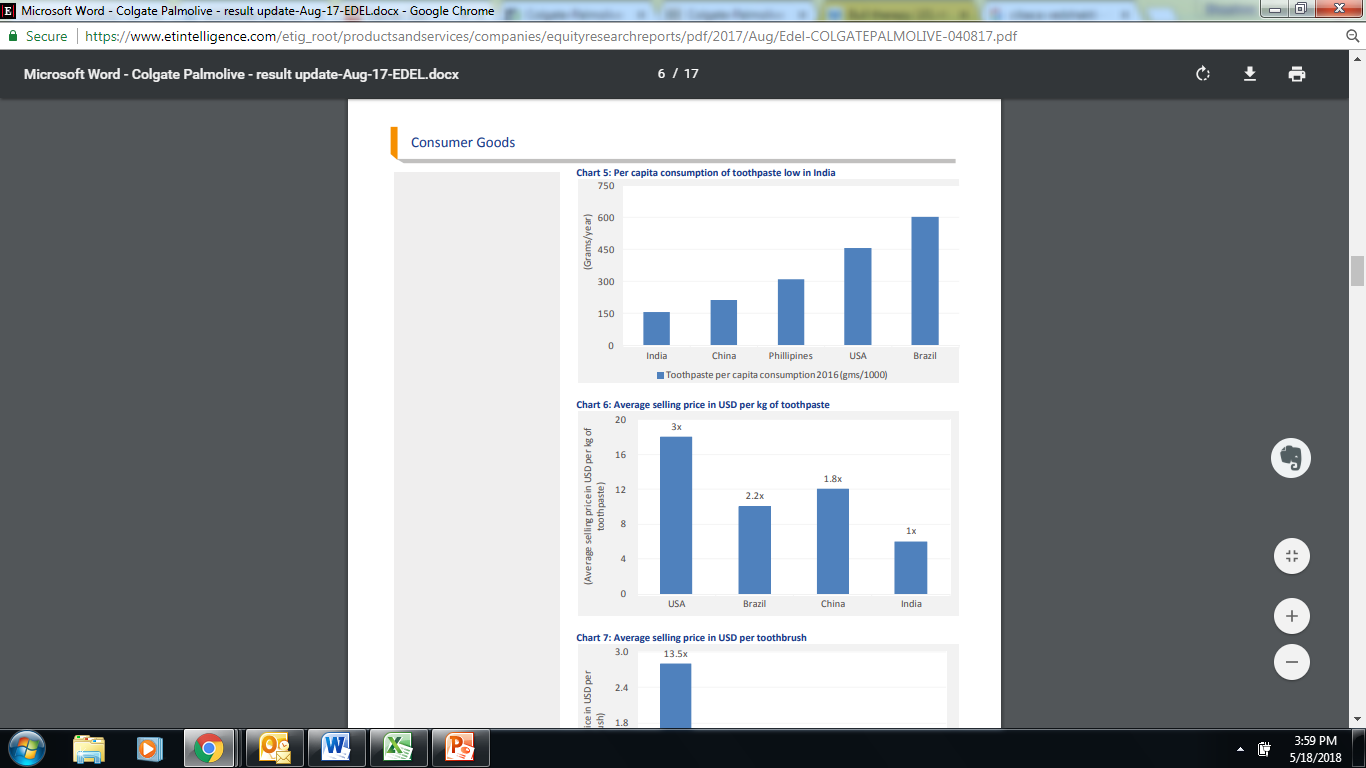
What is happening in the toothpaste industry is quite interesting. The herbal segment - popularized by Patanjali - has increased the pricing power for all players in India. The margins have really improved for Colgate and all other players. The average price of a 100 gm herbal toothpaste (average of all 4 players Colgate, HUL, Dabur and Patanjali) is currently Rs 55. Colgate has priced its offering intelligently and is currently the cheapest player in the high end herbal segment and low end herbal segment with its Vedshakti brand so there room to catch up on prices. It launched its Cibaca Vedshakti brand at Rs 32 per 100 gm and it is now up to 45-46.
In general, the gap in both toothpaste consumption and toothpaste prices is pretty high between India and other nations. The other thing about colgate is its FA turnover which is slowly improving compared to its historical average. It may not hit its peaks though so it remains to be seen.