
bls international…
continuation to the previous post…
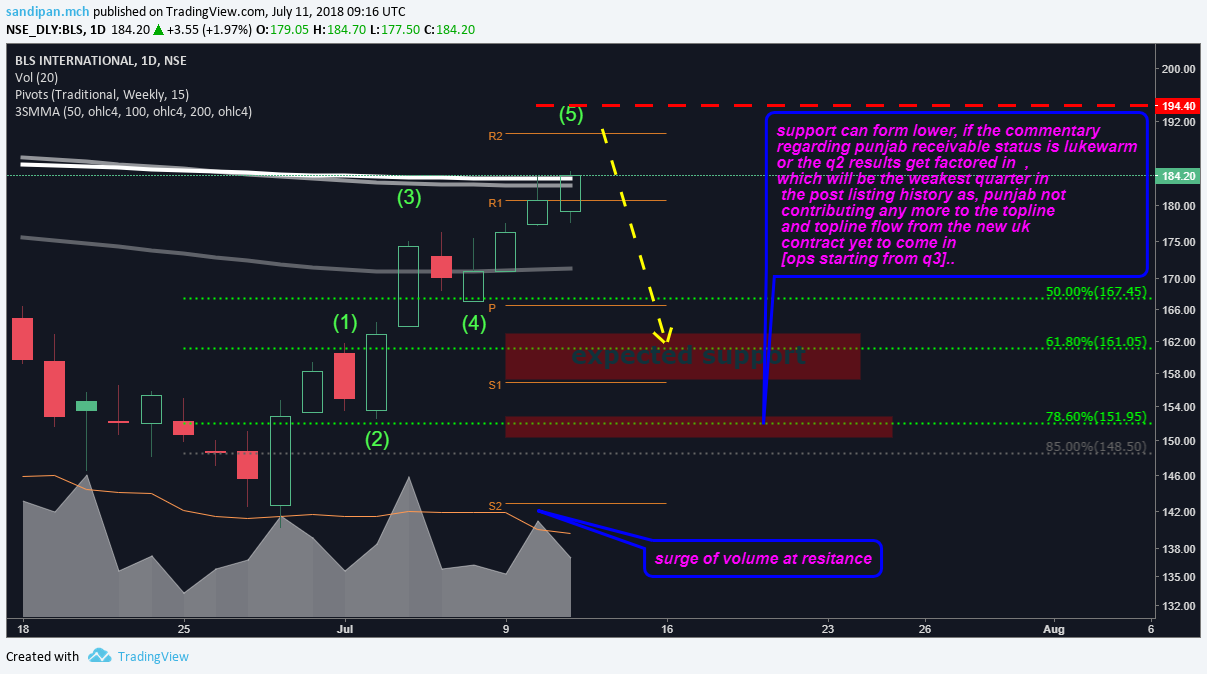
seems buying climax soon should happen, either at the moving average resistance or more likely a bit higher at R2 weekly resistance…
end of wave 1 subwave of ongoing wave 3, should correct in ABC in wave 2…
then again, what just happened seems like bls is entering into a bullish zone and driving out of the hole…
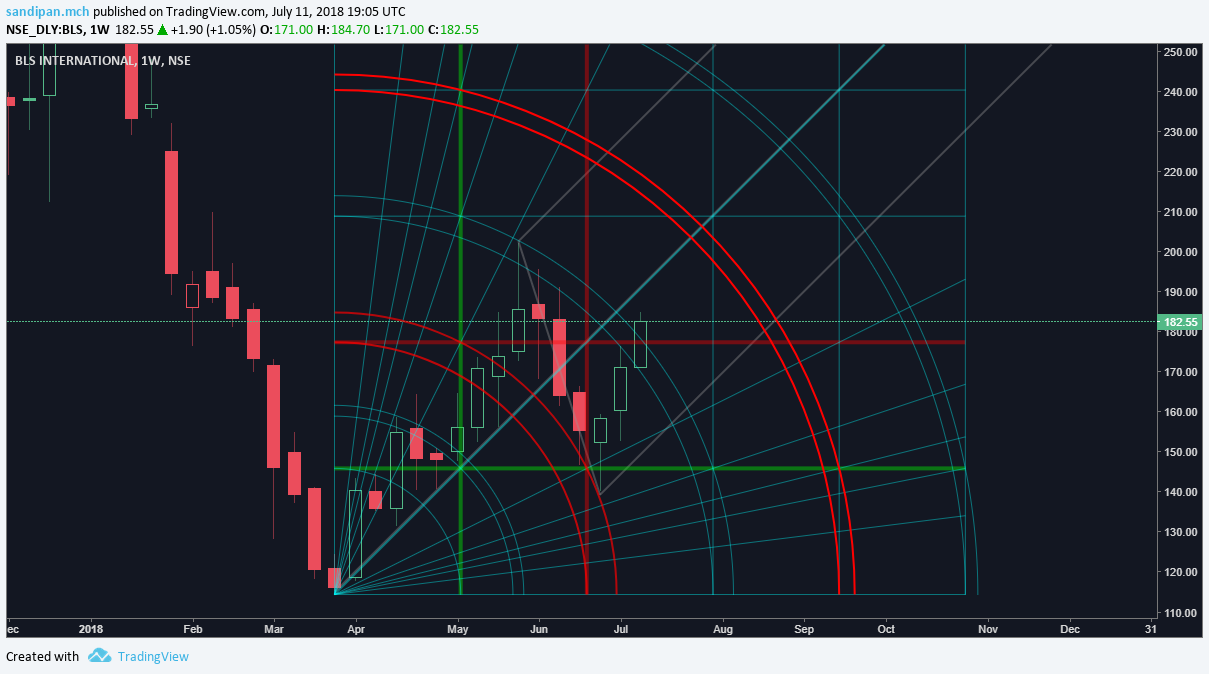
here the current red horizontal level2 of the gann square that is being broken up, should act as a future support at 175…
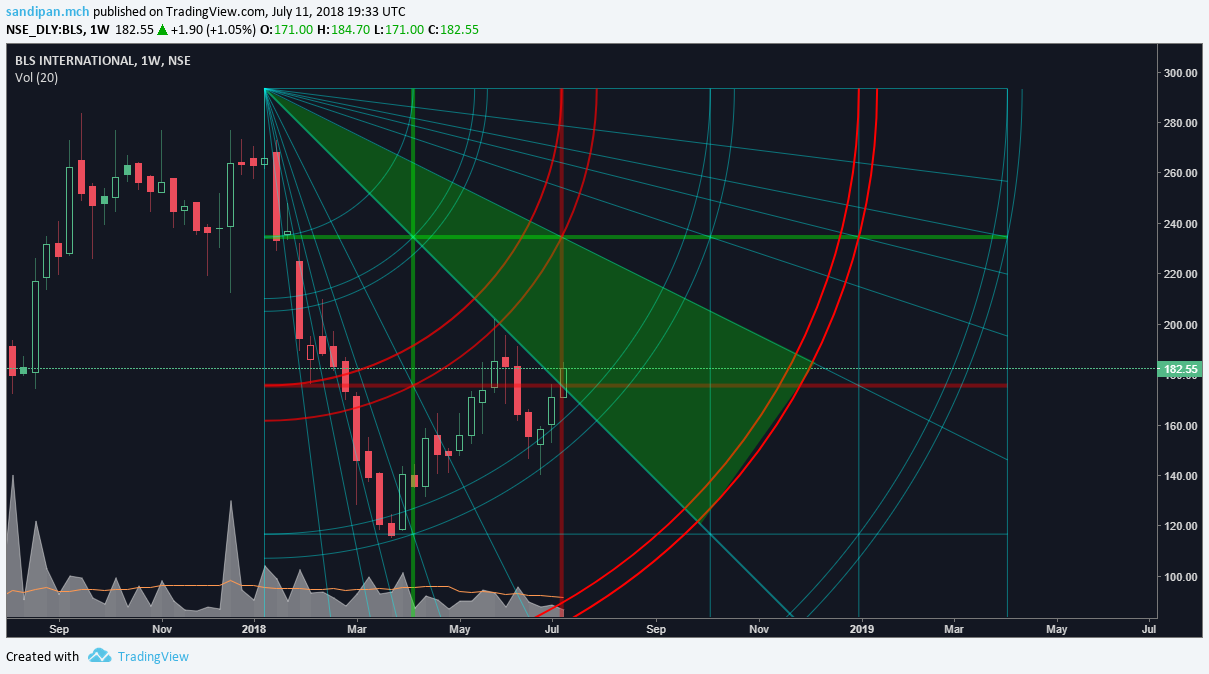
another view of the breakout in the gann chart…
the 3x1 and 3x0 arc whcih stopped the previous high in the 200 vicinity, has been broken on this run, so a "change of character " of the arc from resistance to to follow through has occurred on this run… again asserting 175 level should be a good support on the next corrective wave…
So to sum up, although the expected support forms at the regions mentioned in the first chart , based on a poor q2 factoring in, but the current levels breakout, should also be considered as to be retested and might act as a successful test of support…
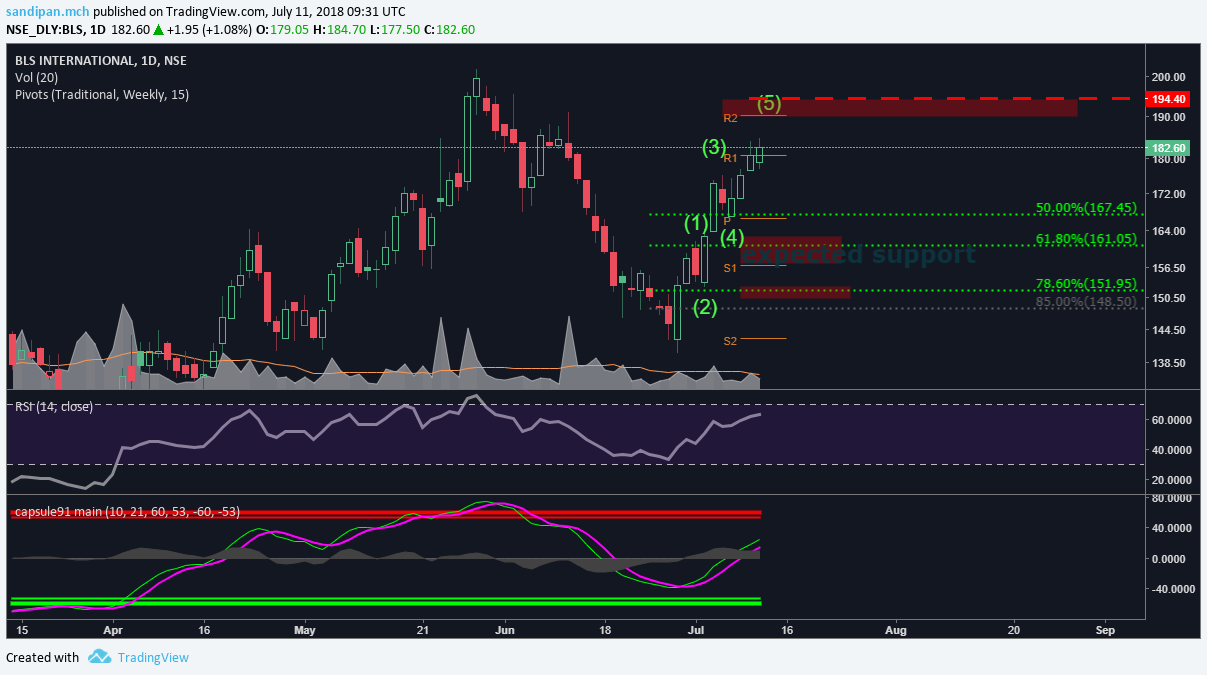
further looking at the rsi… in the daily, which is not yet over bought… and my custom indicator’s oscillators are far away from the red overbought zone, indicating, the broader [wave3 of higher degree ]up trend is far away from over and further ensuring the sub wave 3 and sub wave 5 are coming after this sub wave 2 correction…
Disclaimer… invested