
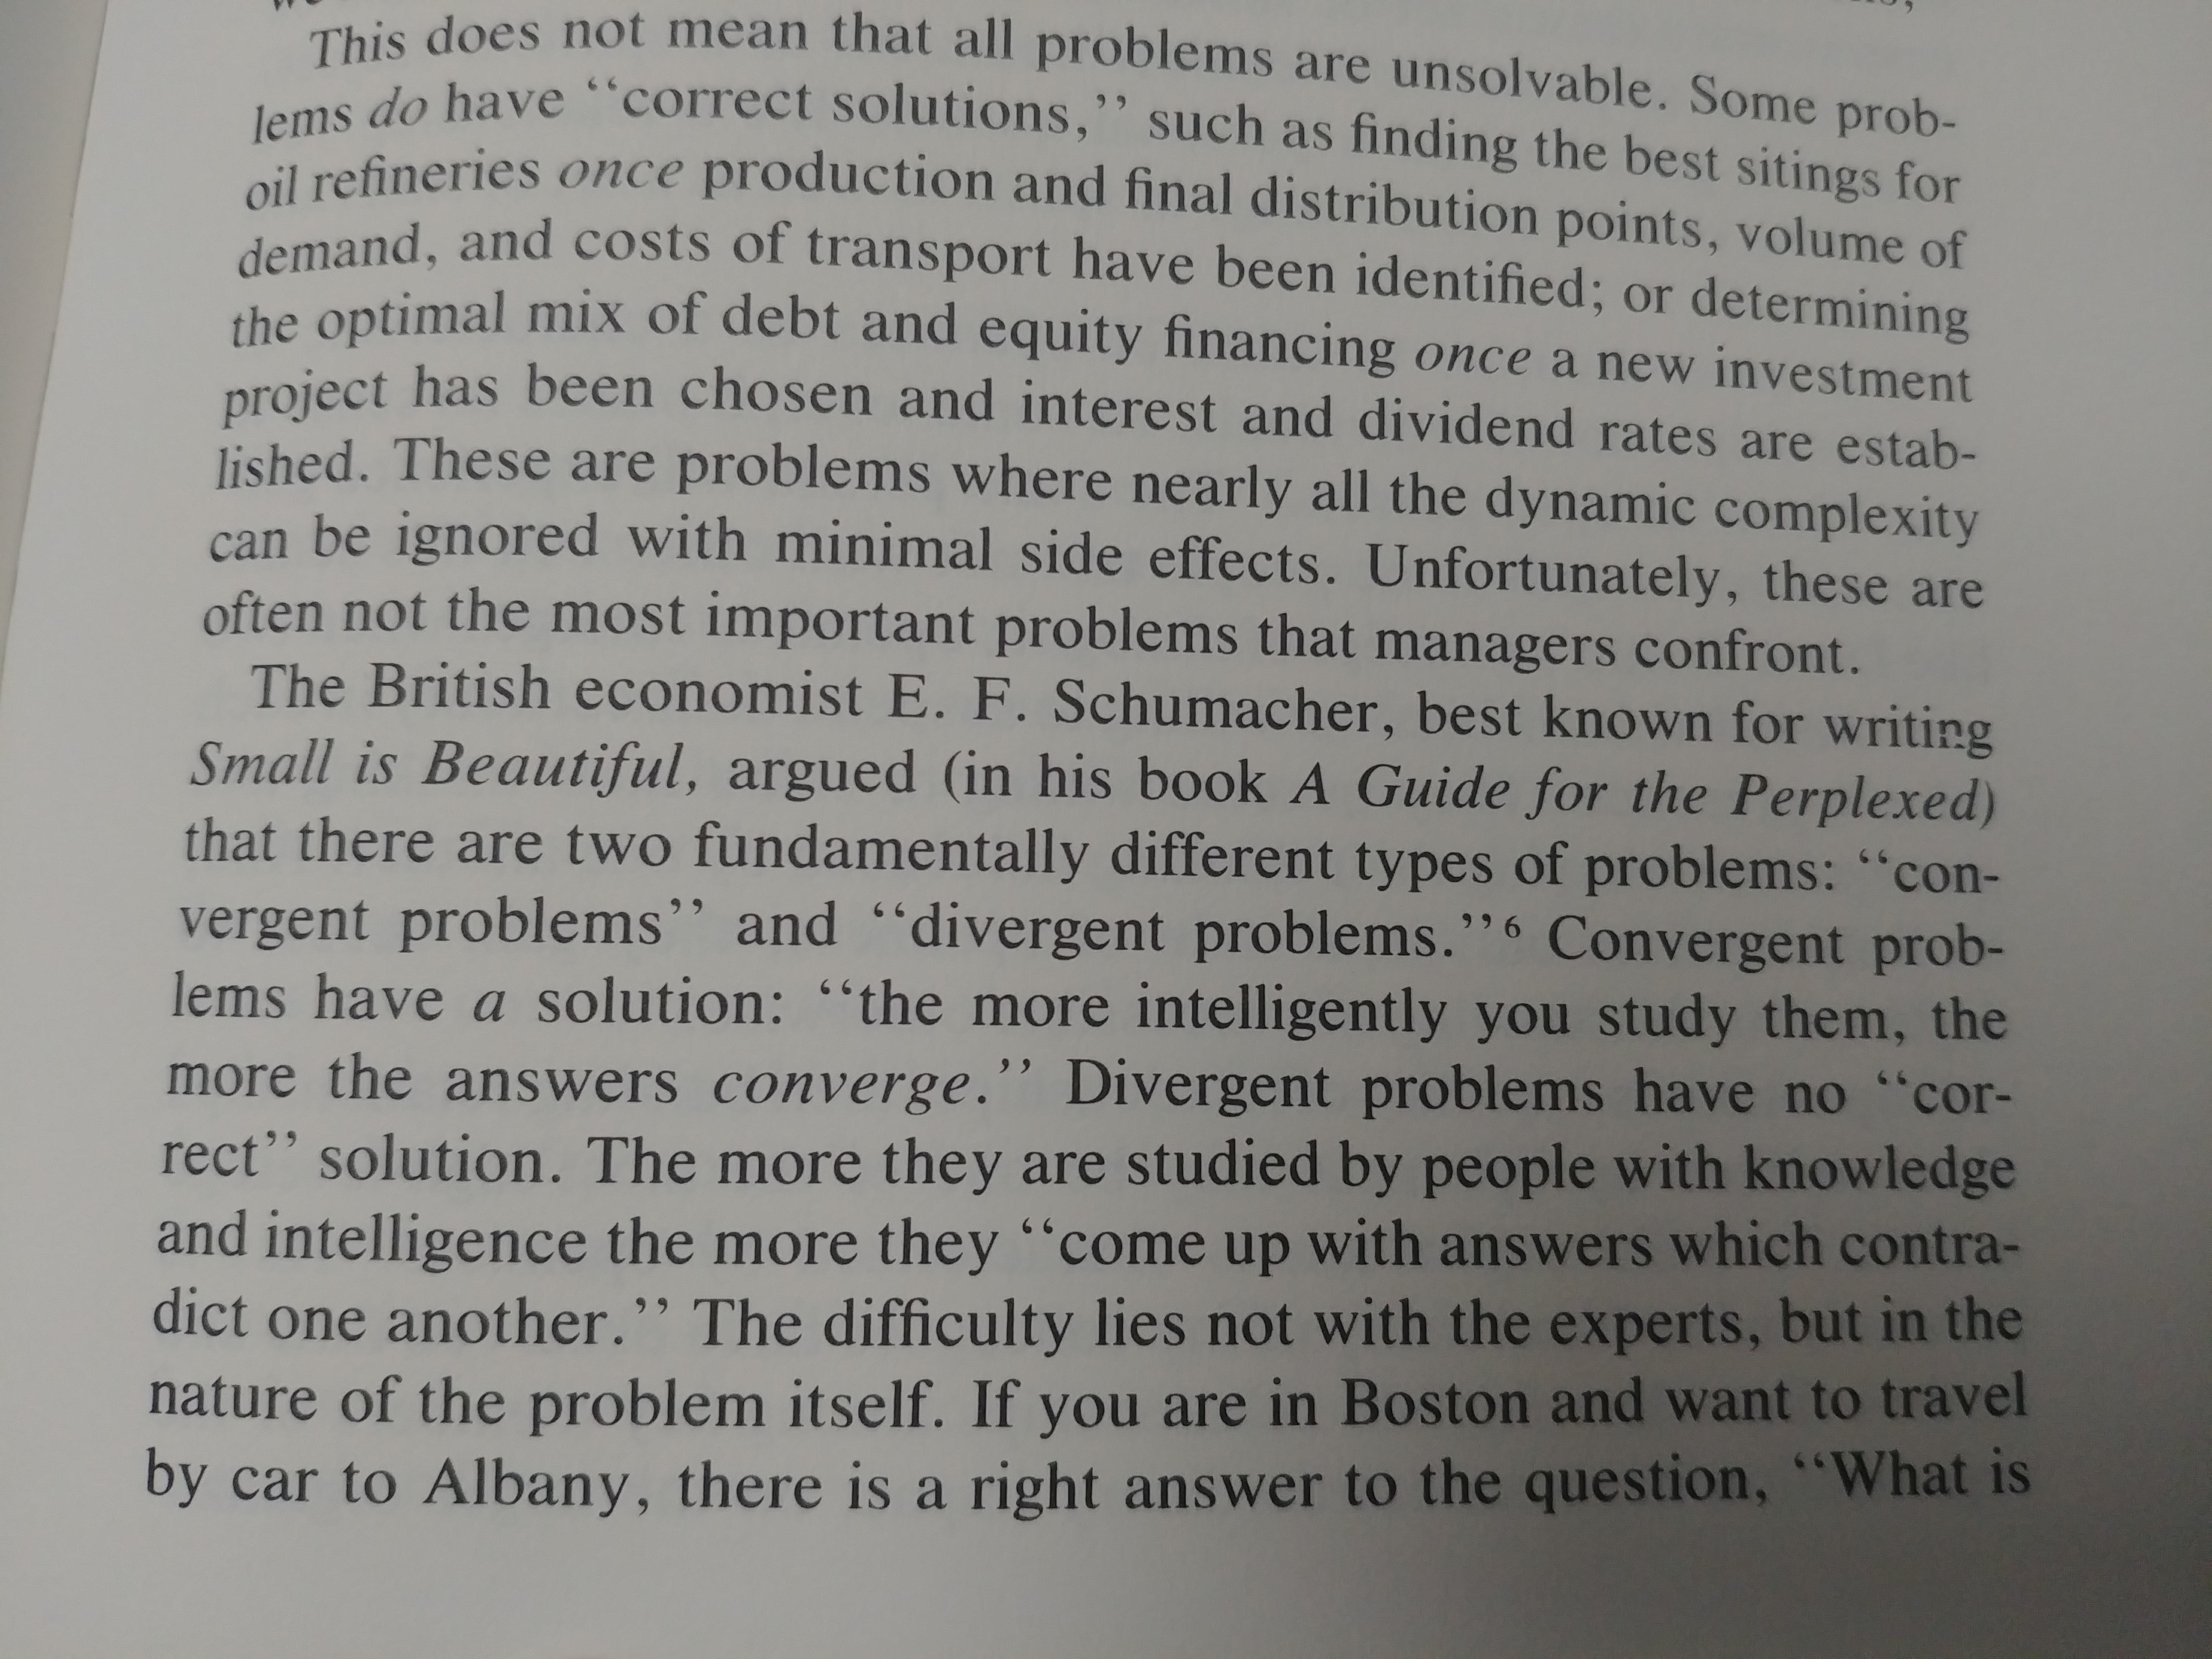
Happened to be reading a book and came across this section about convergent and divergent problems. Thought it was relevant to the recent discussion here which was similar to finding the right answer to a divergent problem.
3 Likes
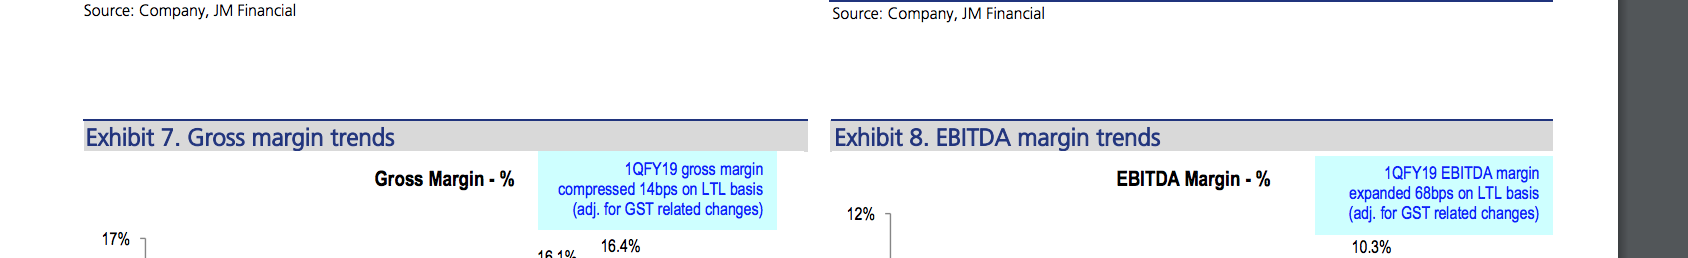
While the company can increase discounts leading to bigger volumes , it can turn internal levers to generate better net margin. I would like to see if this can trend for a few more quarters/years like this.
My valuation of D-Mart, as promised.
I made a blog post explaining my assumptions a little more. However, I cannot share the link owing to moderating restrictions. Subscribers to my blog can view my justifications there.
12 Likes
Great effort.
I have just one question did you triangulate your sales number with the number of additional stores that will be required to achieve those sales ?
The model uses so many forumulas, even Ramanujan Srinivasa wont be able to calculate it in his mind, let alone Charlie Munger
There is something fundamentally wrong
The total invested capital in cell I67 in year 20 is roughly 720,000 crore
Just a present value of 720,000 discounted using a risk free rate comes to the present day amount of 150,523, which is 50% over the current market cap
This does not account for any cash flow in the interim period
So the spreadsheet basically says in year 20 the liquidation value of dmart will be less than the invested capital
1 Like
That’s a great question. And it’s important that you ask that question. In my model, Growth and Capex are linked. So, it holds that I have to justify at least one of these figures (I personally find Growth easier to justify than Capex). Here, I recall watching a lecture by Prof. Damodaran, where he addressed the question of justification of assumptions. One of his students had valued Netflix, but he felt like something was wrong, so he consulted the Professor. The Professor was of course quick to point out that he had simply projected Growth out for many years, without justifying the figures, so much so that his assumption meant that in 15 years, almost the entire world would be subscribers to Netflix. It’s not even funny how dangerous projections can become if you do not justify them.
Coming back to answering your question, yes I did, in my head. But since you asked, let me demonstrate with actual figures from D-Mart’s financials vis-a-vis my own projections. Here’s how I went about doing this:
-
I calculated the ‘Invested Capital’ of D-Mart for the last 10 years. I define Invested Capital as ‘Equity + Debt - Cash’. D-Mart has historically used the buy-and-operate model, so we know that a majority of the capital they invested went to acquiring newer land/buildings.
-
According to D-Mart’s CEO, D-Mart grew at 10-stores-per-year in the last decade or so. There are no exact figures given anywhere, so I have assumed that D-Mart grew at around 8 stores per year in 2009 and gradually reached 12 stores per year by 2018.
-
Dividing #1 by #2, we get Average Capital required per Store. I understand that this is an over-simplification. “Stores” can range from tiny to the huge ones like the one in Bangalore or Mumbai, but we have no other way to get any more accurate.
-
Based on #3, we can calculate the growth in the land/building acquisition cost. This could happen due to a number of factors, the primary being inflation in land/building prices.
-
Now, I can fill up the figures for ‘Invested Capital’ (#1) from 2019-2028 from my own model.
-
Working backwards, I can use the average percentage of #4 to project #3 from 2019-2018.
-
Dividing #1 by #3, we will get Store Count growth per year (#2) from 2019-2018.
Here it is:
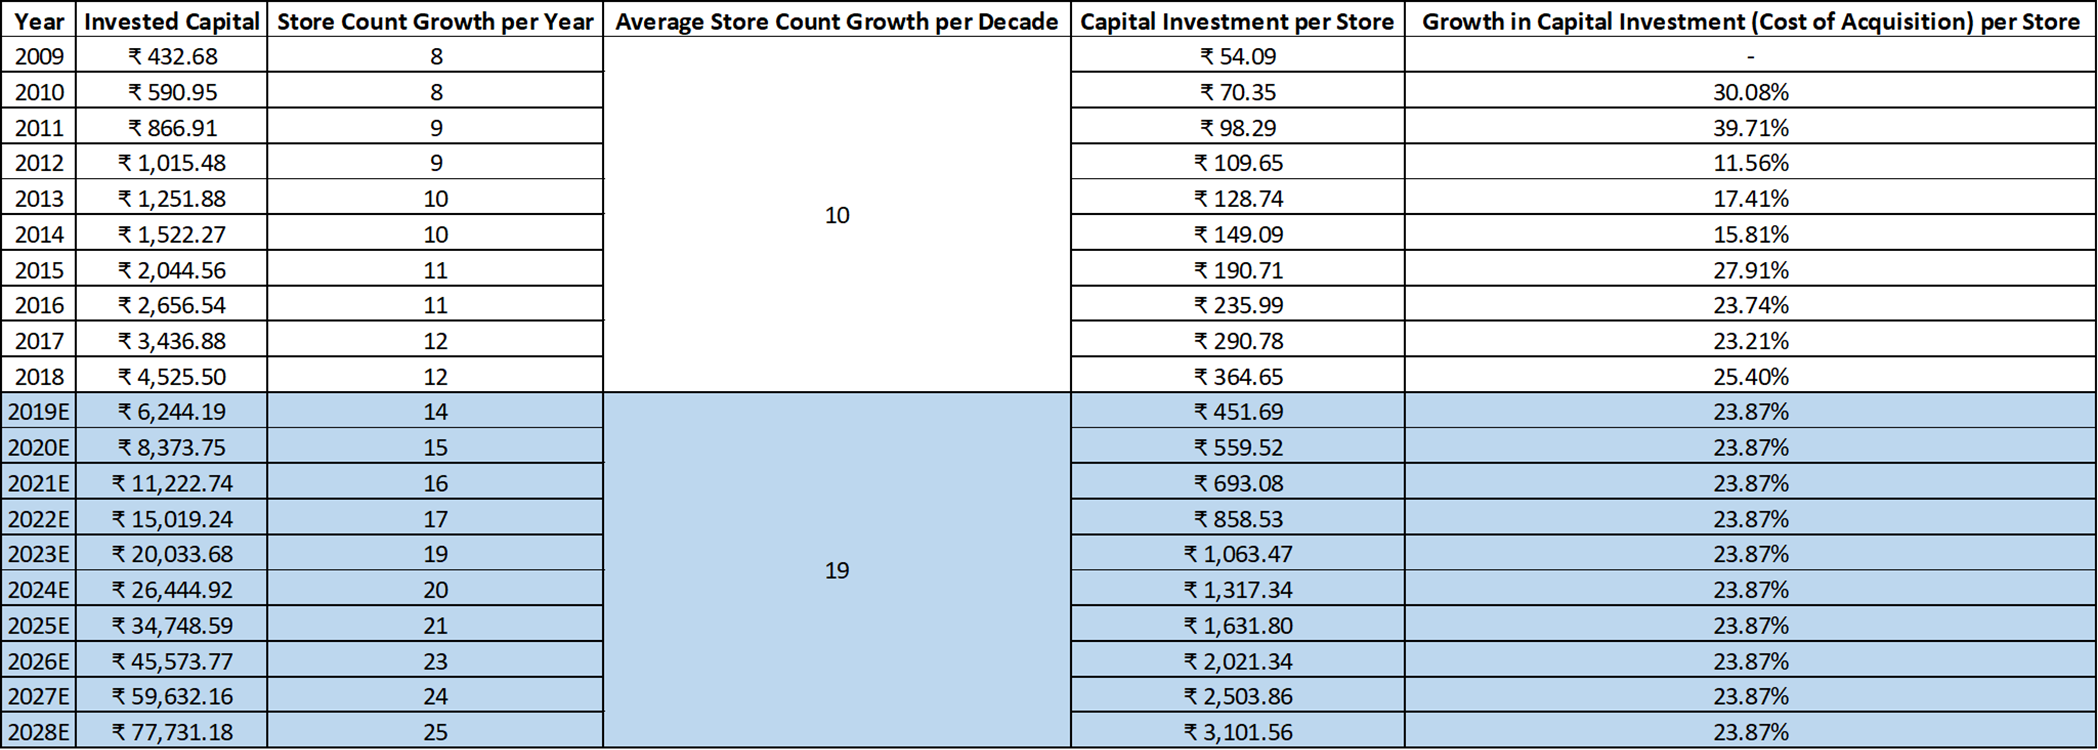
Again, according to the same article, DMart’s CEO plans to boost the store growth per year from 10ish to 15-20ish for the next decade. We can see both of those opinions roughly correlate in the ‘Average Store Count Growth per Decade’ column.
You can download the excel and see for yourself: DMart Growth and Capex.xlsx (11.7 KB). Numbers were taken from Screener and my model.
For the remainder of 10 years, it is simply a question of enacting the universal truth that as companies become huge, their avenues for growth decreases and hence, their revenue growth rate itself. Eventually, that growth slows down to half of the long-term Risk-free Rate in India (The reason for which I attempted to explain a few posts back).
1 Like
I’m sorry you feel that way. If you are genuinely interested in understanding the model, visit my thread on the same. I am always open to constructive feedback. If you’re simply trying to throw stones, I’m afraid I cannot be of any help to you.
My offer still stands, for comparing my Valuation to yours. As already mentioned, I do not care about the method employed. If you have some kind of logic in justifying D-Mart’s price, I’m most interested in listening.
Nice attempt, but you are mistaken.
Market Cap is the Present Value of future free cash flows discounted at the Cost of Capital. And so, it is only logical that for comparison purposes, Capex should also be discounted at the Cost of Capital.
Rs. 719479 Crores discounted at 14.23% for 21 years becomes Rs. 43,992 Crores, which is roughly 43% of the current Market Cap of Rs. 1,00,677 Crores. The rest, as you have already figured out, will be the PV of cash flows, both positive and negative.
1 Like
Hi @edwardlobo
The gap between the cmp and the actual unseen intrinsic value of a co is made up of two components. The actual gap itself + the error of investors in estimating that gap.
While errors are inevitable as the future is uncertain they cant be huge as otherwise it defeats the purpose of valuation even if you use the most appropriate tool.
If lets say 100 intelligent analysts value dmart independently and state its true value and if one was to create a normal distribution out of that and if the standard error of that distribution is unacceptable, then one can conclude that something is wrong with the estimate. The range of error has to be small - it cant be i would value dmart somewhere between 1000- 2000. Max error should be +/- 10% of your estimate.
5 Likes
Bheeshma
Dinesh’ value is off by roughly 25pc
What you are advocating is efficient market theory
Read up margin of safety by Seth klarman, there are many examples there of stocks trading at 1c and going on to trade in Full dollar value and sometimes double digit dollars
That book sells for more than a thousand dollars but there are copies on the net
Dinesh, I don’t want to make this into a who is correct thread
I think we have discussed enough as you would see from my number of previous posts I don’t have enough time
I don’t use complex spreadsheets anyway thanks for your spreadsheet
There are many good companies, if you feel this is expensive I would spend my time on the scripts I find cheap but please don’t be offended. If you feel you can contribute here please do so even if your view is different
That’s exactly why I’m asking you to share your notes. Your method is obviously different from mine. That’s why I’d like to see where you stand when it comes to valuing DMart…
If you’re busy, then fair enough. I only asked because you said you have an automated tool in Screener, which shouldn’t take much time at all.
1 Like
Hi @edwardlobo
Not sitting in judgement here!
All i am saying is that if you give a company to value to a bunch of people that you trust and if they all come up with widely differing estimates then one should conclude that valuation is pointless as there is too much estimate error. If on the other hand if there is reasonably small gap in estimates , then there is a purpose to valuation.
My comment is not on the methodology but on the variance of the estimate provided by the methodology. For e.g Dinesh has come up with an estimate of Rs 1168 for dmart.
I know of several individuals who have also valued Dmart independently ( all smart and proficient in valuation) and have come up with estimates ranging from Rs 500 to Rs 3000 using DCF. This kind of defeats the purpose of valuing cos using DCF in my view. Maybe there is something wrong with the tool, the assumptions or the analyst. I dont know. But variance cant be this much. That’s all i am saying.
4 Likes
I’d like to interject by saying that variance can be that much. Opinions form markets, right?
Value is created from cash flows, the growth in cash flows and the required discounting of those cash flows. Any difference in any of these 3 areas between Analysts will create a variance.
Ultimately, with a stock, you’re buying a story. You’re trying to attach numbers to that story. If the numbers give you a value that’s within your comfort zone, you think about buying it. If not, you don’t. Why beat yourself up over what 1000 people think about the company?
For academic purposes, that’s actually fine. But when my own money is in question, I only listen to myself / question my own assumptions.
5 Likes
I agree @bheeshma, sorry to have misunderstood
Basically if you take all capital of Dmart and put it in an Fd at the end of 20 years you’d get say 500k whereas their business turns it into 700k plus the interim cash flows that I haven’t counted
Dcf Valuation is not an accurate tool so if the present value of invested capital is more than sp I don’t see a point in trying to arrive at an accurate value for an impossible figure
Dinesh
I can upload the spreadsheet but it’s back of the envelope just numbers
I don’t even mention the name of the company
It pulls last profit from screener, and has formula for npv and terminal value
The growth percentage is a backsolver from excel
What it does it for the current valuation based on cost of capital being roughly 18pc what growth is required and over what period
I then decide if it is possible for the company to surpass this growth and by roughly how much. This part is down to individual assumption
My required growth for current valuation came to 13pc
If it grows at 30pc, I see a large gap
I’ll send you the spreadsheet in your email but it doesn’t have any narrative
I have made scripts that went through each company on screeener with a time delay so I don’t overload the server but I could use numbers from any website that hosts them
This gives growth required for all companies
Some have zero or less like thirumalai
Markets can take for ever to notice the gap so I then research into these companies to see if there is some event like expansion that will bring this difference into spotlight
You may decide to put your money in FD. But interest rates in an FD does not correlate with expected returns in the equity market at all. IIRC, FD rates are at 6%, while the markets returns at least 13% on average.
You’re essentially discounting one figure at 6% (CapEx) and discounting another figure at 13% (Market Cap) and trying to compare the two. Anyone with any ounce of knowledge on Corporate Finance will tell you why you can’t do that.
If you’d still like to stand by your answer, then I don’t think we’re having a constructive dialogue at all, with me trying to explain why you’re wrong and you simply repeating what you’ve already said.
1 Like
I invest into a company purely because it gives better return then the next best thing
You take discount rates from textbooks, I like to take them from real life
100k in Fd or 100k in Avenue?
“margin of safety” - seth klarman
"Any attempt to value businesses with precision will yield values that are precisely inaccurate. The problem is that it is easy to confuse the capability to make precise forecasts with the ability to make accurate ones.
Anyone with a simple, hand-held calculator can perform net present value (NPV) and internal rate of return (IRR) calculations. The NPV calculation provides a single-point value of an investment by discounting estimates of future cash flow back to the present. IRR, using assumptions of future cash flow and price paid, is a calculation of the rate of return on an investment to as many decimal places as desired.
The seeming precision provided by NPV and IRR calculations can give investors a false sense of certainty for they are really only as accurate as the cash flow assumptions that were used to
derive them. The advent of the computerized spreadsheet has exacerbated this problem, creating the illusion of extensive and thoughtful analysis, even for the most haphazard of efforts.
Typically, investors place a great deal of importance on the output, even though they pay little attention to the assumptions."
1 Like
However, you’re discussing about the Market Cap of the company, which is decided by millions of people based on the average returns in the index.
You’re free to do whatever benchmarking you want. But comparing it with market standards and claiming that the market is incorrect is funny at best.
Banks FDs and Equities do not have the same risk. Actually, if you consider that you only require 6% rate of interest, I’d say go ahead and invest in D Mart. At 6% discounting, DMart’s value is way above its current price.
However, “theory” holds that since NIFTY itself can return more than double that amount, it would be foolish to invest in DMart.
1 Like
Yes ofc different opinions form the market. However investors trained or inclined towards a certain valuation style should come up or be able to produce similar if not exact estimates. I am talking about a carefully selected bunch of investors who think in the same way and whose judgements you place value on.
Hypothetically, if the super investors of graham and doddsville were to value a co, the minimum expectation is that their estimates would differ but would be in a narrow range.
If these super astute guys come up with highly different valuations then where is the sanctity of the valuation process is the point i am trying to make.
These views reflect my own experiences. I also think the markets are quite efficient in pricing. Give them time and they will price the security accurately without fail.
Good discussion though!
Best
Bheeshma
6 Likes