
Over the years I have used several methods to find new stock ideas including reading news, IPOs, new listings, magazines, recommendations from friends, stock screeners, MF top holdings etc. However, one method that has consistently worked for me is to quickly scan everything that is available to buy and then bookmark the ones that are worth further digging.
In order to scan all the 3000 odd companies that trade on NSE & BSE quickly , I extract high level financial data from a corporate database which I have subscribed to. It can also be downloaded from screener.in. Once this data is in Excel, I use a set of charts to quickly visualize the important numbers from income statement, balance sheet and cashflow and important ratios for last several years on a single screen. Screenshot below shows how a typical screen looks like
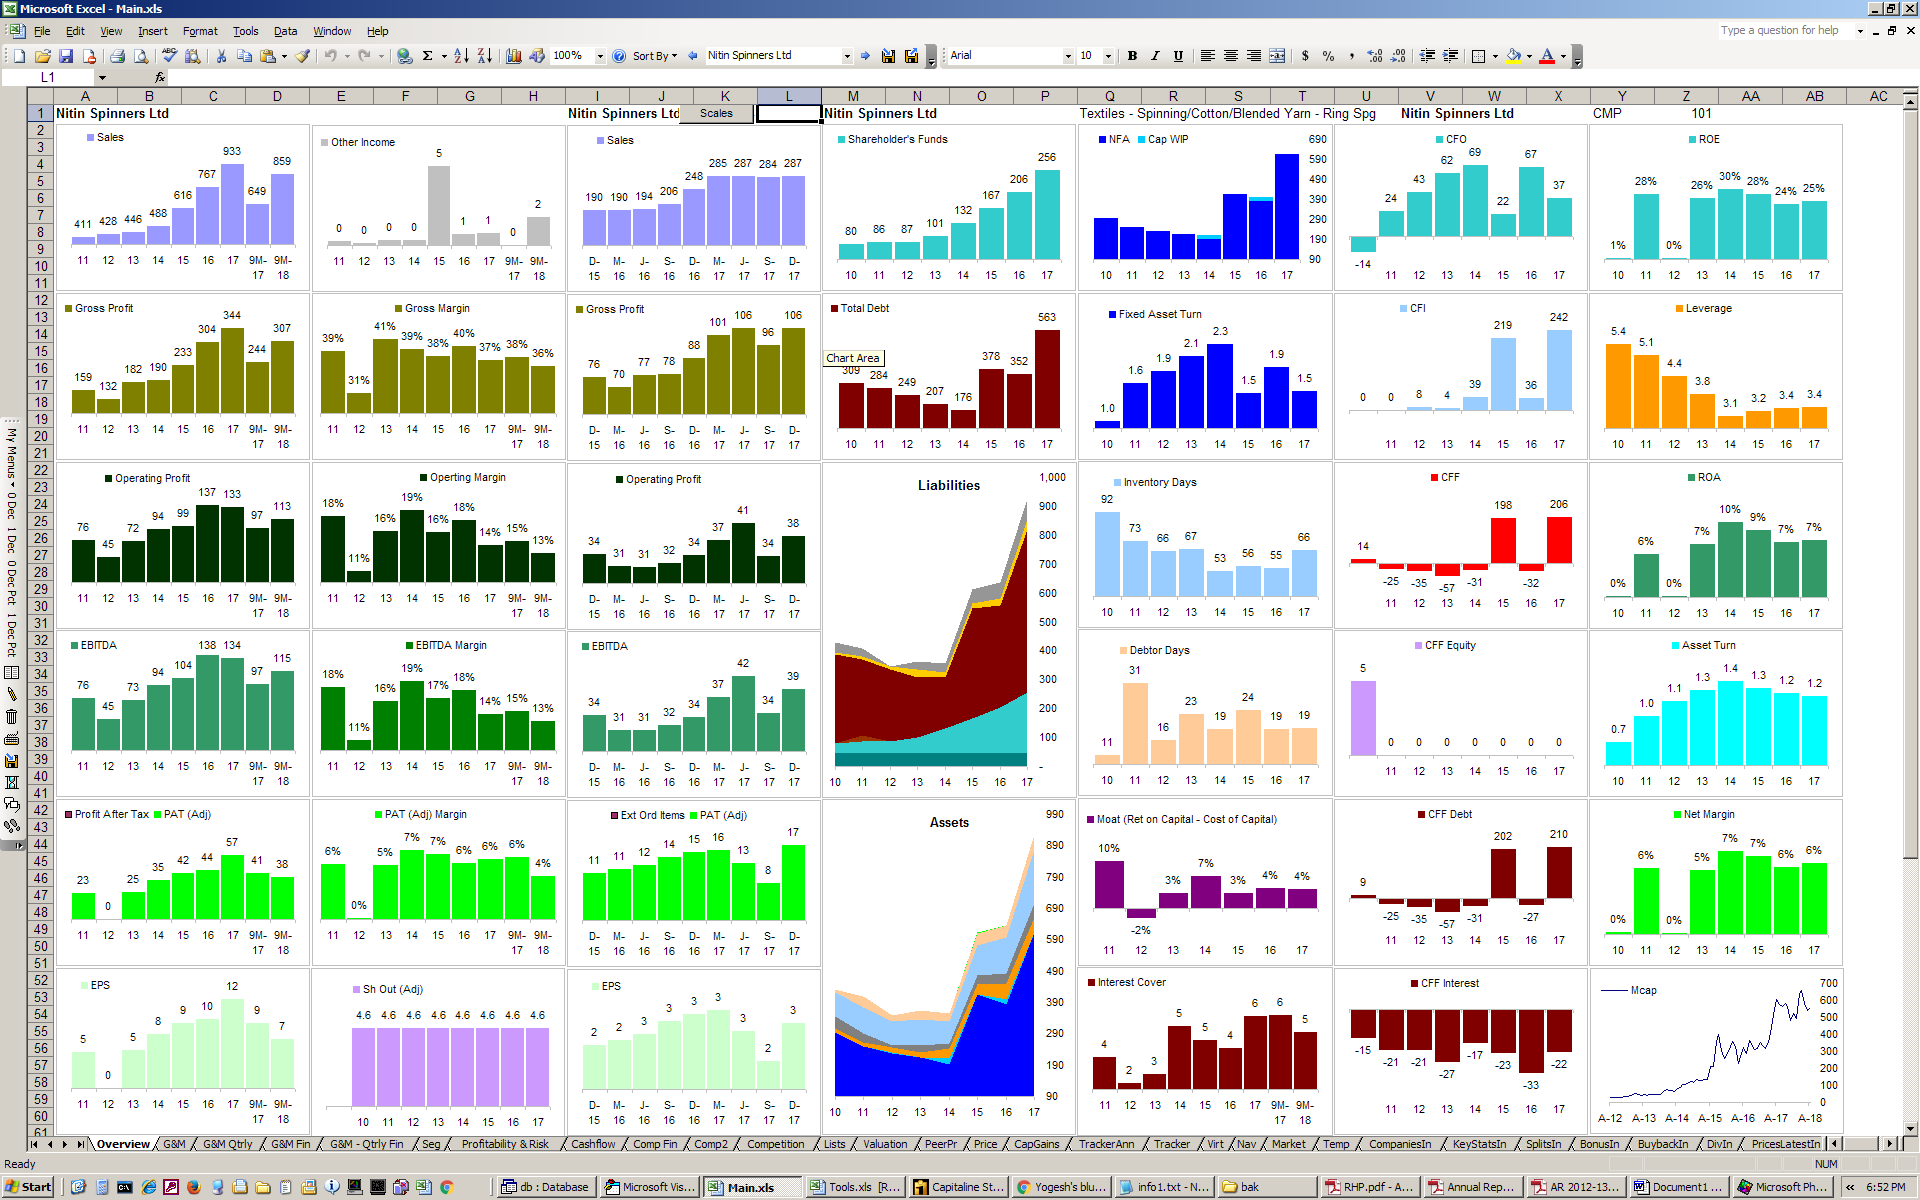
Story of a company in 40 charts
This screen lets me quickly check how the sales have grown over the years, if the sales growth has trickled down to gross profit, operating profit and net profit, how the book value has grown, if the debt is growing, how has the cashflow kept up with cash profits or has the receivables and inventory ate up all the profits. Cashflow analysis help me analyze if the company is able to fund it capex with CFO or it had to go external funding. DuPont analysis quickly gives an idea how efficiently company has utilized its capital and if the high ROE is a result of higher leverage or higher ROA. I can also check if there any structural change in its asset turnover vs operating margin trade-off. Finally, the market cap chart (on the bottom right corner) shows how market has responded to the developing story.
If a picture is worth thousand words, a chart is worth thousand numbers. 40 charts on this screen tell the story of a company as it unfolded over the last decade. It literally takes me just a few seconds to reject a bad company. I cycle through all the companies in the database either by alphabetical order or by market cap. Sometimes, I end up rejecting few good ones too, but I am OK with that. Within 2 to 3 weeks I am able to scan all the companies in my database. I go thorough this exercise at least once a year.
Once I go through charts of several hundred companies, a good company will quickly stand out even if it does not meet all the characteristics of a good company. Your mind gets trained in identifying patterns of a good company. A visual image of a company based on its numbers is far more convincing that some qualitative factors like visionary management or key shareholders. This method also give me an assurance that I have looked at all the available options before making a choice. A stock screener on the other hand makes you wonder if a good company has been wrongly filtered out only to discover it later after the price has ran away.
Normally I bookmark about 200 to 300 companies that stand out for further study. Usually, only about 20 to 30 companies are replaced each year. Rest of them remain the same. Out of these, based on fundamentals of the company, I create a shortlist of 20 largecaps, 30 midcaps, 50 smallcaps and 10 SMEs for further analysis. Out of these 110 companies, I further narrow my focus to 50 and then 20 based on valuation. After that its my gut feel. I end up having about 8 companies in my portfolio from this 20.
This process is similar to how we buy a car or a mobile phone. You start with everything that is out there, make a shortlist, then go for a test drive before making final choice.