
The wealth creation spots and trends, list of winners
Wheel of wealth creation
I focused on capital appreciation created by my database companies numbering total to 4427. This obviously exclude the distributed dividend, but considering low dividend yield it wont materially impact structural view of chart vis-a-vis price. Though it may have an impact on capital allocation by company, lets include as one criteria while chasing the top performers down the line.
Sanguine to look both a long term and medium term view. I have taken both price performance of 10year and 5 year. The current market cap minus the initial value (either 5 year or 10 year) gives me the amount of capital appreciation of wealth created.
10 year wealth creation wheel
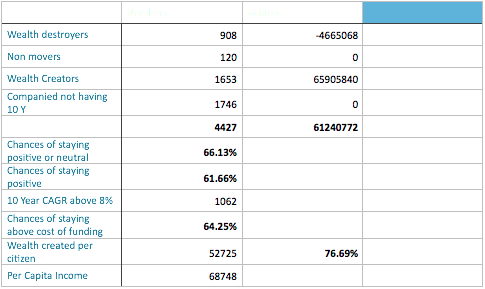
Interestingly there are 908 wealth destroyers, lets analyse as second phase. 1653 companies created a positive wealth of 65906 billion INR, with adjusted negative wealth destruction it comes around 61241 Billion INR. If you divide with current population stock market has delivered 52752 INR of capital appreciation against every citizen of India! And this is a bouncer when we take per capita income around 70K, close to a month savings. But this doesn’t tell any story actually, our Gini Coefficient is one of worst in world (disperse income or wealth distribution), countries like Thailand Sri Lanka are ahead of us. However the data like any other macro data is prone to bigger error in India as people don’t disclose income here properly. In fact IMF feels the inequality will further rise. In short our wealth is concentrated, nothing new….we have embarked capitalism after all!
Another interesting aspect is theory of probability. 1773 companies have either create a positive wealth or neutral wealth. That’s a whopping chance of 60% plus staying positive from total universe of active companies. This means you have 1700 choices to choose from 2681 companies to avoid wealth destruction. I wonder why people stay away from market? I pruned the minimum rate of average PLR (capital gain of 8% would have been around 10-11% interest cost with tax effect). This indicates in 64% of cases you had a chance making money more than fixed deposit. Again my head rolling to these fund managers managing public money, I guess there would be 1000 plus people here in this forum who will do better than these wealth wizards!
Wealth creation wheel- economic indicator and sectoral view
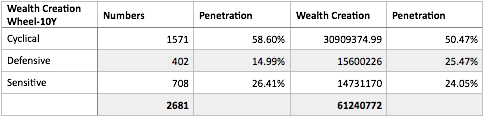
No surprises as positive wealth creators maintain the same classification of market with cyclicals having 50% wealth creation value, followed by a narrow fight between defensive and cyclicals. This is in line with 50% composition of market constituents were cynical (please refer to previous post).
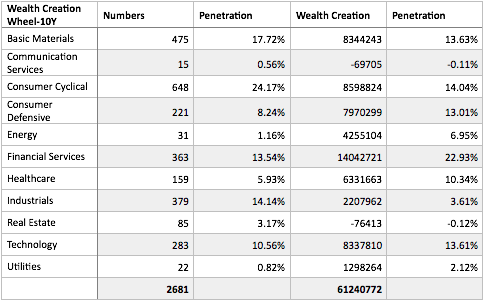
The big 4 sectors remain financial services, technology, consumer cyclical, basic material. A new addition is health care among wealth creators, expectedly pharma companies have out performed for a considerable period more than weightage in market composition. Even consumer defensive performed reasonably well.
How does a 5 year view of wealth creation wheel look like?
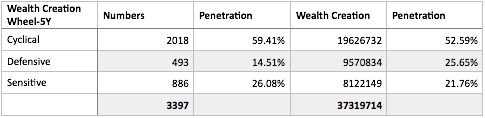
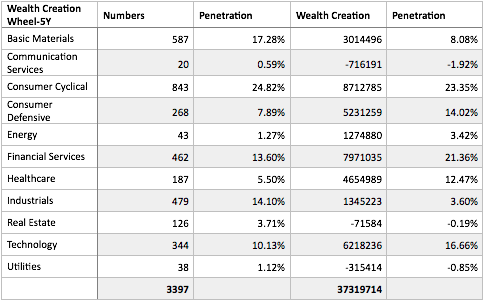
Consumer cyclical gathered momentum in last five years in terms of performance, financial services remain a sweet spot, technology is trying recoup old glory, health care trying nudge ahead ( not so convincingly), defensive sector maintain its status.
Industrial View of wealth creation of Leading Sectors- Basic Material
- I have attached file to overview the data.
One is steel which got severely battered, next industrial metals and minerals. In net net there is a wealth destruction in industry. Look at speciality chemicals where 2/3rd wealth is created during last five years. Building material a significant component just trying to hold on at same level.
Industrial View of wealth creation of Leading Sectors- Consumer Cyclical
- I have attached file to overview the data.
One of crowded sectors, but heavily concentrated. 75% of wealth is created by auto manufacturers and parts. Tv channels are one of major beneficiary of wealth creation at the expense of jewellers and textiles in last five years.
Industrial View of wealth creation of Leading Sectors- Consumer Defensive
- I have attached file to overview the data.
House hold products, packaged foods and tobacco remain the major wealth contributors during last decade. On a five year scale nothing much changed.
Industrial View of wealth creation of Leading Sectors- Financial services
- I have attached file to overview the data.
Banks, speciality finance, credit services are major pillars of this sector. Banks have suffered off late at the cost of speciality finance i.e. housing finance partly contributed.
Industrial View of wealth creation of Leading Sectors- Healthcare
- I have attached file to overview the data.
It’s all about pharma having almost 95% share across long and medium term.
Industrial View of wealth creation of Leading Sectors- Technology
- I have attached file to overview the data.
No surprise of IT service dominance of 90%.
Key take away from wealth creation chunking
- The wealth has been created more or less in line with market classification of cyclicals, defensive etc; no surprises here.
- Despite of cyclical nature of business auto, financial services, hold on to their fort. industrial mining, steel have suffered among cyclicals.
- Defensive hovers around pharma, personal products etc and continue their same pattern of dominance.
- IT services remain big boy of technology, we are yet to see product company impact on sector/industry.
- Speciality chemicals is a clear winner recently.
- However all these number crunching doesn’t tell much beyond a historical significance. Whether trend will remain or not , obviously there is no guarantee. Yet it does point to type of competitive advantages and business model studies we should be doing.
We haven’t spoken about performance of the wealth creators, that’s key focus and further driving down.
The TOP performers
I have tried to utilise mix of methods to select the top performers. One take the fastest wealth creators, second is greatest wealth creators, third consistent wealth creators.
Step 1: I have pruned the data for companies having 20% CAGR on last ten years.
Step 2: I shorted the step 1 data for minimum market cap of 100 crores (this is a low number actually) to avoid low base effect.
Step 3: I emphasised those companies only where 100 crores wealth has been created at least.
Step 4 to 6: Repeat of step 1 to 3 with a data for 5 year period.
Step 7: I have shortlisted the consistent performers who are appearing in both long term and long term.
Basically we have collected companies having highest CAGR in order, at least having 100 Cr market cap and created a 100 cr wealth in last 10/5 years.
I got a list of 224 companies, as I wanted to focus 100 companies only; I preferred to choose 115 companies. The additional 15 companies is to ensure low float, low base or any other unwanted data crept in case! That will give a margin for error.
Industrial. Sectoral View.xls (53 KB)
List of top performers.xls (88 KB)
Key notes before deep dive
- All of them have compounded at least 30% CAGR wealth for shareholders.
- Lot of popular names like Symphony (proud to be an owner) is 978 baggers in last ten years. Other usual suspects like Ajanta Pharma, Vinati, PI, Mayur, Eicher….all there.
- On a ten year performance 70% of top performers are cyclical, this is ahead of composition of 50%. Relatively cyclicals have out performed.
- Other than cyclical and defensive, the sensitive have under performed, mostly due to lacklustre performance of technology sector against market.
- Health care is turning the table with a out performance and financial services have retained its share.
- If we see a comparative performance of top guys in 5/10 year scale then not much has changed in terms of industry. Financial services, basic material, health care, technology have performed more or less on both time horizon. The performers have maintained status quo despite performance fluctuations at a over all level as discussed above.
I have attached a file listing the top performers (The Jewels) and their overview.
Next the real journey begins, where we go down the hill for the 115 jewels (most likely some of them further will be pruned) to study trends, patterns and any other meaningful relationship. The statistical trends may loose their significance after all effort being historical data, I am keeping my fingers crossed for now.
Note- past performers may not repeat the story, already growth acceleration have come down in few companies like Symphony. Already 46 of 115 I could see bucking the CAGR trend downwards. But what it tells it the structural view of market doesn’t get changed over night despite of individual names. That helps in focussing on the kind of research we need to do. Further it may help in understanding how market is reacting to different value drivers such as management action, growth, fads etc.
Good wishes and happy investing.