
In this business, pipeline drives order book, order book drives headcount and headcount drives revenues. Headcount thus becomes a lead indicator for the revenues the company reports. CEO Mr. Manoj Raghavan said as much in the recent conference call:

We have quarterly headcount numbers reported by the company since Q1 FY18.
I looked at the reported headcount and calculated its relationship with the company’s revenue. Further, it is assumed there would be a time lag between addition to headcount and its reflection in revenue. A month or two will be spent in settling down the new recruit, training her on the project specific tasks etc. till eventually she becomes billable and adds to the revenues.
Hence, headcount at the end of a quarter are directly correlated with the next quarter’s revenue. That is, headcount as on 31st December 2020 generates revenue for the Jan to March 2021 quarter, headcount as on 31st March 2021 generates revenue for the April to June 2021 quarter and so on. A regression equation can then be used to predict the revenue for the quarter Jul-Sep 2021 based on the reported headcount as on 30-June-2021.
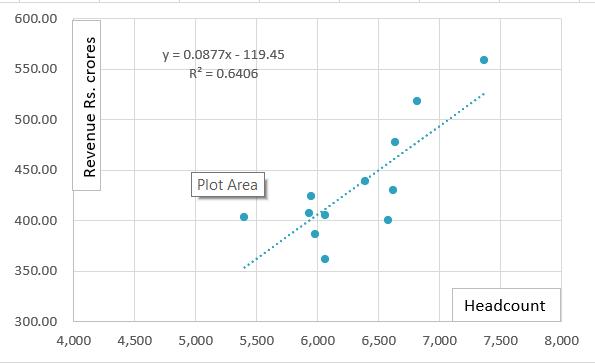
The resultant function is y = 0.0877x – 119.45 where x is the headcount at the end of a quarter and y is the revenue in rupees crores for the next quarter.
The company’s reported headcount as on 30-Jun-2021 was 7914. Using the above function, we get a value of y=574.61 when x = 7914. The function predicts a revenue of Rs.575 crores for Q2 FY22, which gives a growth of around 34% YoY and 3% QoQ.
One can update this data on an ongoing basis. An environment of higher than average pricing power will lead to higher revenues than predicted by the equation. The above may be a base case scenario for the next quarter’s results. When the company declares its numbers next month, the headcount needs to be watched with as much interest as the revenues, if not more.