
Learning, unlearning- biased?
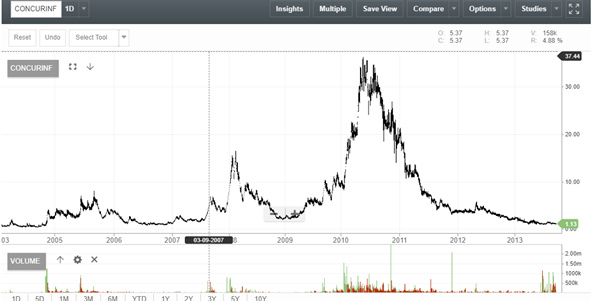
Before I move to another stock story let us look back to learn lessons from Concurrent Incident. But before we get specifics of lessons I wanted to tell you something. Never listen to anyone with a preconceived notion in mind or even impression. That includes me or anyone, if one appears on Television must be a great investor, it’s Mr Munger; how can he be wrong? They have been right or wrong in their real life, we are not able to read them properly perhaps. I am a victim of this, some changes desperately trying to do; but it would require time to wire the right side of brain. I will give 2/3 important points where I have suffered severely in past:
- Buy and hold- because I am long term investor. One of chief reason for folks in stock market to disappear. There is no problem with buy and hold but the adjective is missing; ‘Winners’.
- Getting more than mutual fund- market is not there to pay you a return. Who asked you to compare with mutual fund? Have you met people who cracked even 200% plus in a year? Market is like mountain, it gives opportunity to explore and conquer; doesn’t discriminate anyone.
I want to cover much more in other thread. Take them as pinch of salt if they sound contrarian to you if heard something else anywhere. Additionally, my own survival and mistakes also aspers question on them. But I am trying to align my footprint to the people who has demonstrated and shared their footprints.
Come back to Concurrent story. Could we have sense somehow and saved ourselves? I think yes. This was a classical accumulation and distribution story. First key point would be:
The technical footprint
The man who most understood about crowd behaviour in a stock market was Jesse Livermore. Aptly put he simply defined, hold a stock till the time it behaves normally. Exit when stock behaves abnormally. As per him the behaviour of a stock depends on three aspects a. traits unique to the stock b. traits adapted from group it belongs (sector/industry) c. traits applicable to economic of demand and supply.
I would cover all of this in ‘Speculation and Technical analysis thread’. For now, I want to divert your attention to point c i.e. economics of demand supply. No body perhaps better understand modern economics other than John Maynard Keynes. If you customise his idea of ‘constructive price behaviour’ in the stock market it would be:
a. When more people wants to pay a higher price, price goes up. (Demand outstrips supply with an agreement for higher value).
b. When more people scared of a higher price, prices goes down. (Supply outstrips demand with an agreement for lower value).
c. When buyers and sellers perceives a fair value in market, price equilibrium is established.
Both buyers and sellers are disengaged themselves from buying and selling activities.
Let us focus on point no 3, what it says? When buyers think possibly stock won’t go up further he stays away. At the same time sellers think more price appreciation to come and doesn’t sell. The volume goes down, price contracts week after week. It comes to a point which looks like a straight line with very low volume each day.
But the beauty of speculation is it can’t remain static in a position for very long. Price breaks out of this range supported by either buyers or sellers. Let’s talk about these things in other thread. In a nutshell every item where fair value is determined by demand and supply in a free market shows up a constructive price behaviour. That means:
- Price shoots up initially.
- Profit takers start taking profit till they exhaust their shares.
- Fresh buyers disengage themselves assuming no further juice left out.
- Volume comes to a standstill; price volatility becomes insignificant.
Example- Tinplate
General Disclaimer: I do not have any shares other than Shree Cements. However, my wife is invested in stocks, trades in stocks including Tinplate. And I may have influenced in her decision making.
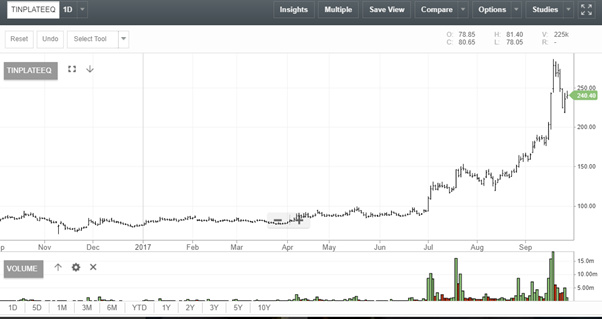
See the rectangle piece there, absolutely volume has gone out with both buyers and sellers disengaged. Look at the breakouts after base, huge volume with price increase. When pullback happens it happen with a lower volume and lower volatility. Classic economical behaviour of buyer bullishness. Will this happen when intentional accumulation and distribution done?
One has to accumulate at lower price and distribute at higher price to make money. The distributor who is given responsibility will make sure price doesn’t fall beyond a point or else distribution would resulted a loss. This is a critical point for manipulative stock, despite of market conditions stock will show strength at a strong support level otherwise dumping point.
See the two tall bars on right side, hardly any price movement with huge volume. This picture would be more clear from money control.
You would see lots of big volume bars between Mar and Aug with very little price movement.
Positive crowd behaviour- big volume big price increase
Negative crowd behaviour- big volume, big price decrease
Suspicious crowd behaviour- big volume, no price increase.
Confused crowd behaviour- low volume, big price increase. Low volume, big price decrease. I won’t call confused as manipulative.
The manipulative stocks won’t demonstrate a constructive price behaviour.
How does promoter managed to accumulate so many shares at lower price?
No one plays a hard ball game. Good thing with crook is they don’t mind to be called as crook as long as their benefit keeps coming. Meaning they won’t accumulate 100% and distribute 100%. It’s number of shares that needs to be distributed, if you target 50 Cr, then say 1 Cr shares needs to be distributed in a such way it fetch 50 Crs.
Focus on public category holding more than 1%. See the names (use the BSE website), some of them vanish and new names appear. Second how supply happens from public category, then in the end supply didn’t come back to this 1% or more name. It went to public, let’s check how:
In Dec 2007- 6569 individuals were holding 60.88%. If you take out 1% category or more it would be around 19%.
Dec 2008- 6455 individuals holding 58.42%. If you take out 1% category percentage moves to 20.
Dec 2009- 6662 individuals holding 34.14%. If you remove 1% category percentage comes down to 15%. Accumulation time.
June 2010- 9232 individuals holding 52.46%. Remove 1% you will get 24%
Dec 2010- 11147 individuals holding 54.70%. Now remove 1% it goes up to 27%.
Sep 2011- 11749 individuals holding 57.43%. Now company didn’t provide any data for 1% breakup. SEBI hammered a penalty, who cares for 50000 Rs penalty? I have find most of this type company will violate when it requires the most in end.
Dec 2011- 11687 individuals holding 63.37%. Remove public category its around 42%.
Dec 2012 (last available)- 11180 individuals holding 68.85%. Remove 1% category you will get 45%!
Most of price actions happened between Jan 2010 to Aug 2011. Public handed 25% or more shares , game is over.
Again, it may re-start, new business model and new name. No surprise for guessing, E-commerce!
Let us discuss about fundamental landscape tomorrow or day after. What could have been done from fundamental numbers i.e. balance sheet and profit loss.