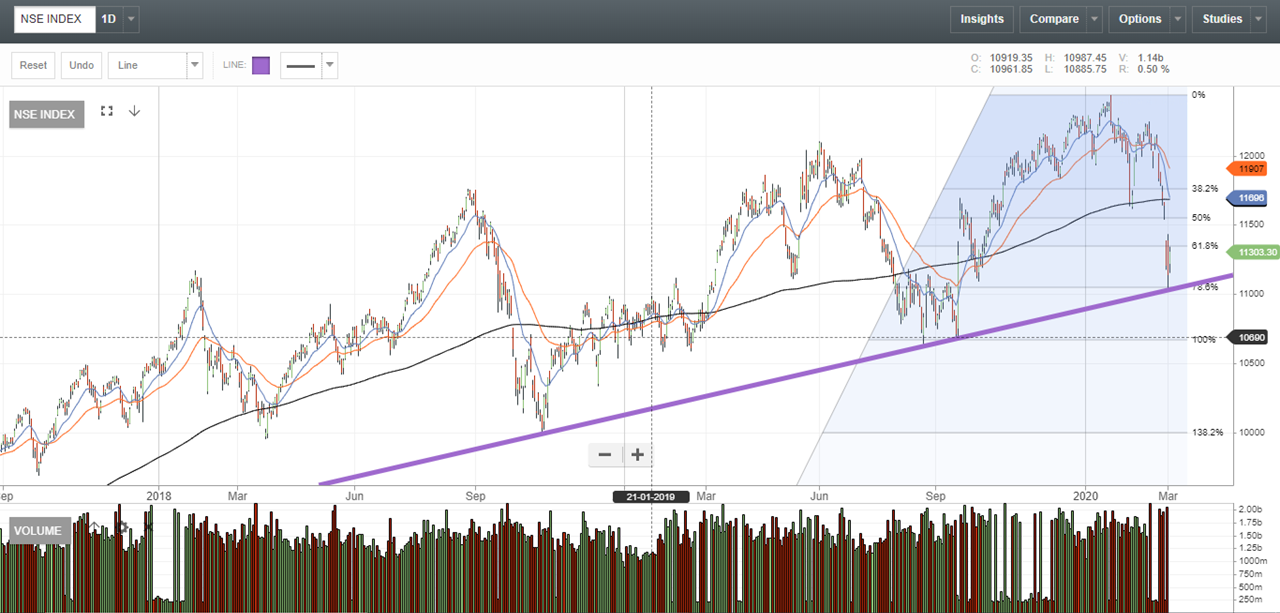
After slicing through the 61.8% level the nifty again rebounded sharply from the 78.6% level - another significant fib level and over the last 2 trading days has formed a clear bullish harami pattern.
Right now i think the stage is not the panic stage. If this downward trend proves to be a correction then its certainly healthy as no lasting uptrend can persist without corrections. Corrections are the lifeblood of any trend ( upward or downward). However, i am looking for signs of a good followthrough day ( strong upmove on high volumes) which adds further conviction that this is just a correction in an uptrend. If the trendline doesnt hold then there is certainly cause for concern but as of now i remain quite bullish despite the fall.
The trendline did not hold and prices have sliced through it like a hot knife through butter. The next stop is the 10670 which means a 15% correction from the top. The previous 2 corrections (aug '18 and jun’19) have also been 15% type corrections.
The most serious correction was the 2015-2016 correction where the nifty lost 25% from its top of 9119 crashing to 6825 and we are not in that zone so far - but not far away from it either
I have been reading up on market tops and whatever i have read suggests that the seeds of a top are sown in a steep correction - like the 25% correction of 15-16 which has led to a multiyear upward trend.
The 2018,2019 and now 2020 - have really thrown everything at you, but this one is quite a rough fall
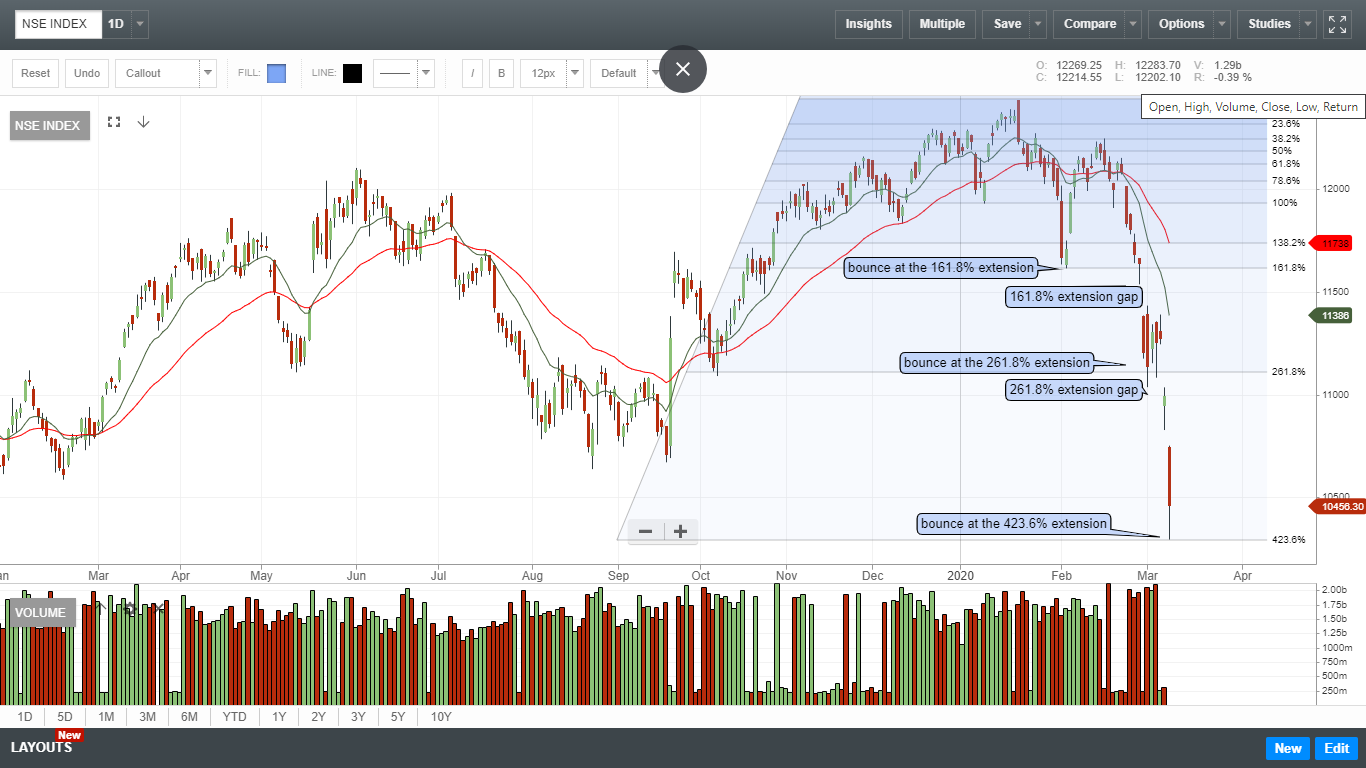
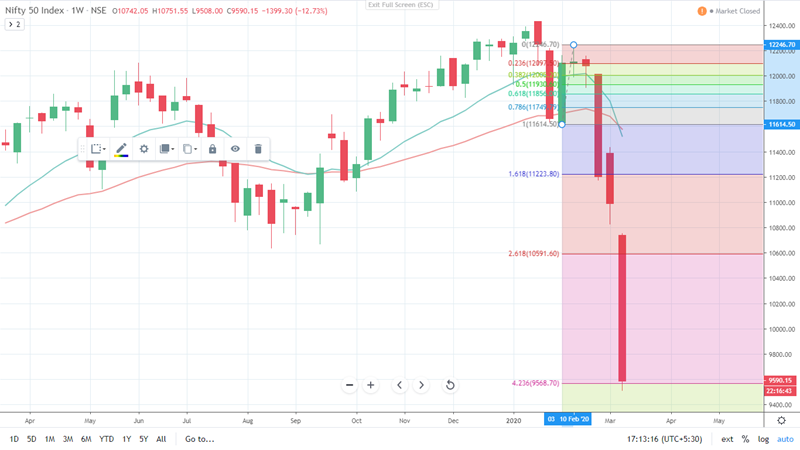
That is one hell of a fall. The next stop is clearly the 10,000 level where hopefully the market will find some support. It is in times like these that one realises that temperament while easy to talk about is 10 times more difficult to practise and put into action. The only sliver lining as far as I can see is that the market should reach 10k in a swift one time action rather than a protracted torture. Time to take the punches and on the chin.
At a technical level, the market does seem to have found some semblance of support at the 423.6% extension - which is the last barrier before 10k. If this holds (fingers crossed) and prices consolidate around this level for a 3-5 weeks then a base formation is likely. If not then one can expect prices to drop down to 10k swiftly.
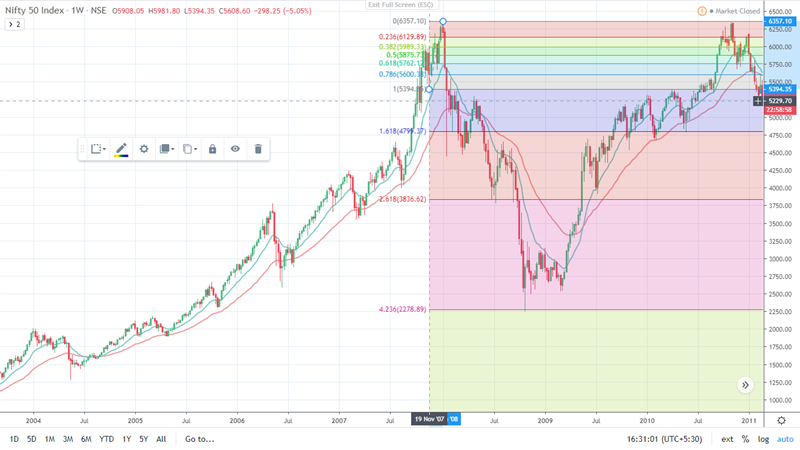
Some solace for my frayed nerves. If its true that history rhymes then the following charts do tell a story ( which would be validated in the coming days of course)
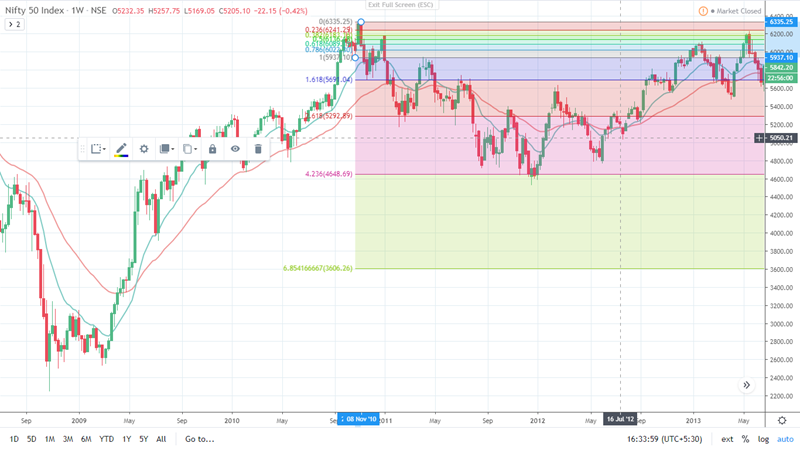
Following is the anatomy of 4 of the worst crashes in recent history ( all weekly charts)
2007-2008 correction. Bottom at 423.6% fib extension
Market is reacting to the news as they develop and we all know that the market is forward looking and usually discounts 6-8 months ahead. Unless something drastic is slated to happen in the coming months which is currently unknown (maybe some higher order effect) all the major known events - Corona, oil war and yes bank have been discounted. But in a developing situation one doesn’t really know
We won’t know if a bottom has been formed until a few months after it has been formed. To answer your question I think we are overextended but prices will have to consolidate for a few weeks at some level to give further clues. Historically prices have been known to bottom out at key extension levels like the 423.6% and 685.4% but no hard and fast rules.
Right now prices are just slicing through all support levels in anticipation of unknown negative events which no one knows will happen or not in the future
Hi, It did touched the level of 8653 today for some time and then bounced. Yes you are right a bottom can only be called bottom if it stays there for some time and going by today’s major swing in nifty most probably it will remain in your said range. We cannot predict all events accurately but i think there is some more pain left. Maybe today’s global market will give a clue.
This whole correction cannot be summed up with what happened today and what might happen in few days to come … Bottoms are of little use of meaningful accumulation hasnt been done , the volatility has to come down indicating that the anxiety levels are down. Also important is it witness the tussle between the buyer and seller in a price range. Eventually who wins out of this will decide the next wave which might be down as well.
typically if it’s the first wave of the correction then after a suckers rally we should see lower levels in next few weeks… If its only a vicious correction in a ongoing bull market than the previous high has to be taken out quickly.
Just my two cents
Regards
Divyansh
The simplest (and a legit) way to know if a trend has been broken or not is to draw a trend line.
The market has been trending upwards since the lows of 2008 in a channel. It’s a strong channel and has survived multiple scares across the last 12 years. Fibonacci retracements and extensions work well in conjunction with trend lines. The idea is to have a sense of where a fall in prices is likely to stop keeping a context in mind and to be a little less scared. Although I must admit, it was a harrowing experience for me as I have not seen such deep cuts to my portfolio due to market volatility.
In the coming days , weeks and months we just wait to see how prices develop around whatever levels you think are important.
My plan is to track and monitor if the long term trend is still intact and see how prices react to news that are coming in. If bad news is factored in already then prices should stop reacting to further bad news.
Some Web invoking -
Why do most investors fail?
Warren Buffett: Over time people get smarter but not wiser. They don’t get emotionally stable. You can teach people all you want, tell them to read Graham’s book, you can send them to graduate school, but when they are scared, they really get scared.
There have been 6 major corrections in the last 5 years
2nd March’15 to 8th Feb 2016 - 49 week - 24.68%
6th Sept - 19th Dec 2016- 15 weeks - 11.45%
29th Jan to 26th March 2018 - 8 weeks - 10.86%
3th Sep to 22nd Oct 2018 - 7 weeks - 14.87%
3 June to19th Aug 2019 - 11 weeks - 12.11%
20Jan to 23 March 2020 - 9 weeks - 39.58%
We are also in the midst of an ongoing correction in the index which has corrected roughly by 8% from the top.
From the top of March 2015 (8937) to current date (11050)- after all these 6 corrections nifty50 has grown by 3.9%. From 2015 to present day the indian GDP has grown by 6% or thereabouts. Interest rates have also come down with the 10y bond at 6.03% levels and the 2y bond at 4.39%.
In this scenario where interest rates are at 6% and cos in NIFTY 50 are generating an average ROE of 18% and a median ROE of 16% - it is entirely possible for the Nifty to trade at a price to book value of 3x which is where the index price to book is currently at (The price to book clocked 3.13x on 25th Sep 2020)
In my view, the index seems to be moderately overpriced and will see a consolidation rather than a downmove before resuming the uptrend.
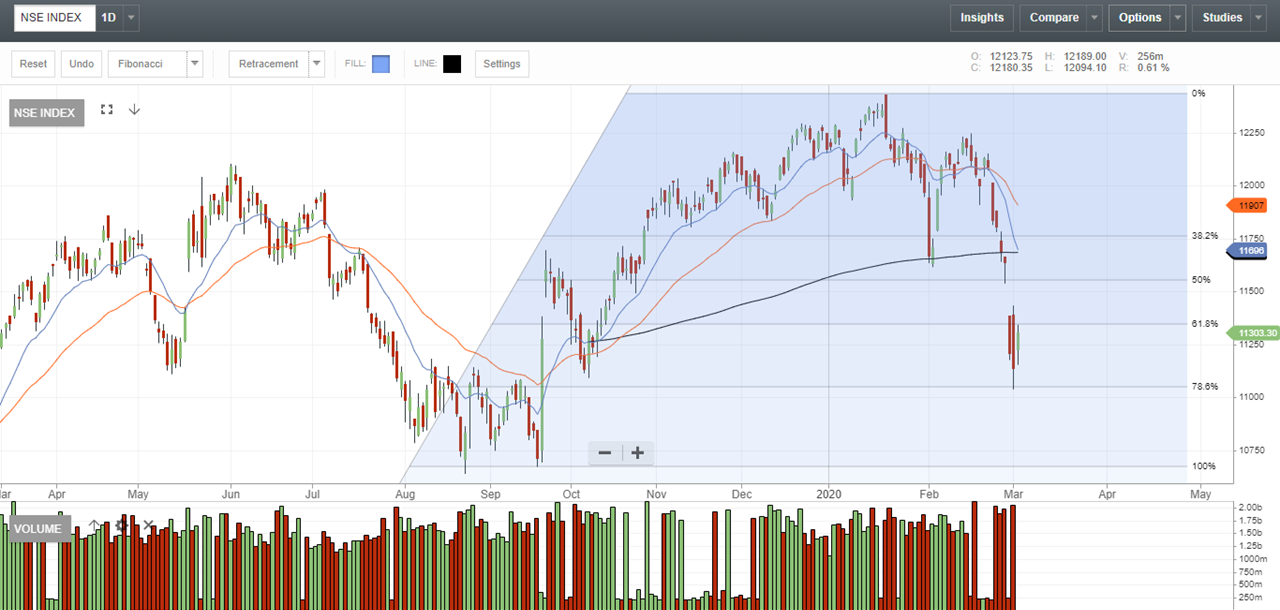
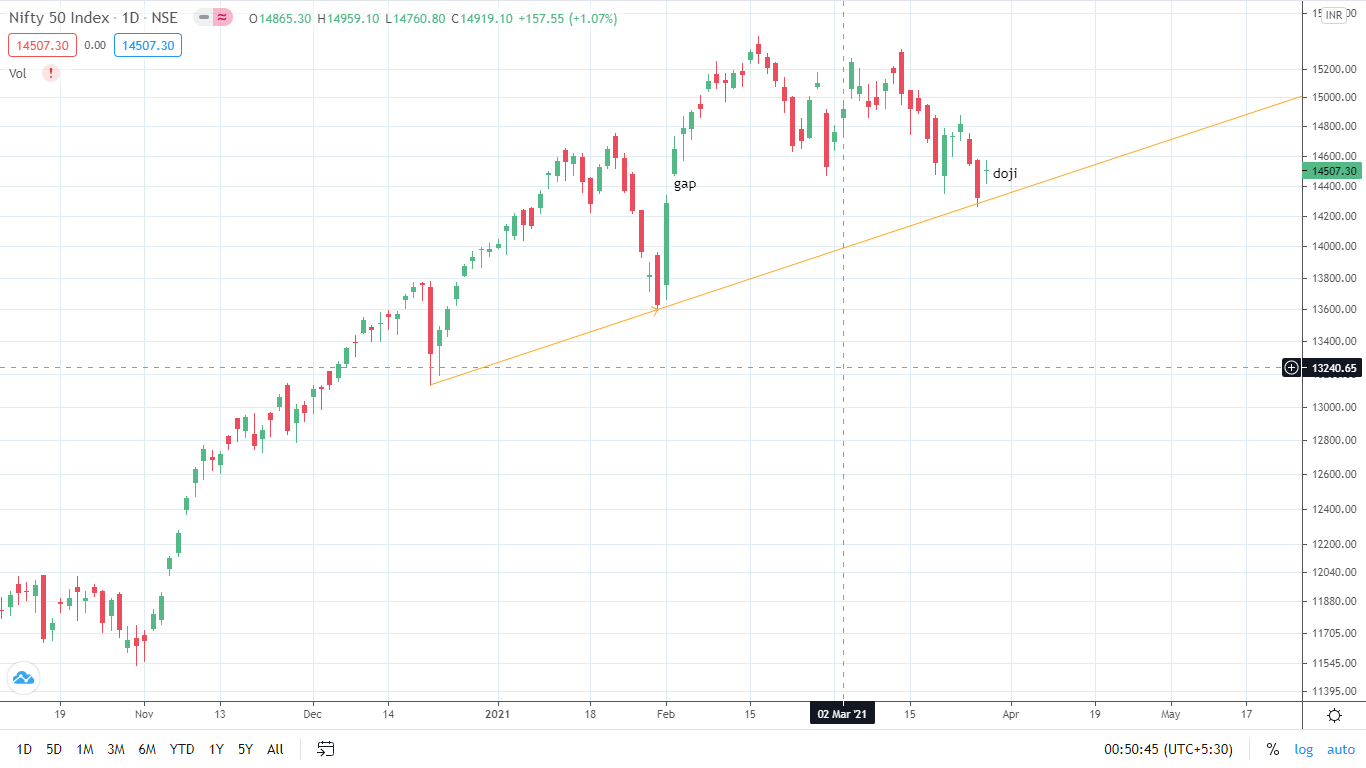
After a concerning few weeks where the nifty declined by 1100 points or 7-7.5% , the chart looks to be cautiously positive finally. The nifty came back to close the gap up that it had formed on 2nd feb and bounced of a 3 month trendline that it has formed and has also formed a good looking Doji indicating a reversal of the trend at the 61.8% retracement fib level. So a bunch of signals have happened in the last 2 days that indicate some cheer.
The main concern to me is the descending triangle that one can clearly see which if broken can signal much more pain and ofc the lower lows and lower highs which remain the cornerstone of TA. So that remains to be seen!
One often refers to the nifty p/e of 40+ to express overvaluation - however government bond yields are at 6%+ and economy is expected to grow at 9% according to popular notion, so dont see how nifty can go back to its long term average of 20 under these conditions.