For companies that can raise fresh capital when they need it, PB becomes very confusing. Banks like Yes and IndusInd raise capital every 2 years. This changes their PB. For example, IndusInd Bank had PB of 4.25 few days back. It raised 5300 Cr in QIP and suddenly the PB is now around 3.25. But ROE will change drastically with change in book value.
So PB alone is flawed metric. For HFC’s I would go with Punit’s view on looking at ROA, ROE and PE. One more metric that can be used with HFC’s is Loan book or AUM vs. Market Cap.
Gruh trades at Mcap/AUM ratio of 1. HDFC around 0.90 - 1. Repco at 0.65. And other HFC’s trade at lower multiple. HDFC has historically traded in same range and Gruh/Repco might keep in the range in future.
I think that P/B does not tell much for financial companies and whatever it tells can be misleading. I am borrowing from my earlier post in CanFin Homes discussion board. Please correct me where you feel that I am wrong and feel free to give your inputs.
Let me explain:
RoE = Earning / BV of Equity
PE = Price / Earning
PB = Price / BV of Equity
So, PB = PE * RoE
Even at the same RoE, Price to Book can rise to a much higher value if PE ratio goes up. I find much easier to interpret PE ratio, because it tells how much is the market paying for 1 rupee of current earnings. PE ratio depends on the growth in future earnings and their discount rate/risk and hence I can form my opinion about justified PE looking at the expected growth and risk of future earnings. PB tells at how many rupees is the market valuing each rupee of equity investment (book value). But, PB does not yield itself to an interpretation like PE where I can form an opinion about its justified levels looking at firm performance.
So, I use PE as the cause and PB as the effect and interpret all this as: if Market revises its assumptions of future earnings upward or lowers the associated risk then P/B will go up at the same RoE. So, the question that I ask myself is whether the company is doing something to improve its earnings and/or reduce the risks and try to judge the combined effect of these two factors.
Also Market Cap to AUM is Price/Asset, or P/A. Now, P/A = (P/E) * (E/A). In other words, Market Cap to AUM = PE * RoA. Here also, RoA is an accounting variable denoting past business performance. At the same RoA, if the PE ratio of the stock changes (due to change in expectations of growth and/or risk in future earnings) then it will cause Market Cap to AUM to change proportionally.
I think PE is a good metric for understanding stock valuation levels and RoA is good for understanding overall business performance of the company.
Two interesting points elucidating why Repco and Gruh will continue to keep the growth momentum.
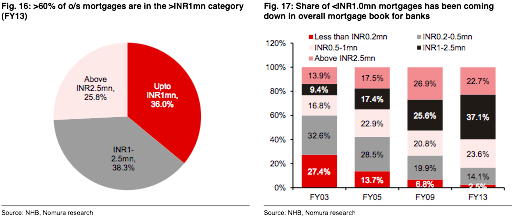
Lower-ticket mortgage is a sizeable market but the share of banks in this market is coming down, giving ample run way for specialist HFC such as Gruh and Repco to grow in this segment.
2.Despite lower credit rating and higher reliance on bank funding, cost of funding for Repco (9.85%) and Gruh (9.32%) is marginally higher than stelwart - HDFC (9.15%) and lower than other HFC, but ROA is higher than other HFC/banks due to lower OPEX/Assets and higher yields.
thanks for the report!
It is surprising that although Gruh has extremely low exposure to LAP (4% of AUM), even then Gruh is not mentioned as prudent, but Repco at LAP exposure of 19%.
Repco reported Q1 results today. It looks awesome. Here are the numbers
1- Total income 200.3 crores
2- Net interest income at 66.23Cr
3- Net interest margin 4.53%
4- Net profit 30.23 crores vs 24.81 (YoY)
Loan sanctioned, loan disbursement and outstanding loans have seen an impressive growth of 37.52%, 39.39% and 29.68% YoY respectively.
Gross NPAs currently stand at 2.22% vs 2.49%, net NPAs at 1.29% vs 1.6% (YoY). NPA usually is higher during the beginning of the year and tapers down gradually by the end of the year.
For the whole year the expected PAT to be in the range 155-160cr (brokerage commentary) which means we might see a PAT of 40Cr in the coming quarters.
True, but it started rallying magically exactly 2 days before results. I have seen similar behaviour in the past as well. May be this is a direct result of making so many employees shareholders
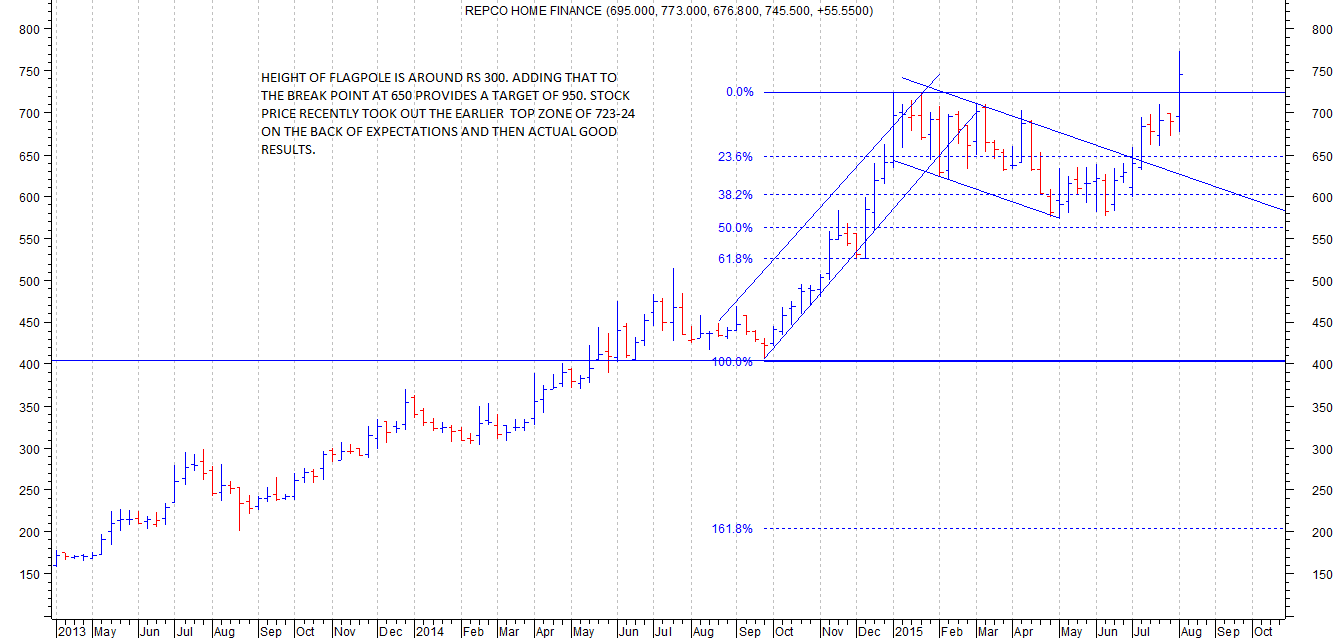
IMO it may not only be because of employees. There is a flag pattern on weekly charts. I’m a novice in technical charts. Maybe some serious can confirm.
Request all to move Canfin specific discussions to Canfin thread. Will help avoid cluttering Repco thread and will retain the information in correct thread for future reference. Thanks.
R. Varadarajan - MD add the call:Highlights by Capital Mkt
As per the company, the profitability and return ratio’s were line with the expected levels.Loan book surged 30% to Rs 6344.2 crore at end June 2015, driven by healthy 40% jump in disbursements to Rs 580.1 crore and sanctions by 38% to Rs 661.7 crore in Q1FY2016 over Q1FY2015.The presence in Tier II and III cities has facilitated the healthy loan growth for company, which is spread across all geographies in Q1FY2016.The company continues to hope to maintain loans growth in strong 25-30% range.The company has further diversified sources of funding, making strong case for ratings upgrade.
Loan book mix between home loans and LAP was 81:19 at end June 2015 compared with 80.8:19.2 at end June 2014.The customer mix between salaried and non-salaried was 42.9:57.1 at end June 2015 compared with 44.7:55.3 at end June 2014.An incremental loan ticket size was higher at Rs 15.8 lakh for home loans and Rs 18.4 lakh for home equity in Q1FY2016.
GNPA ratio eased to 2.22% at end June 2015 from 2.49% at end June 2015. NNPA ratio also declined to 1.29% at end June 2015 from 1.60% at end June 2014.State wise GNPA position was Tamil Nadu 0.9%, Karnataka 2%, Andhra Pradesh 2.7%, Telangana 4.7%, Kerala 5.3%, Maharashtra 0.7% and Gujarat 2.5% at end June 2015.Provision coverage ratio (PCR) of the company improved to 42.4% at end June 2015 from 36.4% a year ago. The company intends to improve PCR to 70% in FY2016 and to 100% in next few years.Spread stood at 2.9% and a NIM at 4.3% in Q1FY2015. Company expects to sustain target of 3% spread and 4% NIM.Capital adequacy ratio/CAR continues to be comfortable at 20%.
The company has added 2 branches and 2 satellite centers in Q1FY2016. The network of the company stood at 108 branches and 38 satellite centers spread across 11 states and 1 union territory.The cost-to-income ratio stood at 21% for FY2015, while the company expects to maintain the cost-to-income ratio at around 21%.The customer base of the company stood at 59428 at end June 2015.
The company seems to be accelerating its business. Credit costs are going down while disbursements and approvals are going up. However, it will take at least one more year to bring provision to 100% enabling it to report earnings in line with underlying business.
Whilst most of the parameters appear very good and improving, I am seeing a steady increase in the average loan amount on an incremental basis. At 18.4lakh per loan for LAP and 15.8lakh for home loan, it seems to be the highest that Repco has done, which will slowly but surely push up the average ticket size on total loan portfolio. I just hope it is not a fall out of chasing growth. Comparatively Gruh at 10-12lakh ticket size is far lower. I would rather that Repco operates in this space than move higher. This will be a key monitor-able for me.
@sammy11 Where do you see 18.4 lacs per loan for LAP and 15.8 lacs for home loan ? Could not find it in AR…I could only see it mentioned as average ticket size as 12 lacs v/s 11 lacs in the previous year. Please help to understand this part.