Hey Girish,
Glad that tou liked it, and thanks for your valuable feedback. I have already worked on 3rd and 4th point and it will be delivered with the next update.
Will work soon on remaining too.
Hi Vishwa,
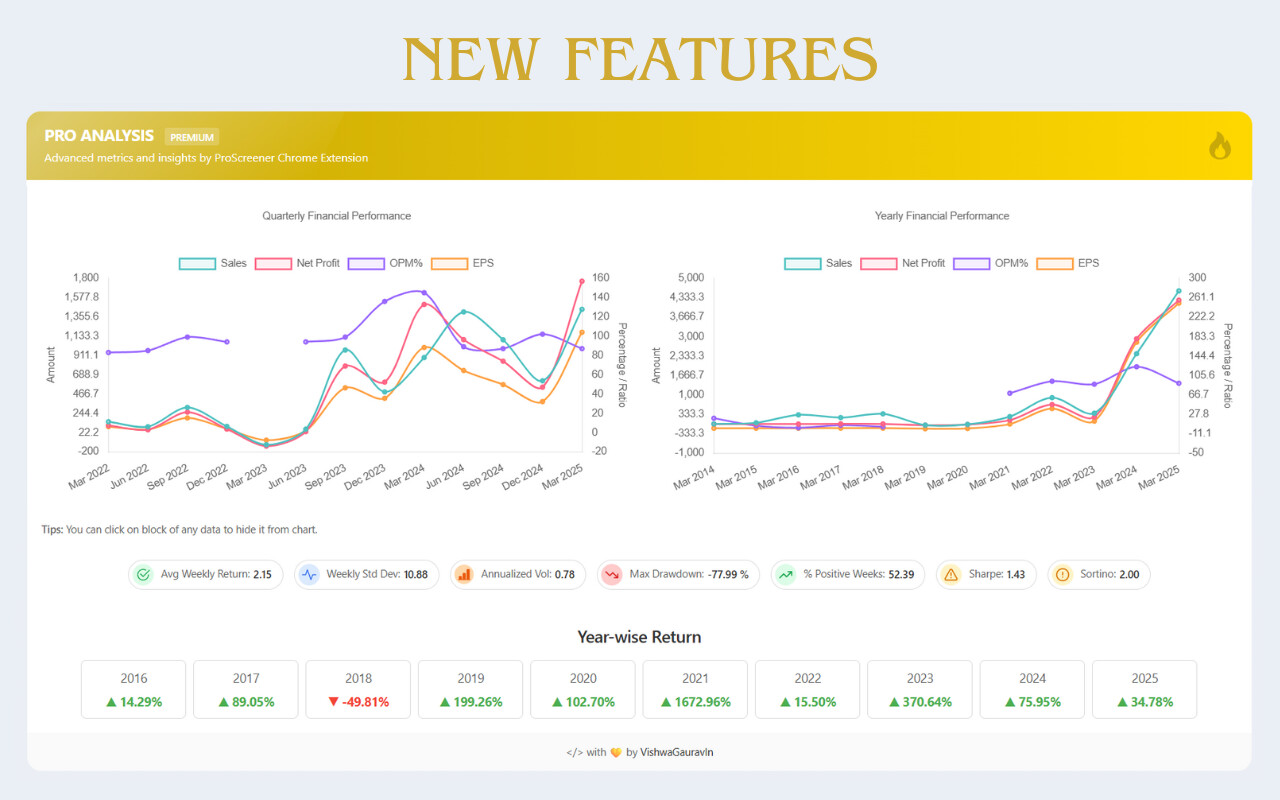
This is brilliantly done.
Thank you for this fantastic feature.
Just explain how to read the undervalued & overvalued number & percentage.
Thanks
Swaroop
Hey everyone,
I’m so glad to let you all know that we have successfully crossed 5000 users and 800+ daily active users.
This is my first Chrome extension to receive so much love and feedback, and I hope it helped you all in your financial journey and will continue to do the same.
Hey, currently as it is a chrome extension, It can be installed inside chrome and can be used. I am not sure if you can install extensions in ipad or iphone chrome.
sir,
in this extension not shown in desk top in screneer .in,i want to check in desk top ,but not shown in it,how to open in this extension screneer.in through google chrome,please tell the procedure to open in this extension in google.
Sir,
screener specter only shown in screener.in stock page,in chrome extension page screener smart analyser and pro screener -premium stock analysis is shown but screener stock page not visible,how to install the this extensions..
Hi - Thank you for incorporating the rations - its very helpful
On the screen - is there a possibility to see the formula of the ratios as well? It will be good to understand the real time workings and details that are behind the formulaes .
For ex: Annualized Vol of Infosys is 0.27 - the questions that one would like to understand is the calculation on a daily basis or quarterely or semi annualy - etc?
A general question i have is it better to analyze a single stock and back test or does it make sense to get list of company based on some fundamental investment rule like ROCE, ROE etc? Reason I am asking even if analyzing single stock risk exposure is too much, but on other end with list of stock following same investment rule, ability to reduce risk is more.