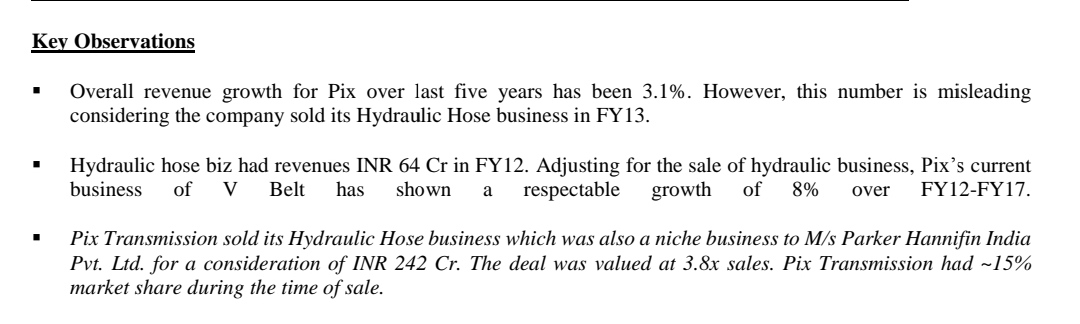
First post on this thread. Thanks to all the members who have posted such rich information about the company here and special thanks to folks who have attended AGMs to get us information from the horse’s mouth
Since a lot of people have asked about PIX’s ability to hold gross margins and pass on input costs, I decided to do a bit of a deep dive into the prices of synthetic rubber in global markets and try to correlate with PIX’s gross margins from FY16-21
Assumptions:
I have assumed that inventory consumed in a particular Quarter by PIX is purchased in the previous quarter i.e. there is a 1Q lag between synthetic rubber market price and its impact on PIX gross margins
I have taken synthetic rubber price data from US Bureau of Labour statistics’ PPI indices (Product code - 325212). Assumption being these are global price indices and will hold for PIX purchase price trends also (Somebody mentioned PIX buys locally from Reliance)
Attaching my excel sheet for anybody who wants to go through the raw data. The first sheet has the base price data along with the link from where it was obtained. This is my first time doing any analysis based on PPI data from US statistics, so there maybe errors of understanding or calculation. Request community members to go through it and point out mistakes and inaccuracies if any. Pix transmission GM analysis.xlsx (25.5 KB)
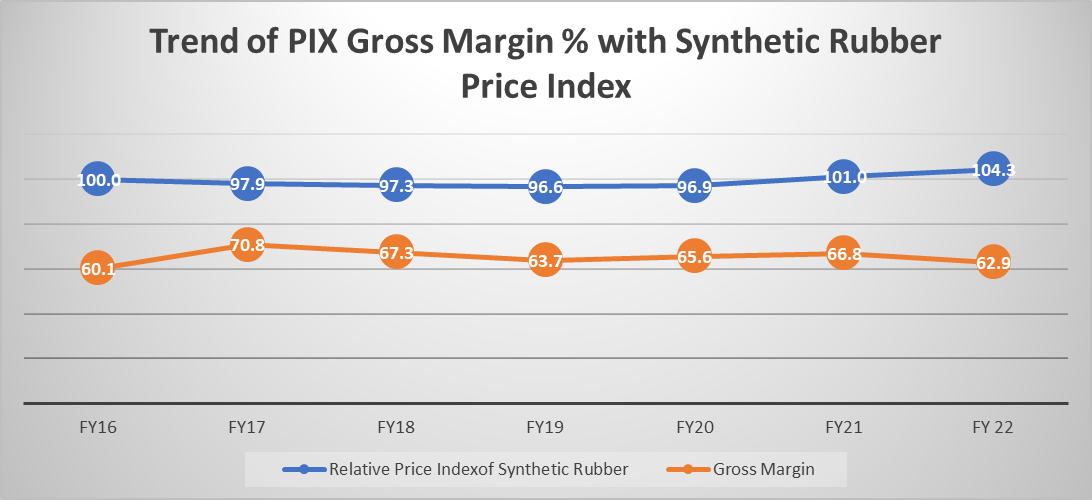
Key observations from the chart:
Price of synthetic rubber seems to be quite stable with low volatility across the 5 year period
Prices are trending upwards now and as per PPI data, Q2-Q3 synthetic rubber prices may go up by ~10% over prevailing prices in Q1 (I can see price pressures have already been mentioned by Gates above in their recent quarter results).
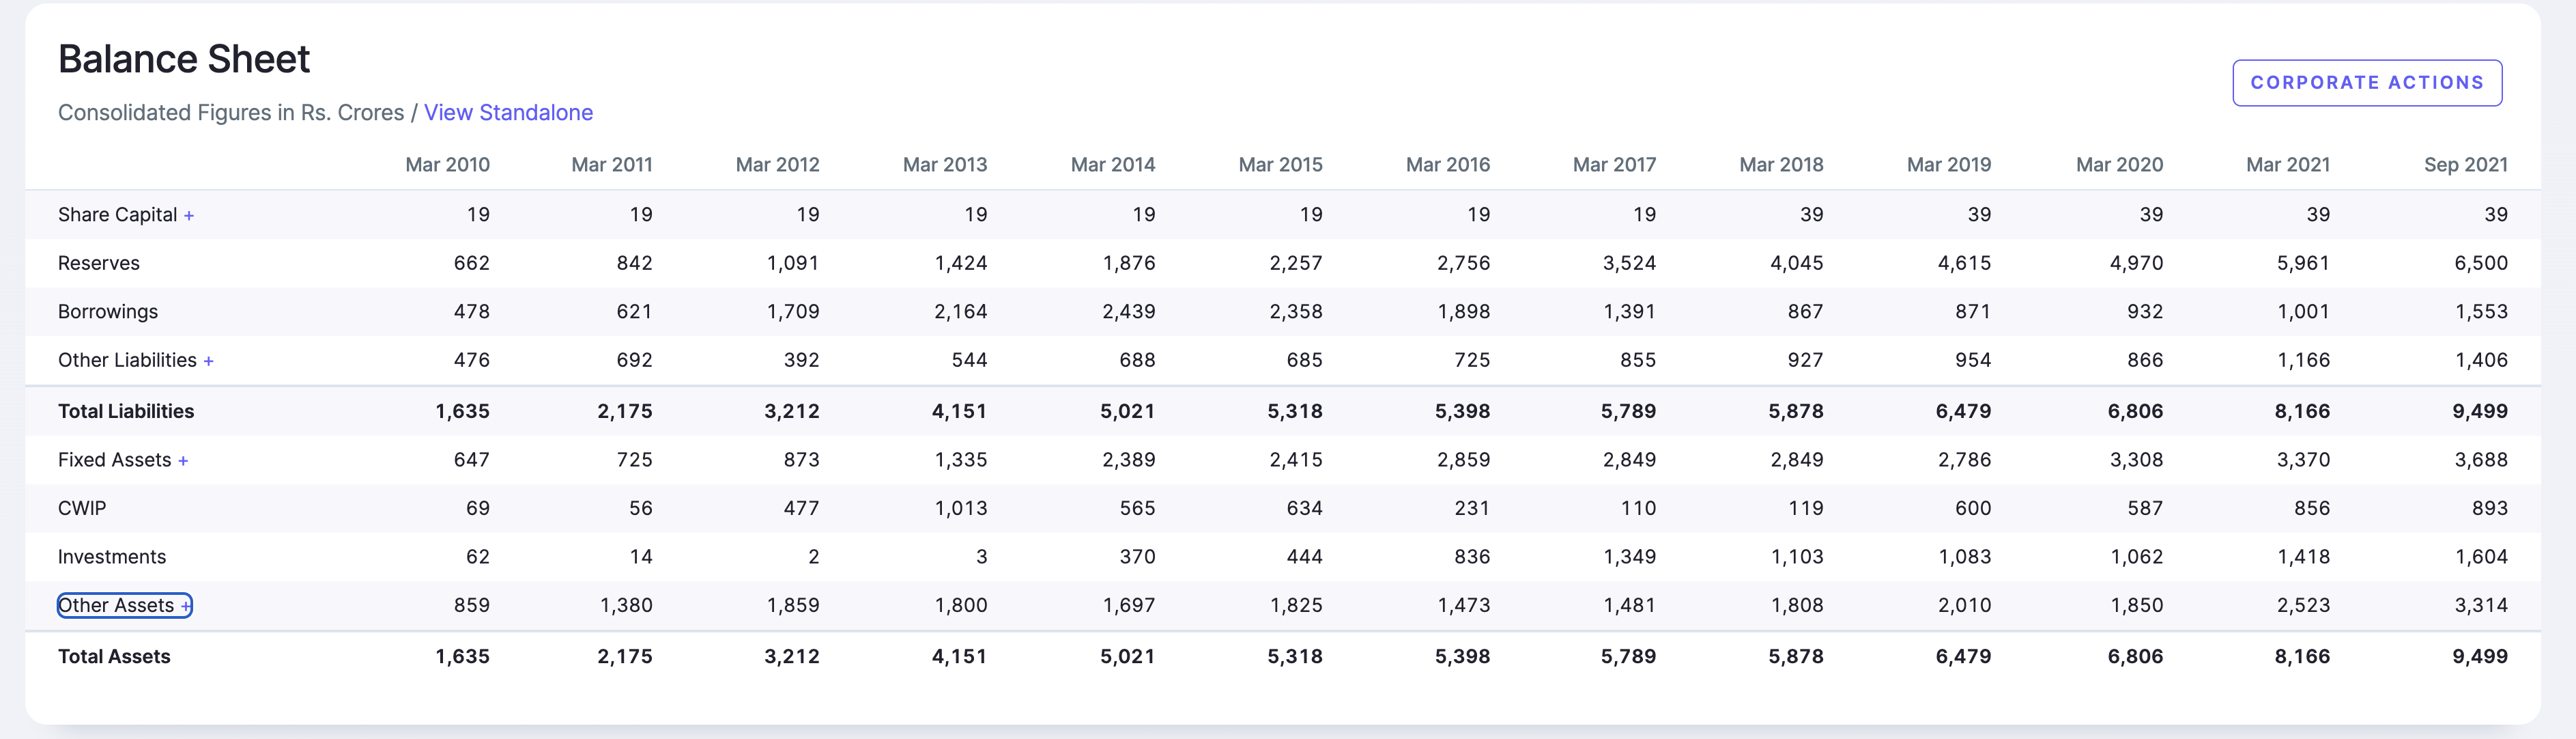
So far PIX has managed to hold Gross margins above 60% comfortably, remains to be seen if this continues to be the case in Q3 and Q4. There is a sharp increase in inventory from 97 Cr in March 2021 to 122 Cr in Sep 2021. I am hoping most of this increase was advance procurement of RM in the face of increasing prices.
If PIX can hold gross margins in the face of such steep inflation and if company’s transparency improves with concalls and presentations, then I hope the company can gets further re-rated. On that note, I also wanted to get the members’ opinion on how to arrive at a fair valuation multiple for a company like PIX in the best case scenario where Corp Governance improves and it shows margin resilience in the upcoming quarters? I saw some discussion on Twitter mentioning 30x PE as possible fair valuation for a well performing industrial consumable company. If that is the best case, then there is still huge value unlocking possible apart from EPS growth. Any views on this will be super helpful for a new entrant into the company.
Latest on Pix Transmission. In Q3FY22 Qtr, DIIs holding went up from 0.03% to 0.23%, Promoters share up from 61.76% to 61.78% and Mukul Agarwal holding up from 2.47% to 2.54%. Good moves!
Good stuff! Just one point on Gates - their Q3 concal was full of questions and clarifications around passing the RM and Freight cost increase and management sounded very confident of passing on 100% of the increase by Jan 1st. It’s to be seen if Pix can do the same, but generally in such industries prices moves of the leader tend to be matched up by the smaller peers.
Gates has reported Q-o-Q EBITDA de-growth of 4% for the Dec quarter, with more than half of it linked to higher r/m prices. Let’s see if PIX is able to do any better in terms of margin protection.
Revenue growth of 5.7% Y-o-Y but 6.5% decline Q-o-Q. Impressively, their gross margins have expanded 0.8% Q-o-Q which is really commendable in this inflationary environment. EBITDA has declined marginally by 0.6% Q-o-Q, again really impressive. They have controlled their Other expenses Q-o-Q whereas most companies have reported high inflation in other expenses on Q-o-Q basis.
Overall, great job in passing through costs and in cost control. The Q-o-Q revenue decline is a bit of a dampener on what is otherwise an impressive set of results. Market would have rewarded the stock on Monday had revenue grown Q-o-Q or even remained flat I guess.
Assuming Export runrate at stable 75 cr + range( basis some growth over last year Q1 export only times) for Pix and thus explains margins holding well, Gyrations seems more from local markets biz, Q3 has been subdued for all agri heavy industries ( commentary from Pipes players such as Astral, Prince pipes).
Q4 is seasonally strong for local Agri driven industries - Exports should hold well and thus margins will stay stable but Domestic need to pick for delivery on total rev growth. Last year QoQ for pix was sizable growth in Q4( from 108 to 130 cr).
Summary - Export seem to be doing well, product mix is tilting towards Export( both global demand and Pix efforts), margins thus sustainable in last 3 Qtrs despite revenue flat, local markets if do well in Q4 can be quite upside on revenue though margins will stay in similar range - consol can do 140-150cr in Q4 if last year QoQ pattern plays out. Again these are deducted based on above info and could be wrong.
Additional points
Hiring BD and Marketing in EU - EU is key export market ( Approx 25% of total revenue per last year AR nos, 5% type UAE) - marketing hiring indicates brand driven growth Pix Careers
Agree, fair point. However had my eyes on market depth, wasn’t significant on the seller’s end. 20,000 sellers at all points when it hit LC post 2.10pm.
Can be wrong too. I usually track this data on high volume days, gives an indication where the true buyers are.
Pix Q3 numbers were only marginally below expectations, certainly not bad enough to warrant a 20% fall! Though it must be taken into account that the stock had run up considerably over the past 30-45 days leading to the results. Another 10 cr in sales, & the the results would have met with some euphoria, considering that the operating margins were hardly impacted despite rising raw material costs. I agree that a decent Q4 is very much on the cards & Pix could end the year with sales of about 480-500 crs.
Pix current investment thesis is based more on what it could potentially do in 22-23. I understand that the logistical hub is on the verge of completion, so the next full year will see the fruits of expansion. With higher margin exports booming, the numbers could surprise on the upside. The NSE listing which should come about any time now, would take the stock out of the dreaded “X” Group & be of more interest to the traders as well, besides bringing in additional liquidity. Currently BSE additional charges come to 5 to 10 times the brokerage that one pays on the stock.
Today’s fall once again make the valuations interesting. Any further fall could make the stock worthwhile for a short term trade. Its another matter that if the short term trade goes in our favour, it suddenly becomes a good idea to change plans & keep it for some more time!!
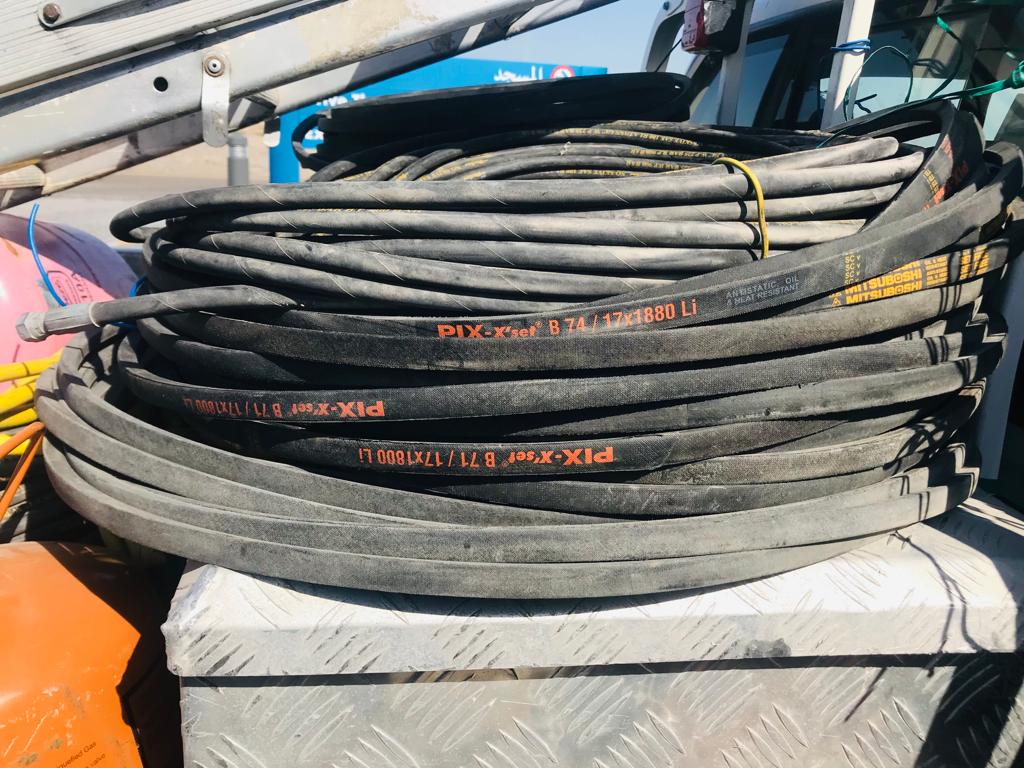
While traveling in the remote industrial area of UAE, I saw a bunch of belts in the pickup trucks, to satisfy my curiosity, I had look and found they are from PIX. It shows a sample, PIX had built a good supply chain and penetration in UAE.
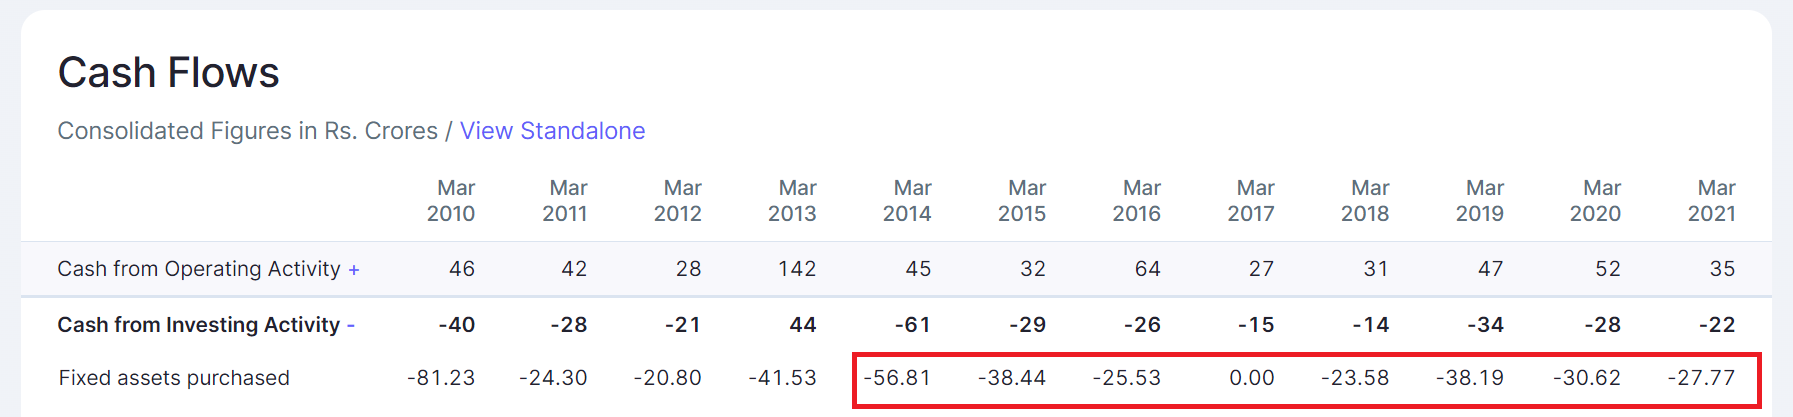
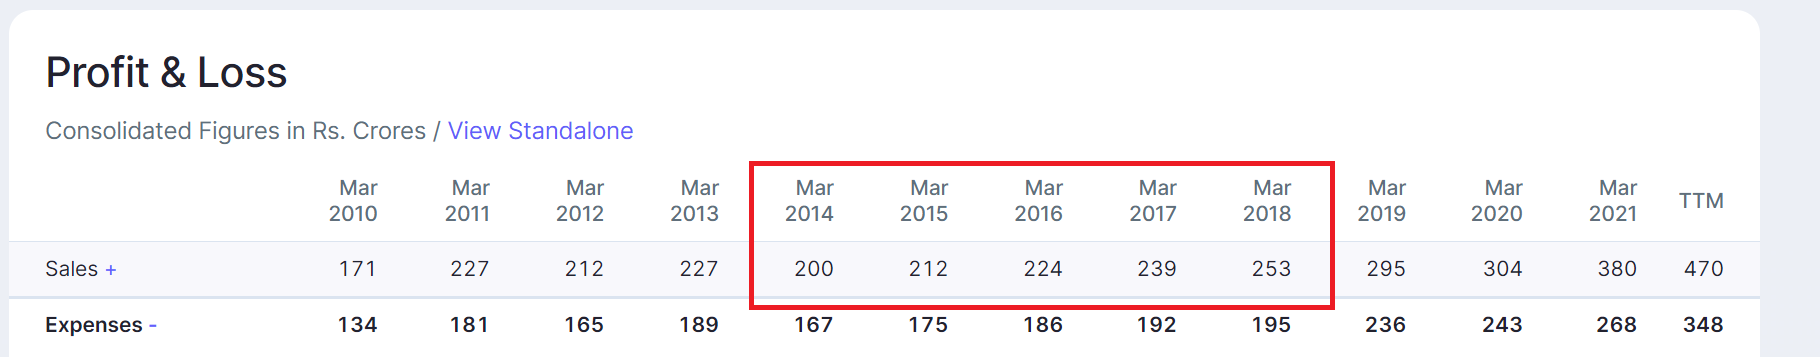
If you look at the above snapshot, since FY14 (Ignoring earlier years due to sale of other business unit in FY13), there have been consistent investments in capex. However, during the same period from FY14-FY18, sales were mostly flat with a 5.5% CAGR growth as you can see below.
So why was capex being done when it seems like the demand environment wasn’t robust? During the FY14-FY18 period, total capex was ~145Cr, depreciation was ~51Cr and net block increased only by ~41Cr. This leaves a gap of about ~50 Cr from the capex spend which isn’t showing up in the assets. Couldn’t reconcile this.
Even after FY18, every year Pix has done a capex of ~30Cr. Before the 60Cr capex announced in Feb 2021, I couldn’t find any company announcements to exchange about these capex spends in FY19 and FY20. Which makes me think these might be replacement capex spends and thus a regular affair. Capex every year means free cash flow of the company suffers. Anyway, operating cash flows are depressed due to high WC needs, so this is like a double whammy. Could be the reason why PIX has a low PE rating so far.
If there are any mistakes in the analysis, please do point out, will delete/update the post.
Maintainance capex. See the depreciation number. The capex you talk about is roughly equal to depreciation a little bit more. Just because capacity is not going up does not mean capex won’t be done. Capex can also be to modernize the equipment. Some people who went to factory have talked about how the factory looked quite modern. Some of it could also be to support larger # of SKUs.
Actually depreciation during FY14-FY18 = 65 Cr (13Cr in FY14, 12 Cr in FY15, 12 Cr in FY16, 14Cr in FY17 and 14Cr in FY18)
Capex during the same period = 145 Cr
There are some asset sales as well amounting to 20 Cr in the period. Even accounting for that, net capex would be 125Cr which is much higher than depreciation. So this is not just maintenance/replacement capex I think.
Anyway, the point is due to high WC and yearly capex requirement, FCF for the business is quite low, which is probably why valuations and PE ratios are low. And this seems like an industry phenomenon, not only a PIX phenomenon.
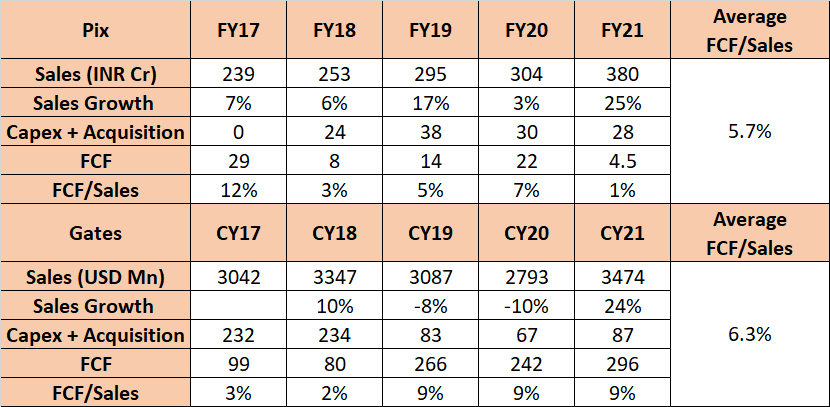
I compared FCF/sales ratios for Pix and Gates based on available data for last 5 years
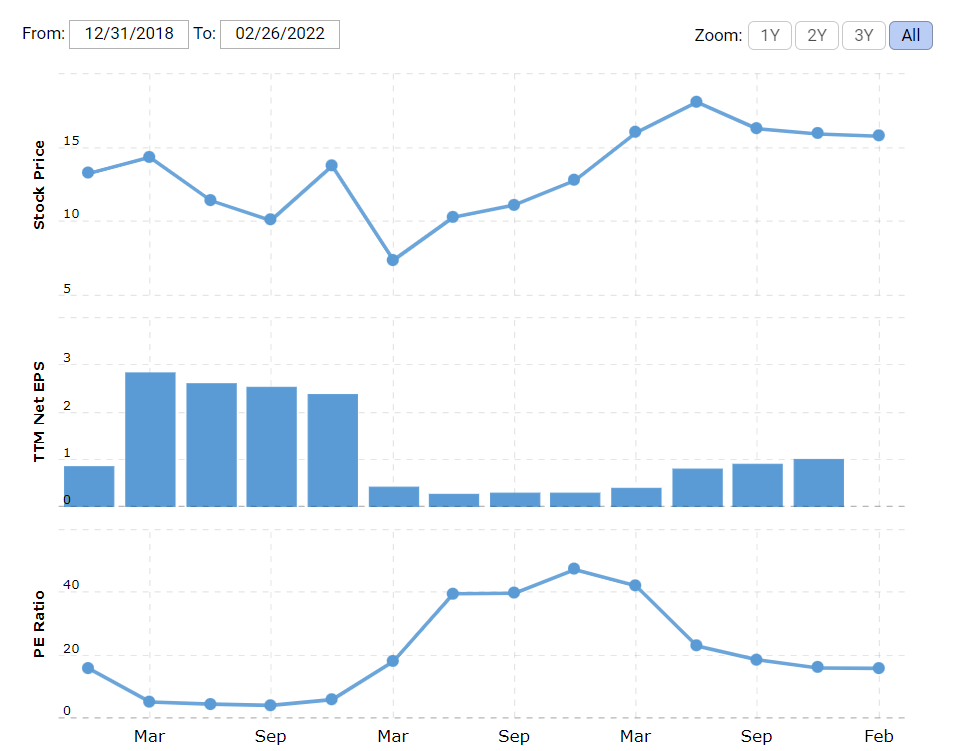
Both have similar FCF/sales averages over 5 years of ~6% with Gates doing slightly better. I could find a PE chart for Gates only since Dec 2018. Interestingly, Gates has always traded in a tight price band and doesn’t seem to react much to earnings changes. At the height of its earnings in CY19, it traded at a PE of 5x and then traded at a PE of 50x when earnings crashed in CY20 due to Covid.
Interesting exercise to compare PIX with Gates and deliberate whether re-rating might happen for a stock like Pix or will the stock price growth come from pure earnings growth.
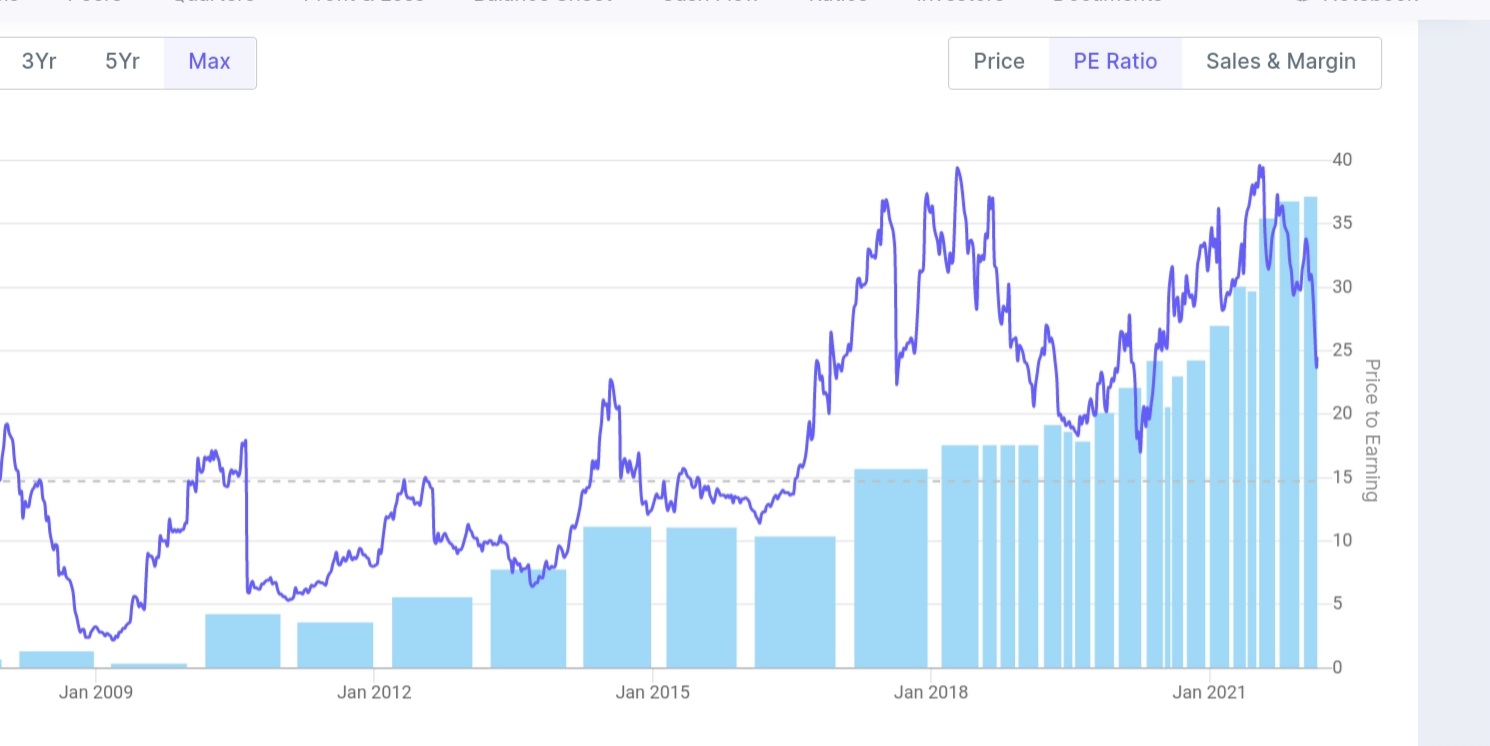
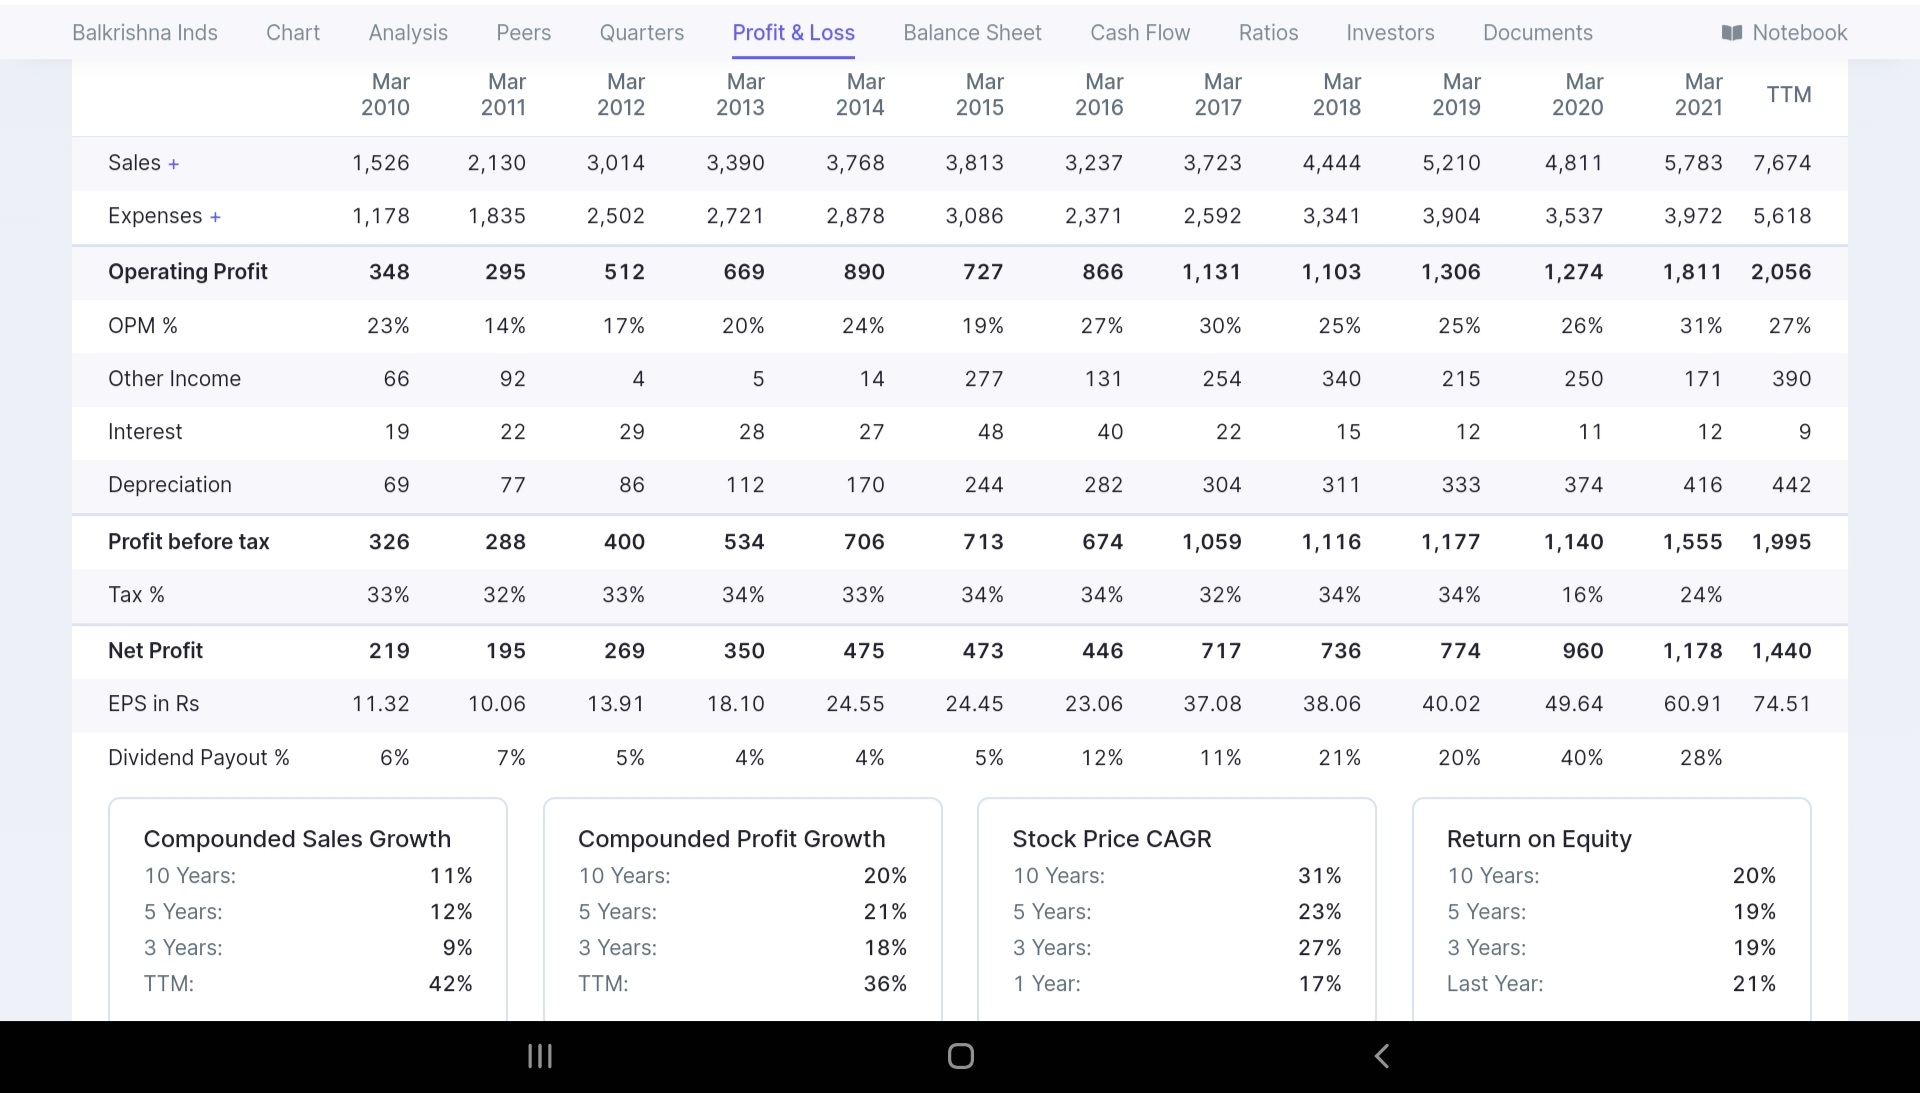
Here is a rear view mirror for a very well known story Of Balkrishna - with unique business model characteristics ( growing exports, replacement focus hence less cyclical , large SKU& client customization , David vs Goliath where it went on increasing world mkt share ) -most of which have resemblance with Pix - including Senior investors here who have ridden on BKT decadal story
First thing first did rerating happened over journey - quite nicely it did.
How Was growth quality - did margins improved, sales growth over longer time, RoE? Everything looks good at P&L broadly( looked even better before last few weeks BKT beating after Russia issues over EU focused businesses)
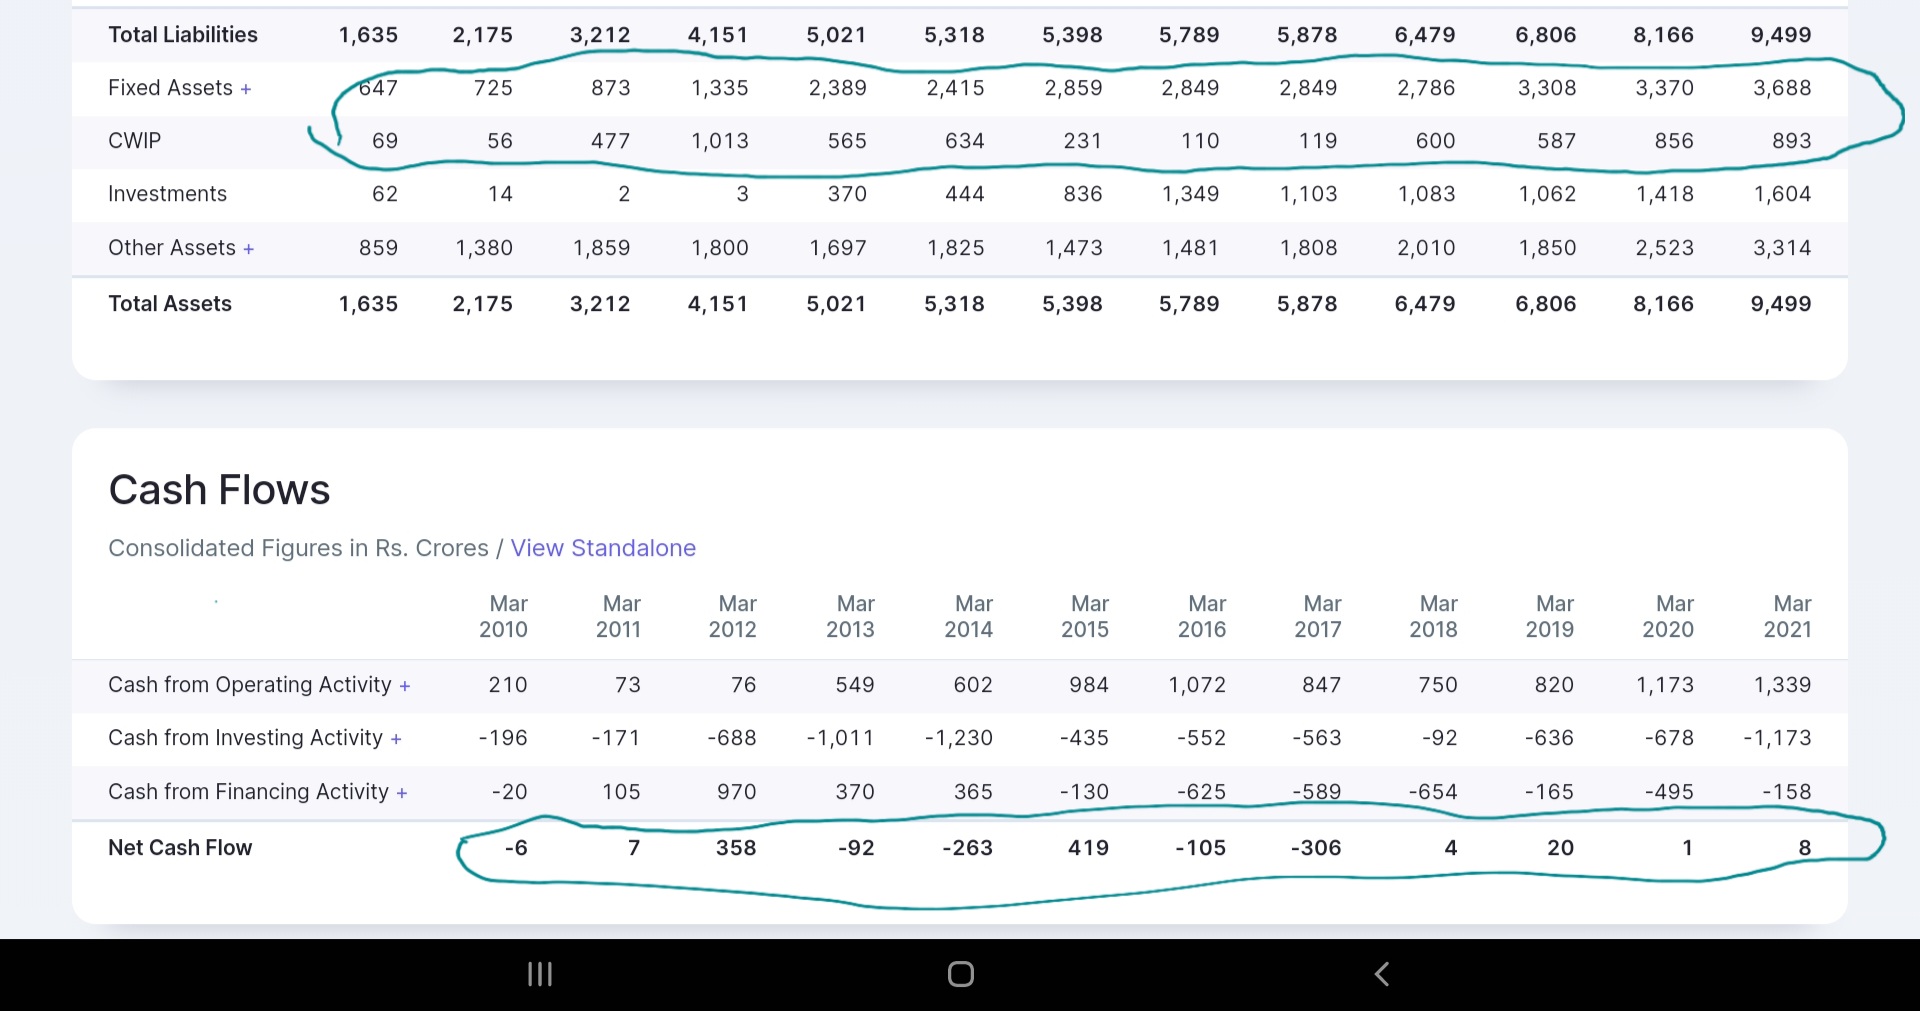
Summary - BKT had a business model where working capital will grow linearly with scale due to increasing no of SKUs and inventory required. That means free cashflow is unlikely as long as both CWIP and WC grows linearly. Infact Balkrishna WC, Inventory reduction years are when topline degrew/flat.(e.g. 2015 and 2016)- despite that it’s a known compounder.
If Pix has similar excecution & destiny, we might still have a winner at hand despite negligible cashflow and regular Capex. Key will be qualitative aspects of, global expansion driven opportunity size, mkt share gains against competition ( India and global). And ability to show non cyclicality and consistency over longer time frame growth.
Bit far fetched & optimistic expectations but a distinct possibility. BKT thread is a good read.
( Another very good read with wealth of knowledge on quality of businesses
Mayur uniquoters scored as a favorite over BKT per this VP thread due to better quality of earnings( increasing asset turns, higher cashflow, opportunity size etc)
However - it was meant to turn out bit differently and BKT went on to become a compounder)
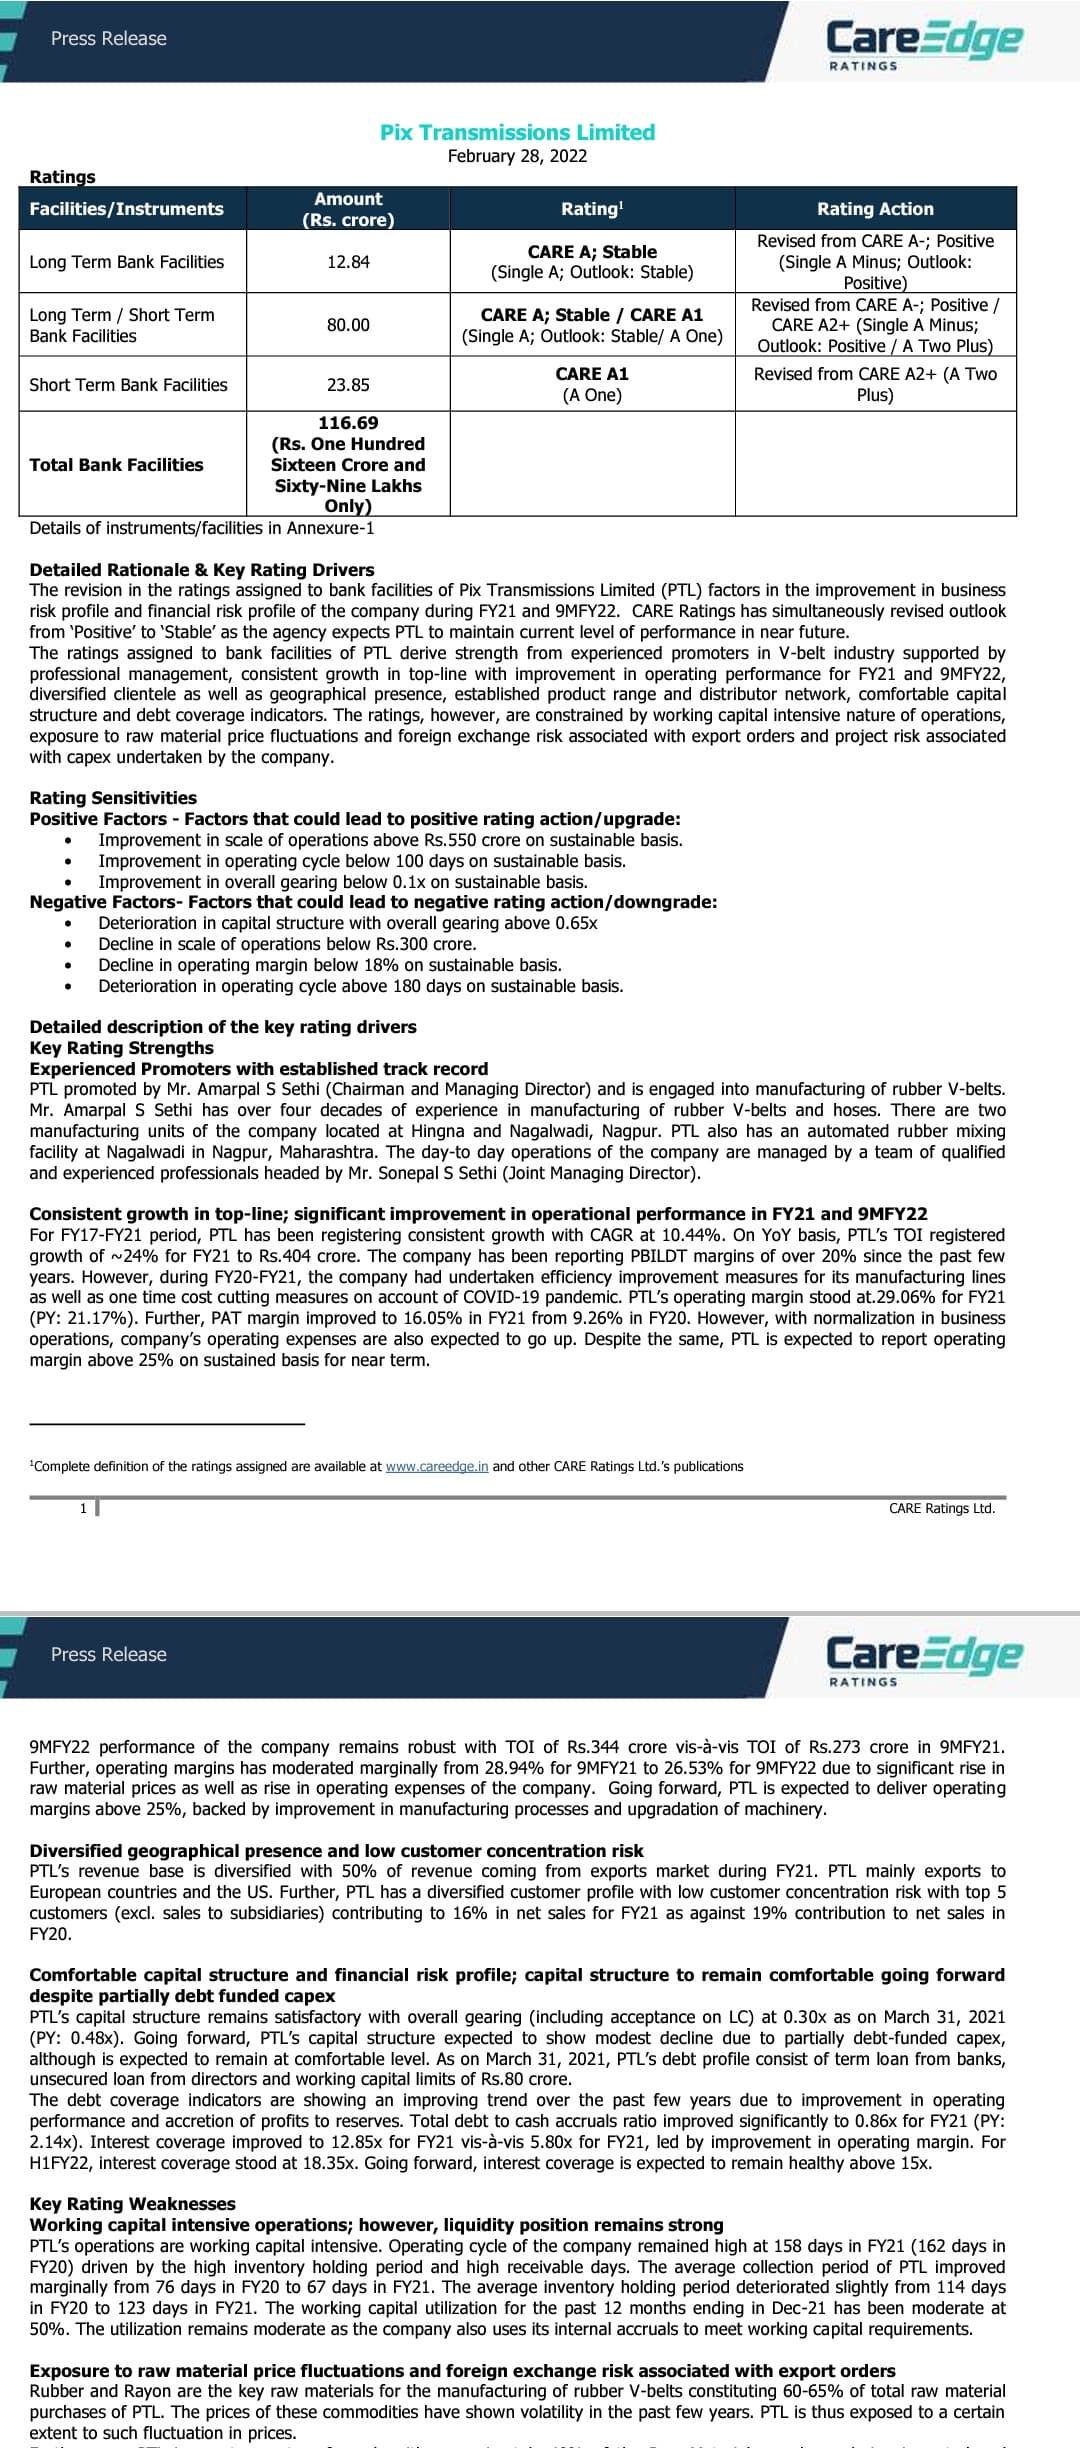
Rating has some very interesting insights including following :
"In FY21, the company had undertaken capex to the tune of ~Rs.25 crore which was mainly towards technology upgradation. As per the management, improvement in technology has led the company to phase out older machinery with latest technology. "
Some of this explains - like i said - where the capex has gone.
It is also commendable to see operating margin has only gone down 2% or so while rubber prices have gone up 100% over last few years. Operating margin are expected to be sustainable above 25%. Dev’s bkt example is exceptional. At end of day what investors are trying to understand is whether inventory could be liquidated if needed if the business closes down & the cashflow frees up.Rating improvement should improve interest costs by a little bit. Even higher sales growth can lead to even more rating improvement as per the report.
As per the management, entire current capex project is expected to be completed by Q1FY23.
Capex for FY23-FY24 is still under consideration stage and will focus mainly on upgrading machinery and equipment for meeting market demand as well as introducing new products to make PTL as one-stop shop for its industrial customers. The company would assess the demand situation and accordingly decide on the capex. The capex for FY23-24 is expected to be funded through internal accruals owing to strong cash generation ability of the company.
With normalization in business operations, company’s operating expenses are also expected to go up. Despite the same, PTL is expected to report operating margin above 25% on sustained basis for near term.
Disc : invested & biased this is not a buy or sell reco
I think you have misunderstood BKT quality of cash flows:
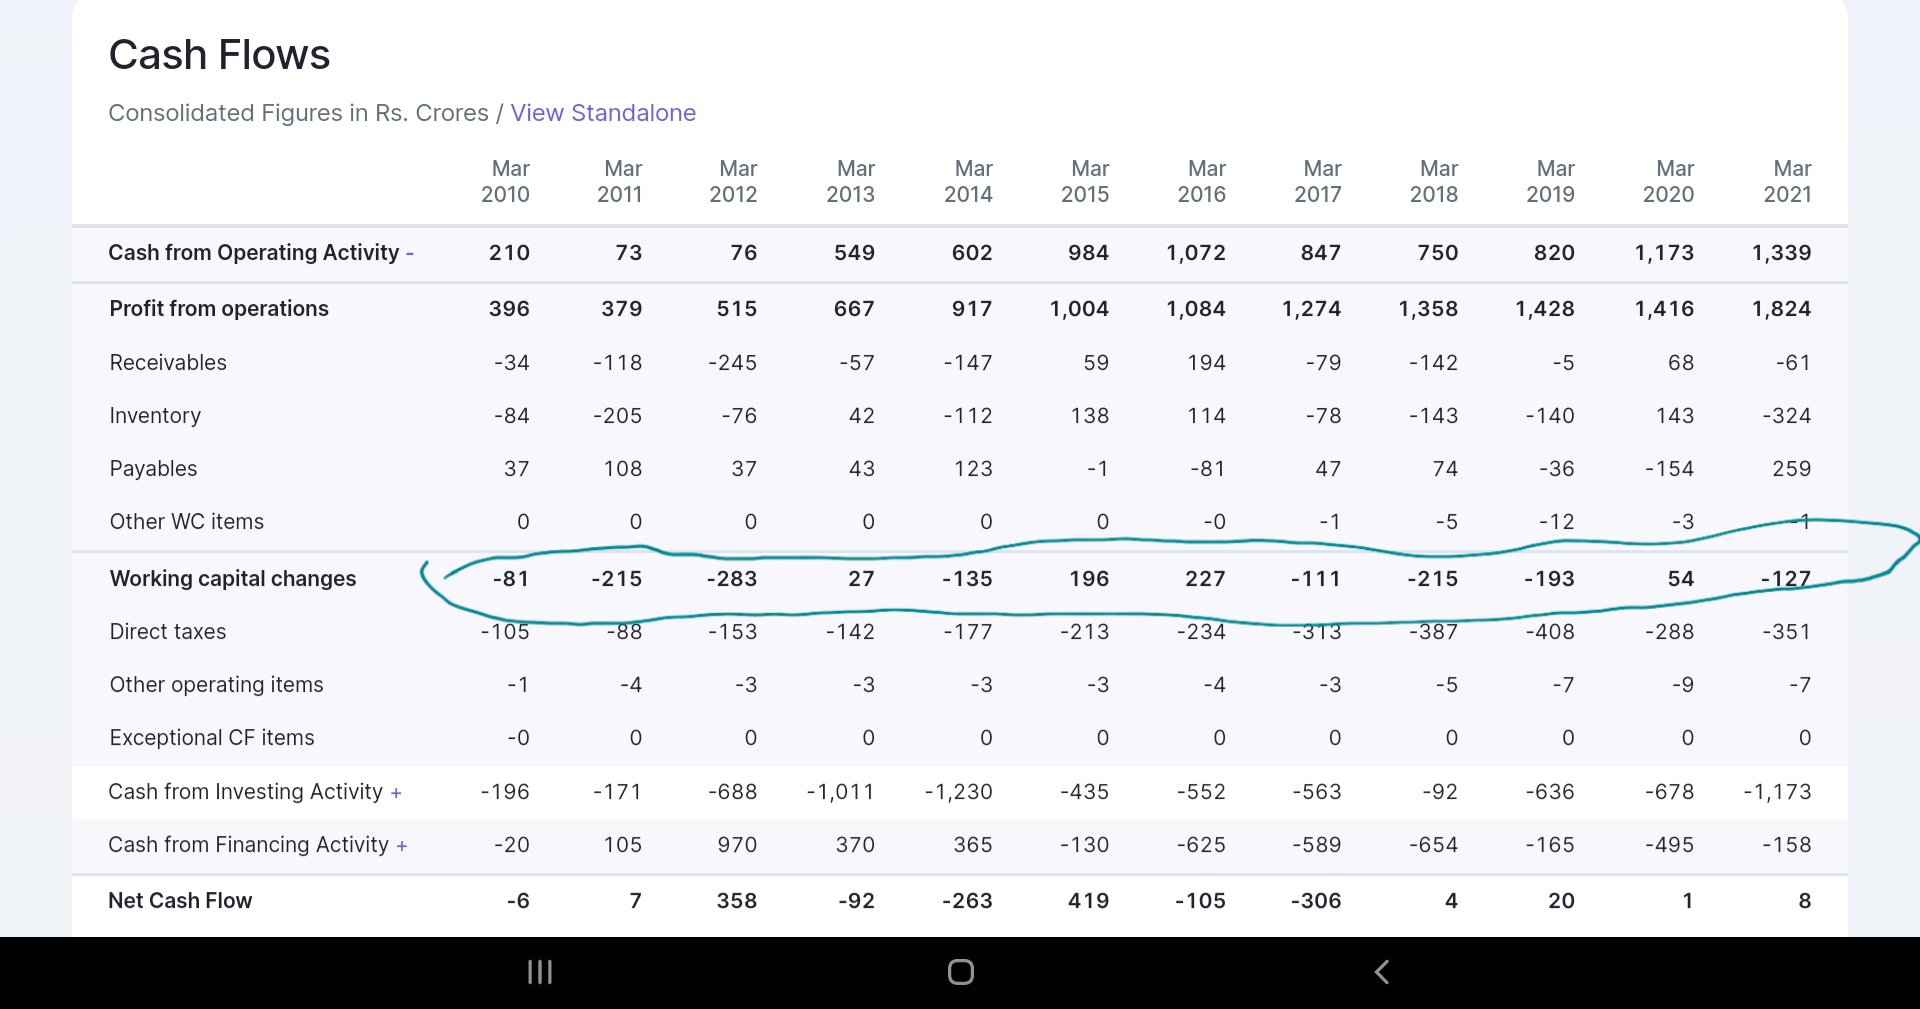
Net cash flow is a flawed number to look at in screener. BKT,while paying down 1700 cr of net debt has , its book value from 1000 cr to 6500 cr - all from internal accrual
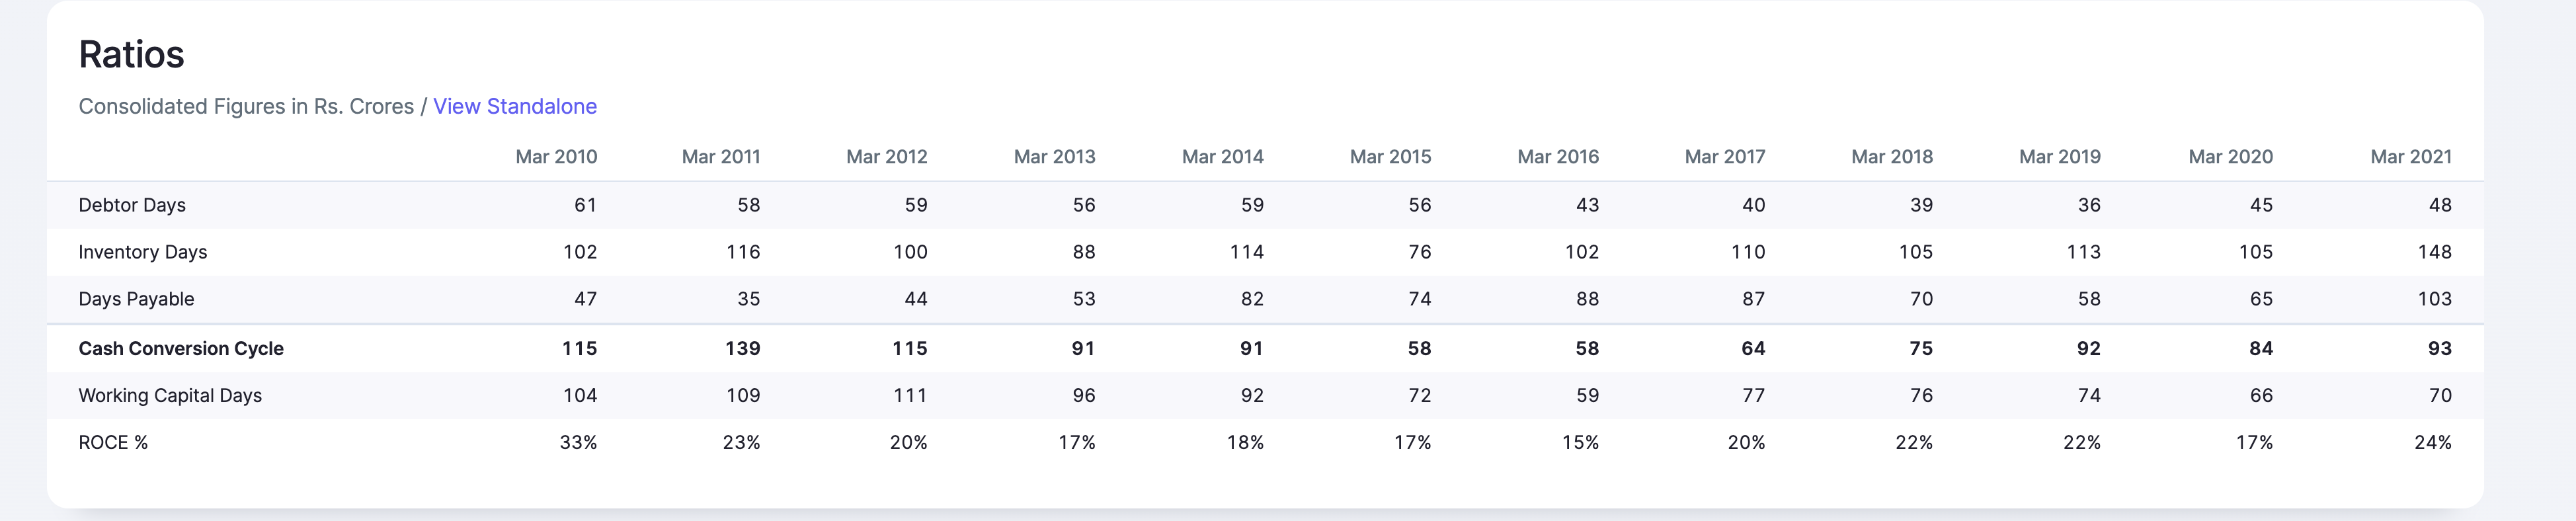
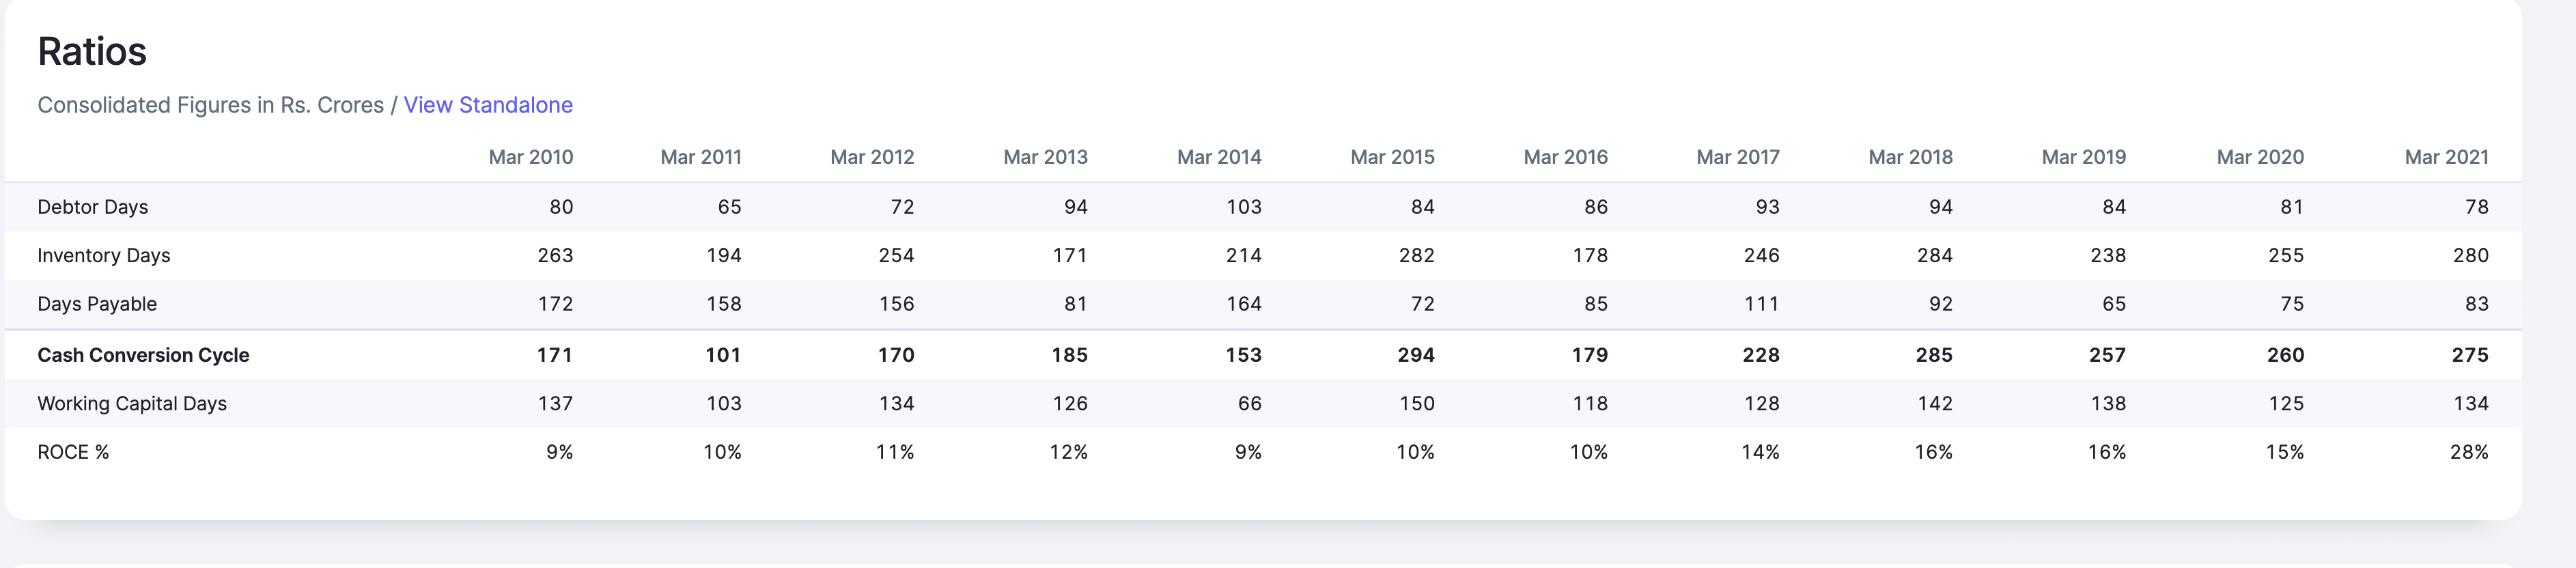
Naturally inventory will increase for a growing business. The metric to look at is not absolute inventory but cash conversion ratios. Cash conversion cycle has reduced by 22 days over the last 10 years while compounding profit at 20%
In the last 10 years BKT share price is up from 120 to 1800 (15x). Mayur is up from 40 to 400 (10x). Share price was 600 (15x) few months ago. Both have had fairly similar business trajectory and therefore share price trajectory. How do you see BKT as a compounder but not Mayur?
Overall, BKT has been a great compounder because it has generated huge amounts of cash and used it to pay down debt, reinvest in capex while inmproving the cash conversion cycle - and not because of destiny!
Pix on the other hand so far has done a great job with growth and margins at the cost of poor cash conversion. CCC has deteriorated from 170 days to 270 days. It will get rerated if and when it demonstrates the ability to grow while improving its working capital cycle