
After a long time, an eerie feeling with regards to Page price movement. Price movement generally/typically tells what’s going to come.
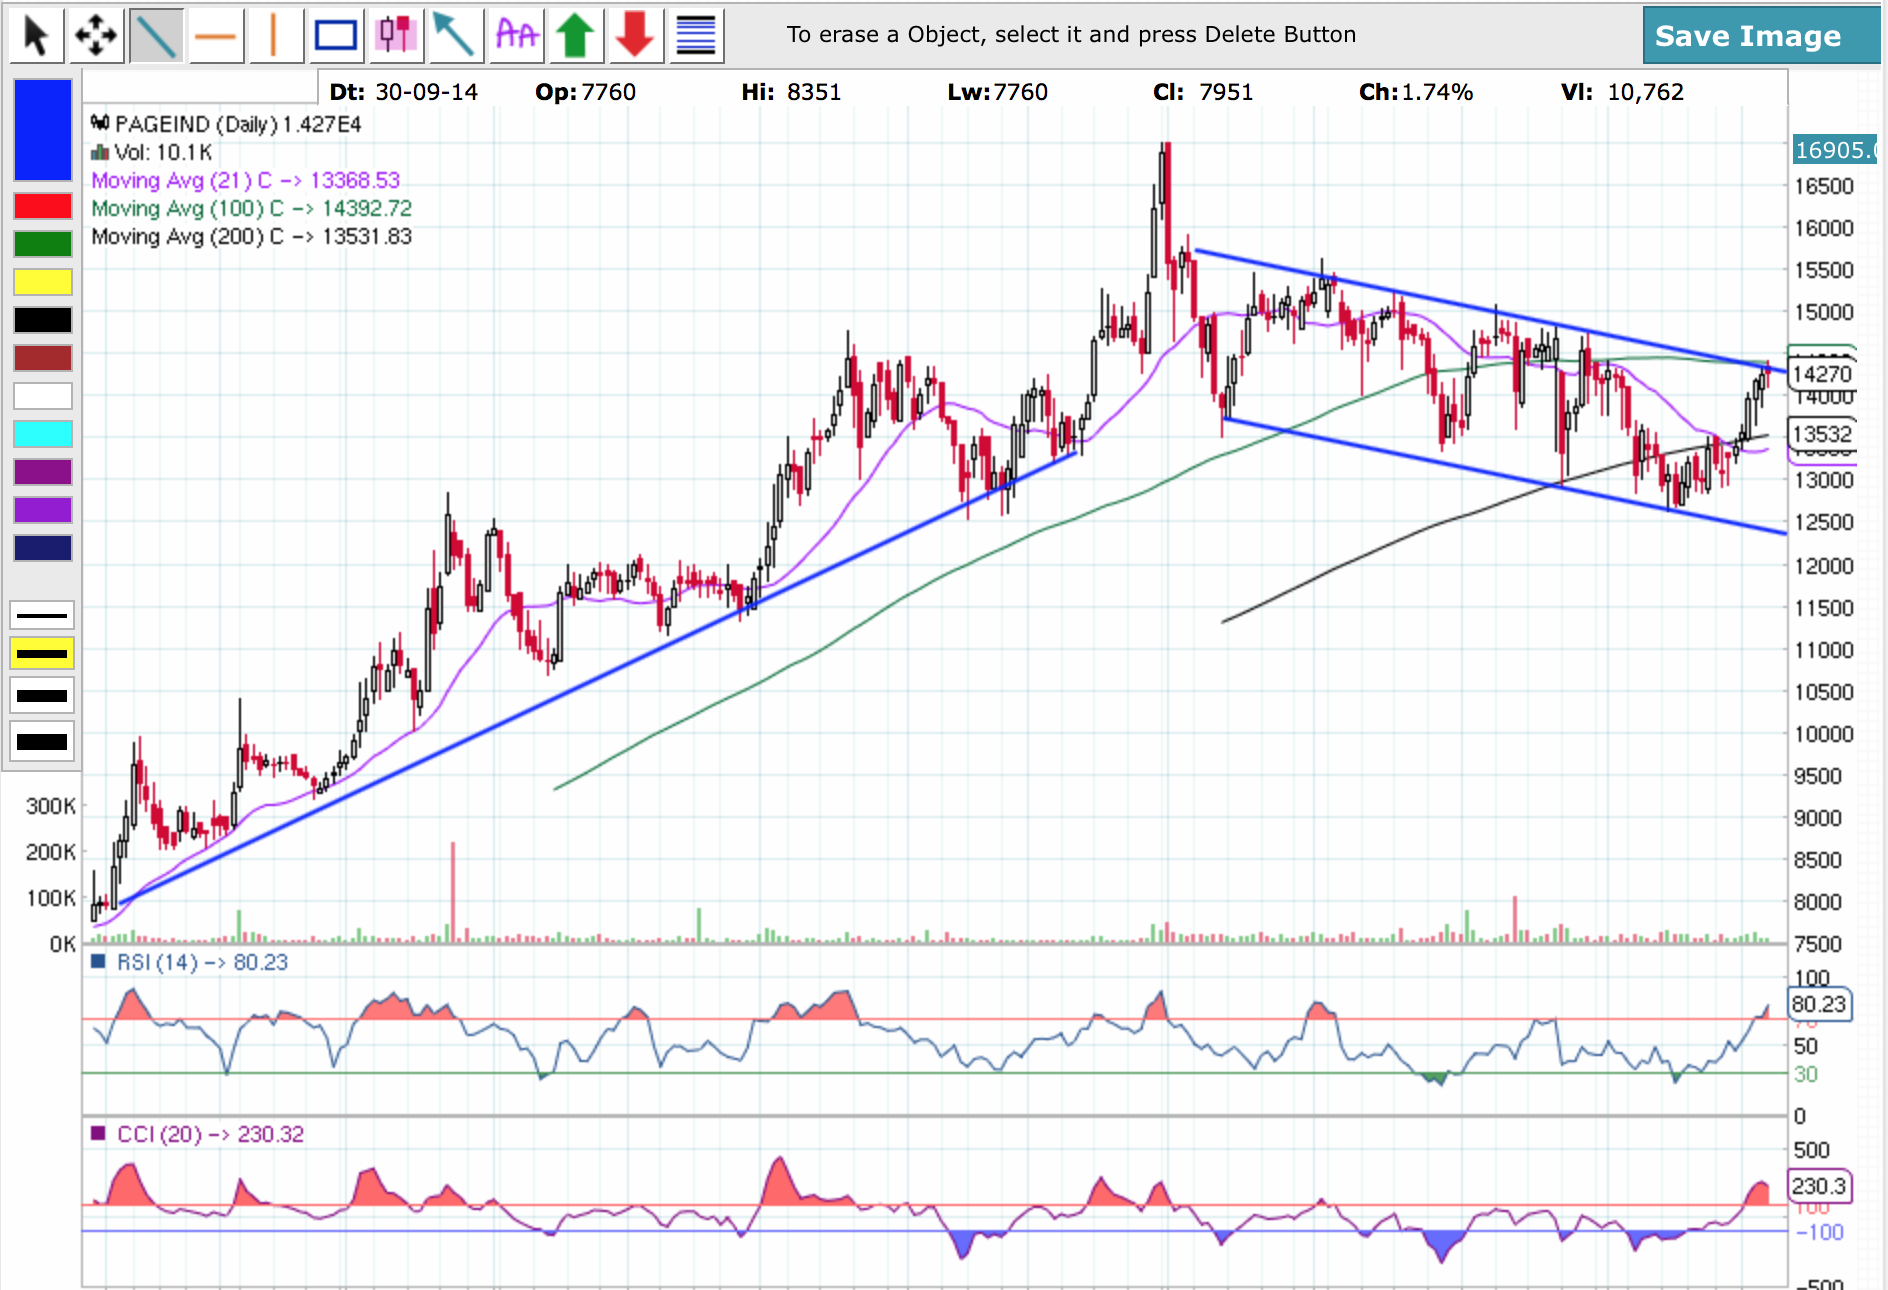
As per the one year daily chart from chartlink, for the first time in many years, Page chart deviated from being ‘secular uptrend’ to ‘downward channel’.
Page should break this channel sometime in future, either up or down. I said eerie feeling because, it looks to me as if it might break towards the lower level. At the current juncture, it is located at the top of this channel with RSI and CCI showing over-bought levels and fundamentally high PE and a slow Q1 FY16 growth.
Is the chart telling us something? Can the technical experts on this forum read any pattern here?
Disclosure: I HOLD page. I’m NOT a technical expert, I just read the chart to identify trends as an amateur, that’s it. This is NOT any suggestion to sell/buy, just my observation. Of all the people in this world, I’m the worst technical analyser of charts.