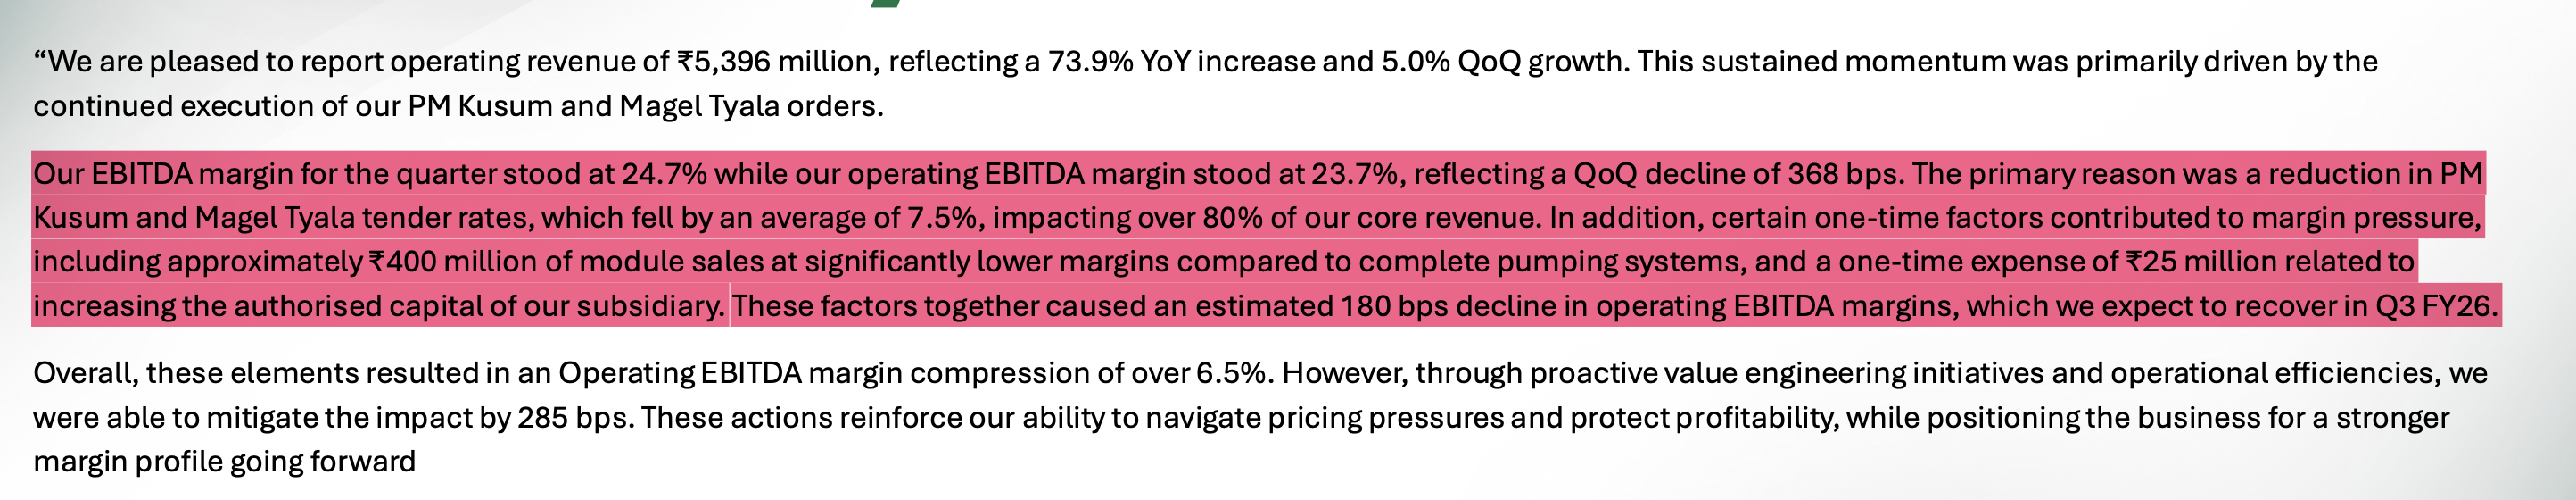
As per the management commentary, Margin pressure was due to increase in competition, which decreases tender pricing by 7.5% but management try their best and mitigate this fall by 2.85%.
Management is also confident that they will again increases their margins by 1% by the Q4 FY26.
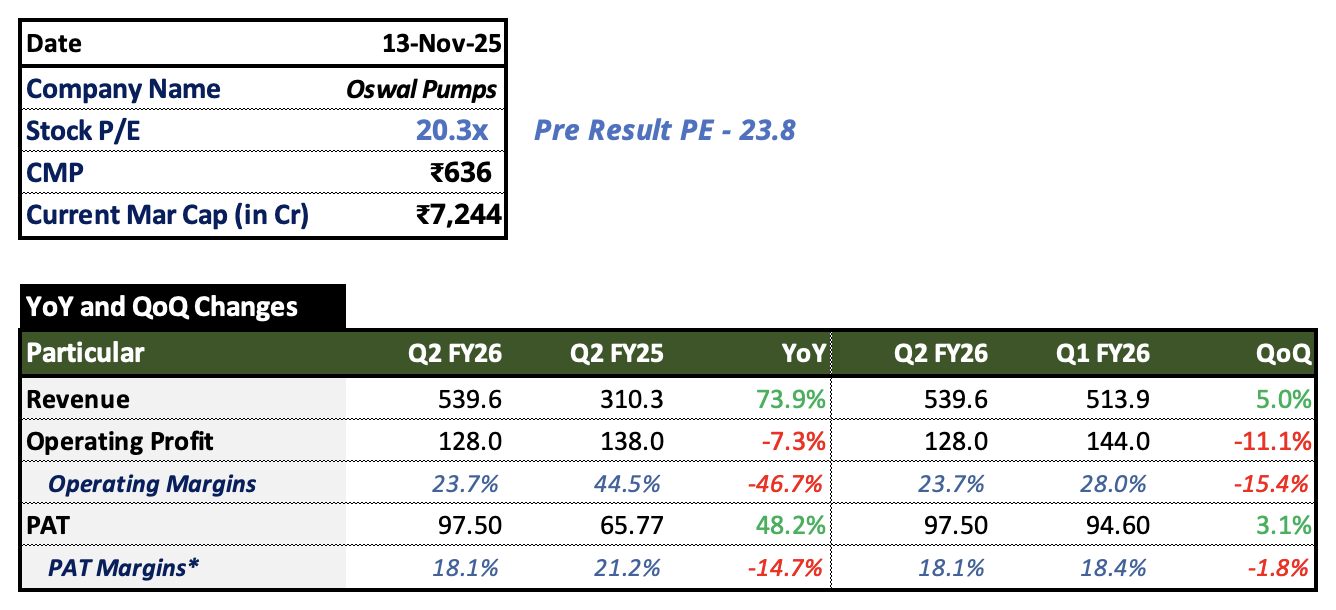
Rest company show very beautiful growth on yearly basis. On quarterly basis, Company has shown growth of 5% despite heavy monsoon this year, which shows the company’s great efficiency, last year in Q2 there was a drop of 20% sales growth because of monsoon
Management is very confident on their Revenue Growth Guidance of 50-60% in FY26 and 30-35% going forward for next 4-5 years.
Guidance for EBITDA margins are as follows:
– Q3 FY26: 25.5% - 26%
– Q4 FY26: 26.25% - 27%
– In Q2 FY26 EBITDA margins stands at 23.7% because of decrease in tender pricing and some one time expenses.
– Management is also working on cost cutting and more integration to improve 1% more EBIDTA margin by Q4.
Primary reason of decline in the margins is decrease in L1 price in PM Kusum and Magel Tyala Scheme, which fell by average of 7.5%.
One time other expense i.e. IPO expense of about 2.5 Cr also lowers the margins.
Company also sells 40 Cr of modules which has lower margin also decreases the overall margins.
These factor together decreases the EBITDA margins by 1.8%, company is expecting it will recover in Q3.
Company is doing more cost cutting and backward integration to improve margins by 1% more by Q4.
Receivables days stood at 138 Days as on 31 Sept 2025, Receivable days increase by some days because of RMS data in PM Kusum and Maghel Tyala under which pumps should be used for at least 90 days before payments are released but because of extended monsoon pumps were not used much that affects RMS data and Payments got delayed. This will be resolved in Q3 as monsoon ends.
KUSUM 2.0 will be announced by January, government will stop KUSUM 1 by 31 March 2025 and will not continue prior scheme further. Government is very aggressive for Kusum 2.0. As per management, Companies will get better benefits in Kusum 2.0 in terms of better payment structure, Bigger scheme etc.
State Government is not waiting for new KUSUM scheme they started their own schemes as per the demand and conditions.
Secondly, biggest consumer of DCR cell is Kusum Yojana if their will be delay in KUSUM 2.0 Scheme whole ecosystem will get impacted.
There is no concern about Volume and Growth of Solar Pump industry.
Management and their team is very much confident if the prices in Kusum may drop by 5-6%, their margins will decreases by 0.5%-1% only.
There is very less chance for more price drop as it will become non feasiable for EPC players to compete.
Number of Pumps executed in Q2: 48000 Pumps out of which, 23000 are Solar Pumps (11000-12000 from Magel Tyala).
Approximately 100 MW of Solar Pumps are needed for 20 Thousand Pumps.
In Haryana and Punjab, major demand is for 7.5-10 Hp pumps, In Maharastra 3-5 Hp pumps and in Rajasthan 5-7.5 Hp pumps.
5 Lakhs plus Pump capacity will be implemented by Q1 of FY27.
Company is not feeling any lag in capex plan and implementing on the defined pace.
Company doesn’t need any kind of cash to do further capex, as company has enough cash flows to do the capex.
Over all earning call was very good and get better understand how the future will be, and how manegement is tackling the pricing impact. Management is intact with their initial guidance of 50-60% on topline and 18-19% on PAT levels for FY26. Kusum 2.0 is expected to be announced in Jan 2026.
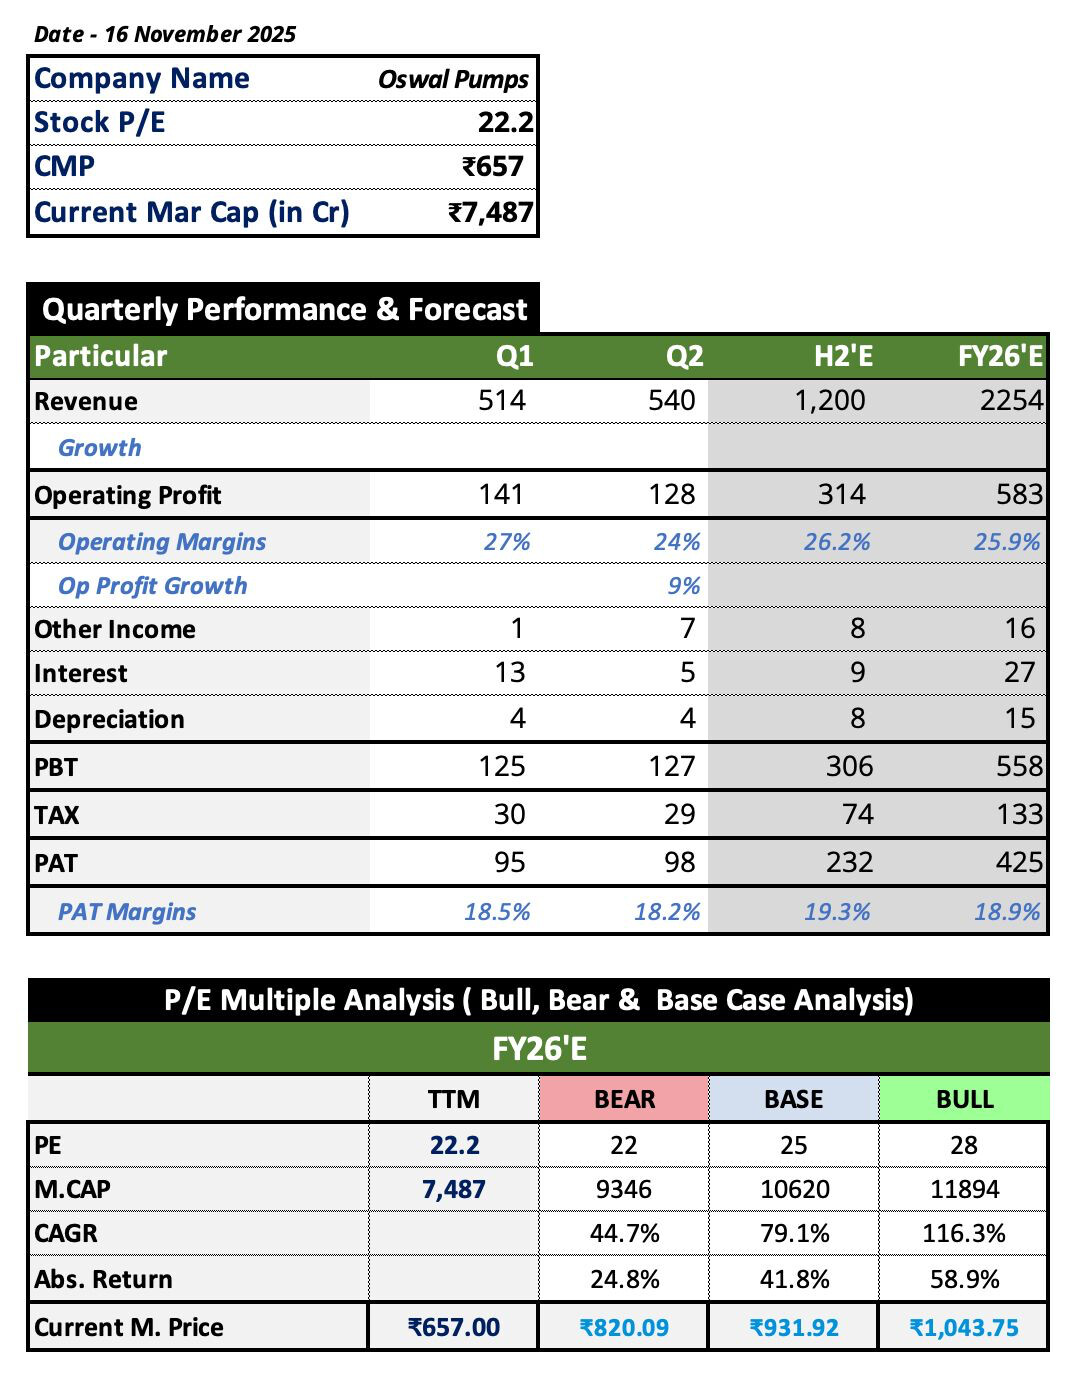
Assumptions for H2:
• Full year revenue: 57% growth from last year, Despite there is 45:55 (H1:H2) in solar Pump industry which makes H2 revenue around 1290, but I have taken management guidance which seems possible in base case scenario.
• Margins as per management guidance: 25.7% in Q3 and 26.5% in Q4.
• Interest, Depreciation and Tax, same as before.
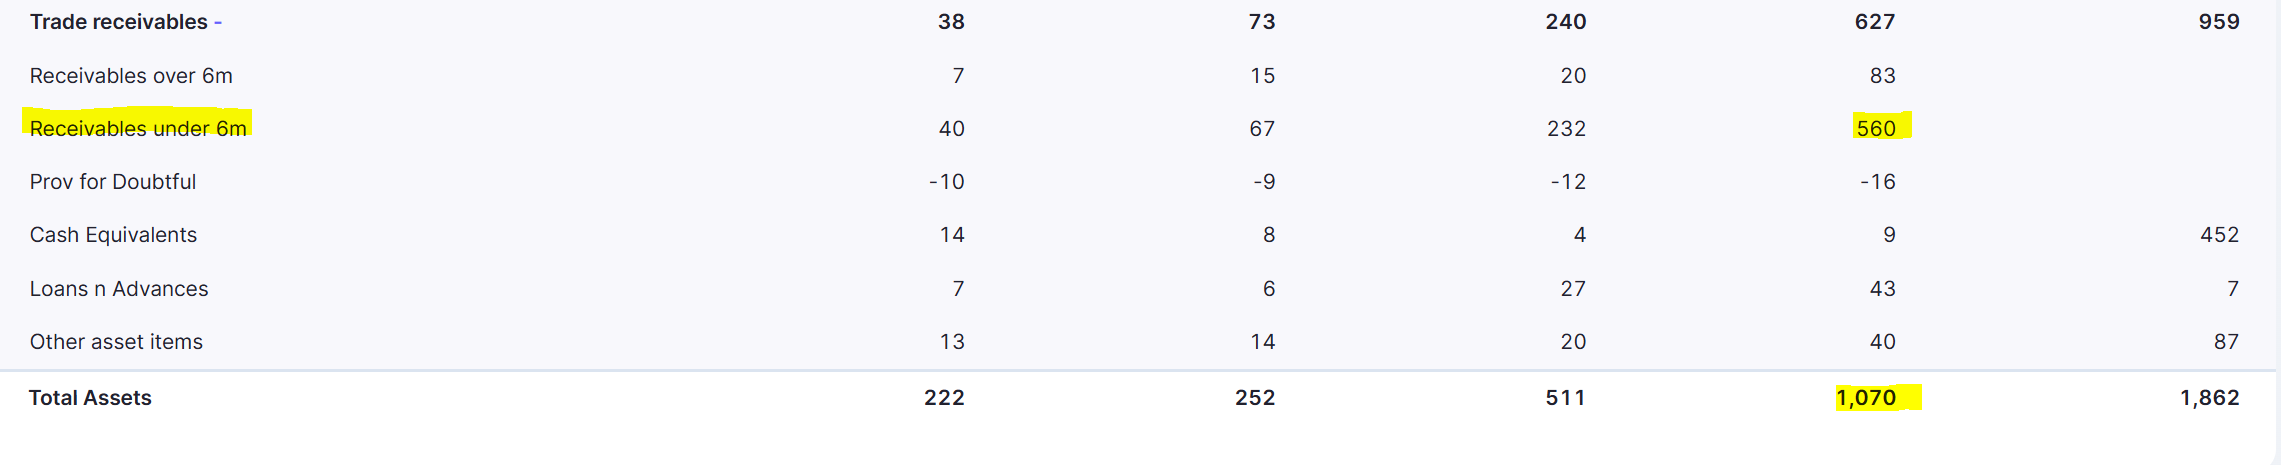
what is the impact of these short term receivables? They seems to be half of balance sheet from couple of years. Also, what could be the impact once institutional lock-in period ends.
These receivables will be resolve by next quarter as management said because of heavy monsoon installed pumps haven’t completed 90 running days. That’s why payment delays from those pumps. Working capital days again reduced to normal by next quarter.
Quarterly tracking template for management guidance tracking:
Metric / Guidance Item
Type of Target
Original Guidance / Target (Source)
Timeline
Q1FY26 Actual
Q2 FY26 Actual
Revenue Growth (FY26)
Explicit
50 to 6o% YoY growth in FY26 (Q1FY26 Concall, pg 4), reiterated in Q2
FY26
₹513.9 Cr; +36.8% YoY
₹539.6 Cr (+73.9% YoY)
EBITDA Margin
Explicit
in the range of 27-28%” (Q1FY26 Concall, pg 7). Q2 update: Q3 target 25.5–26%, Q4 target 26.25–26.75%,
FY26
27.40%
operating EBITDA 23.7% (–888 bps YoY)
Net Profit Margin
Explicit
around 18-20%” (Q1FY26 Concall, pg 7). Q2 revised to 17.5–19%
FY26
19.10%
17.8% YoY
Receivable Days
Explicit
“Target to reduce receivable days to 90 to 100 days” (Q1FY26 Concall, pg 5)
FY26
126 days
Receivable days 138 as of Sep’25 vs 126 in Jun’25 . CCC worsened from 136 → 157 days.
Capacity expansion – pumps
Increase pump capacity from 2 lakh to >5 lakh within a year” (Call p.15)[1]. Q2 PPT: intent to invest ₹898.6 Cr in plant & machinery/civil work for automation & expansion, target 5 lakh pumps by H1 FY27
By Q1 FY27/BY H1FY27
2 lakh installed; expansion orders placed[1]
utilization already high (SS pumps 93.9%, CI pumps 83.5%).
Order Book
29961 pumps, 700 to 800 cr
By Q3FY26
29961
Q2 order book 18,800 pumps (~₹500 Cr equivalent using same ASP math), pipeline >30,000 pumps.
New product launch — helical/industrial pumps
“First helical-pump samples by end-Q3 FY26; other industrial pumps to follow” (Call p.16)
Q3 FY26
N/A
Q2 FY26: no revenue contribution yet disclosed;
Solar Pump Installations
Explicit
“Target to install 1,10,000–1,20,000 solar pumps” (Q1FY26 Concall, pg 9)
FY26
N/A
In Q2 FY26 Oswal installed 23,000 solar pumps out of 48,000 total pumps;
Q2 FY26: 48,000 total pumps vs 51,000 in Q1 – i.e., 99,000 pumps in H1.Needs acceleration. To hit mid-point 2.30 lakh, H2 must deliver ~1.31 lakh pumps (≈32–33k per quarter above Q2 rate).
Private Market+Export
Q2 Concall: Aggressive push on dealer-distributor & export network — “FY27 will show strong private & export business”
FY27
N/A
Capex – Solar Module Line
Explicit
“1.2 GW solar module manufacturing capacity to meet DCR compliance” (Q1FY26 Concall, pg 12). Use IPO proceeds of ₹1,536.6 Mn to increase module capacity by 1,500 MW, in two phases: 0.75 GW in FY26, 0.75 GW in FY27; also integrate aluminium extrusion (₹433.6 Mn) and EVA manufacturing (₹268.1 Mn). Q2 concall: project shifted to adjacent land, but timeline unchanged.
FY26 commissioning/Phase-1 by FY26; Phase-2 by FY27
N/A
Current installed module capacity 570 MW, with H1 FY26 utilisation 72.9%. No new capacity yet reflected in numbers; land shift approved.
Q2 FY26 disclosure: only aggregate KUSUM + Magel Tyala revenue; specific Magel Tyala revenue for Q2 is not broken out; order book includes Magel Tyala within 18,800 pumps.
PM-KUSUM Dependence Mitigation
Inferred
“Explored large non-subsidy market; SBI loan tie-up for farmers (97% LTV)” (Q1FY26 Concall, pg 14)
FY26+
N/A
Q2 FY26: revenue mix still 70–75% solar (mostly PM-KUSUM), 20–25% non-solar, implying >80% of revenue still subsidy / tender-linked; exports targeted at ~4% of FY26 revenue but Q2 contribution not yet highlighted as material.
PM KUSUM 2
Q2 Update: to begin in Jan 26
Jan, 2026
N/A
Tender Rate Pressure
new EPC players are aggressively bidding lower – future tenders may see further rate pressure, though Oswal believes backward integration will protect margins.
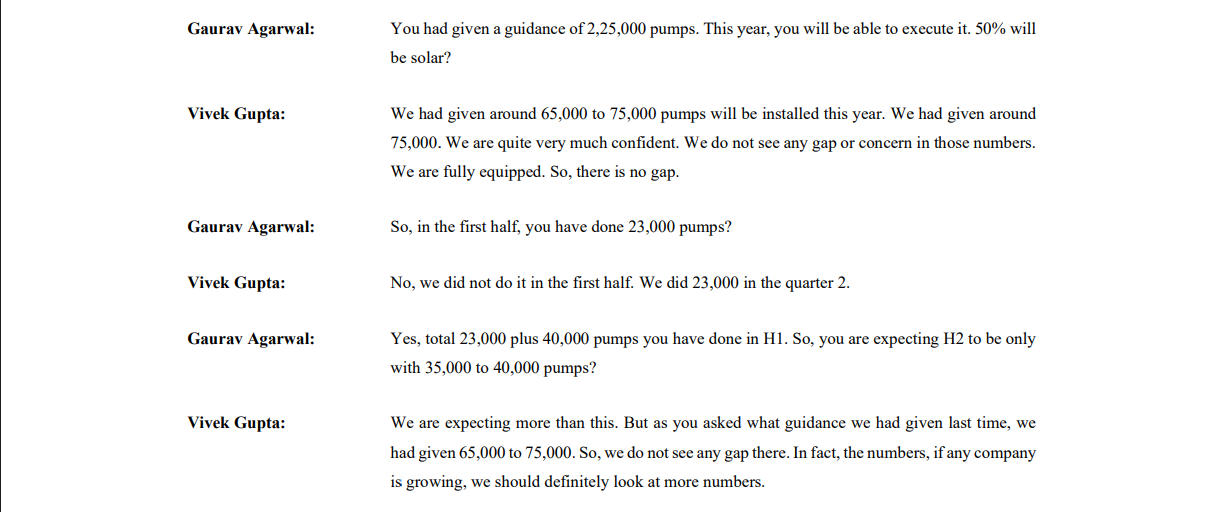
In Q2 concall the company just flipped from its past guidance regarding solar pump installations.
It was supposed to be around 45% to 50% of thier total pump installation target(101250 to 112500 solar pumps).They just denied their previous guidance of Q1 in Q2(65000 to 75000). I mean situation can be difficult but instead of accepting it they are choosing denial. Am I missing something
This is what ails Indian Stock market. On paper all seems great, fundamentals are fine and people take decision based on the figures they see, but unaware of what happens within the mind of the promoter/management.
Denial is the worst form of corporate guidance and we as investors cannot do anything.
As per my understanding, there will be some misunderstanding on both the side (on management side and on our side), because management didn’t decline Revenue Guidance, it seems easily possible to achieve what management said i.e. 50-60% Revenue growth. So, on number of pumps there might be some wrong number quote by management. If management gives wrong guidance on Number of pumps, Revenue guidance can’t be met.
As per management’s guidance, increasing competition from local players has led to a reduction in prices. As a result, the company had to install a higher number of pumps than what it had originally targeted for Q1 in order to achieve its target revenue guidance of 50-60%. For that company needs to have a very strong order book and bid book. Any decrease in volumes can result in company not achieving its target.
Downside risk stems from a mix of factors: the erosion of EBITDA (due to competition), panic and break-evens (with prices falling below the IPO price), and uncertainty around the future of PM-KUSUM 2 and its components.
The management is very positive about PM-KUSUM 2, as are other industry players like GK Energy. Some quotes from their conference call illustrate this optimism:
> “The official opportunity size is yet to be announced. But briefly, the success of PM-KUSUM has been demonstrated openly at the International Solar Alliance (ISA) by the Government of India, giving a suggestive direction to other peer countries to implement solar Agri-pumps. This shows a very positive belief in the segment from the government side. We are expecting a very good number, and the industry believes it will be no less than 3x the scale of the previous PM-KUSUM scheme.”
> “Component B is the most successful business model within the PM-KUSUM segment. The addressable market is so large that we are unable to cover the entire volume, even at a certain percentage annually.”
Therefore, the entire investment thesis now hinges on the preservation of EBITDA and the successful launch of PM-KUSUM 2 , with Component B acting as a significant contributor.
Although I’am not sure of big players having any insider info regrding the launch of PM KUSUM 2 or its components weightage. Whatever the case might be I will wait untill the knife keeps falling. Disclaimer- Invested around 2% @ 680 level.