Some reports on projected earnings update after Tax Cut:
HDFC Securities:
Nirmal Bang:
Disc: No recommendation, for educational purposes only.
Some reports on projected earnings update after Tax Cut:
Disc: No recommendation, for educational purposes only.
The Nifty P/E which is documented on the NSE website - is it a forward P/E or is based on past results?
https://www.nseindia.com/products/content/equities/indices/historical_pepb.htm
It is categorised under “Historical Data”, so it is obviously based on past results. Forward P/E is not data, it is hope.
That’s what I had also assumed.
But check the sharp decline in Nifty P/E on 25th of Sept. The only reason which could explain such a sharp decline is that it’s Forward P/E which got reevaluated after the decrease in Corporate Tax.
Hi
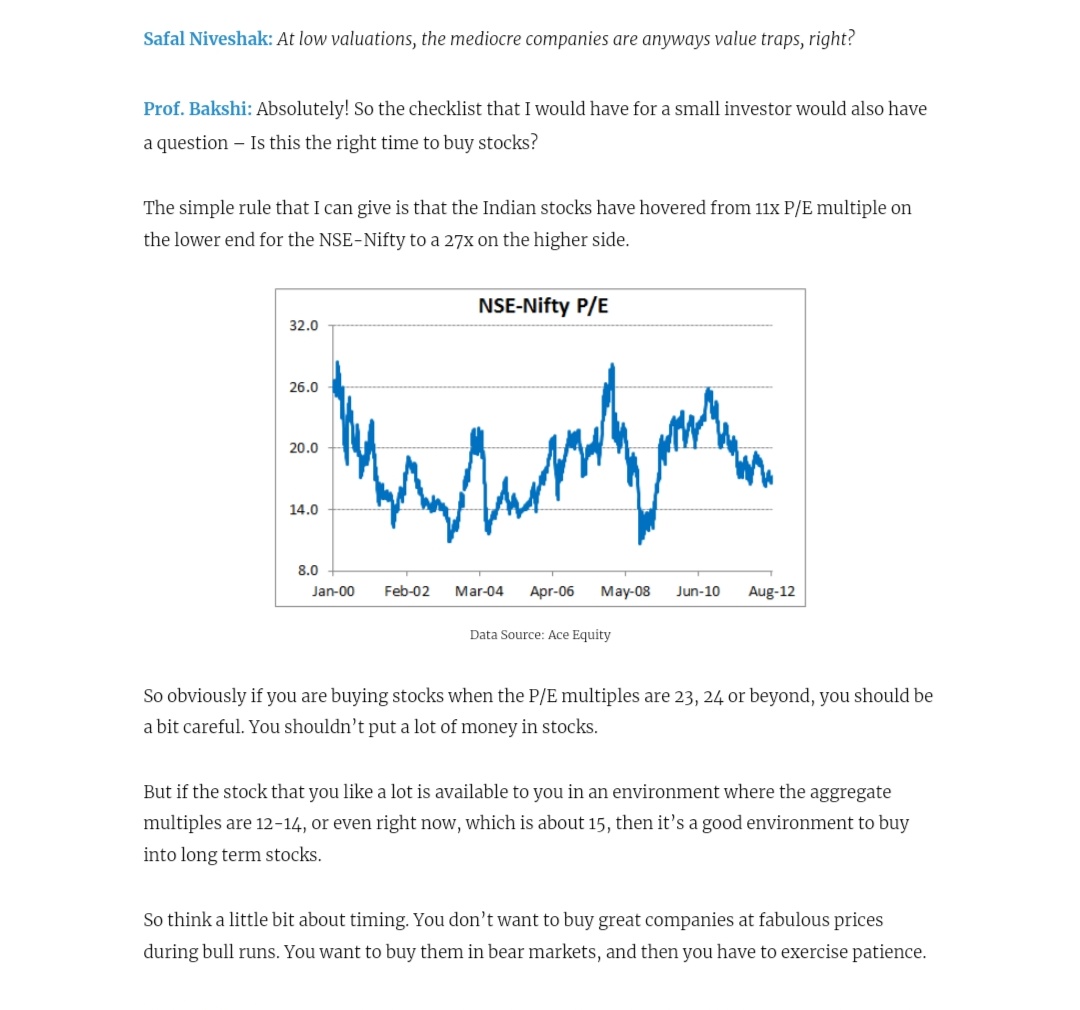
Was trying to go through old views of Prof Bakshi on concentration vs diversified portfolio construction after going through his excellent deck on non ergodic aspect of Investments and found this old interview of 2012.
Rgds
Hi
Not much activity here. As most of the bearish stance on overall index has led to nothing. The new term ‘Quality Bubble’ continues swelling unabated. While the index only goes higher. The PE ~28 remains. I believe its been for 2+ years around this level now.
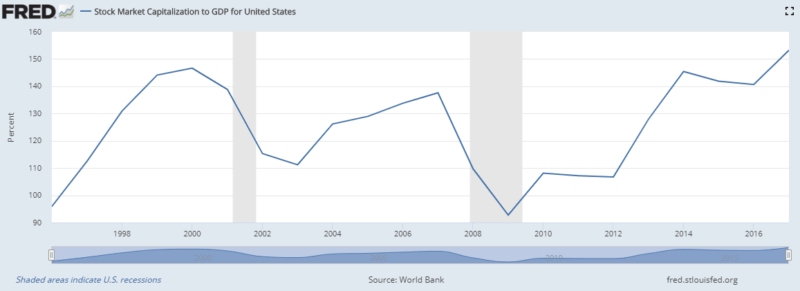
Wanted to share the news article I came across on the Buffett indicator today morning.
Draw your own conclusions ![]()
Happy investing in 2020.
Regards
Deepak
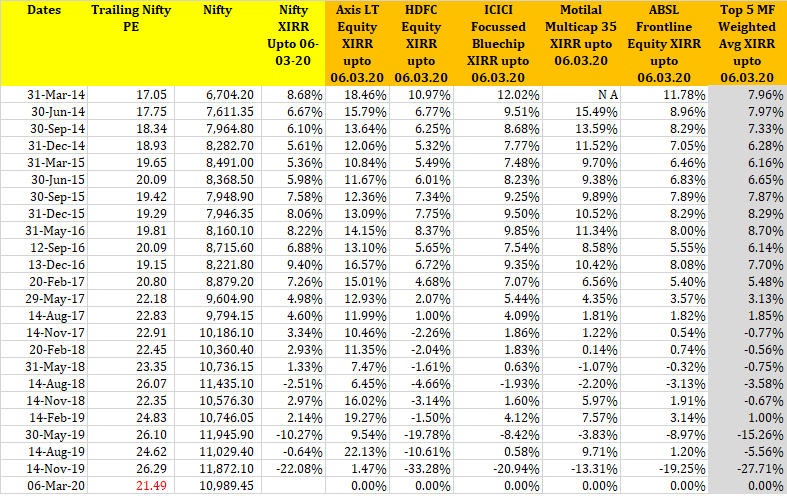
Nifty is down by 9.69% YTD as of 06.03.2020 and Bloomberg shows current Nifty PE to be 21.49.
I have spent some weekend time trying to once again correlate Nifty PE levels and Nifty Returns.
Nifty EPS data used is as computed by @diffsoft since BSE website gives only standalone EPS data and I could not find historical consolidated EPS data readily available anywhere else.
The main objective of this analysis was to test the argument of ‘Buy and Hold forever’ as against the argument of ‘Trying to time the market’.
Sharing some insightful results
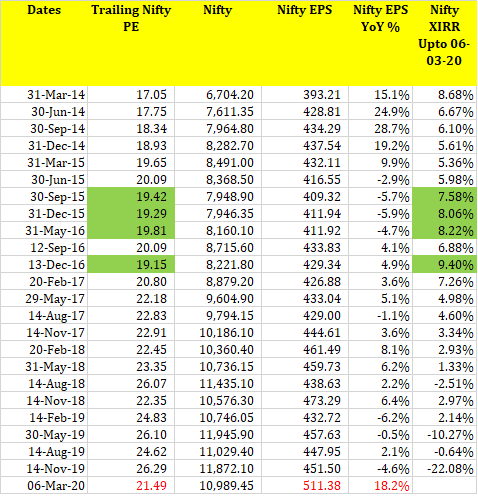
In the above table, the last column ‘Nifty XIRR’ shows what would have been the CAGR Returns upto 06.03.2020 had one bought Nifty on a particular date. These are pre-tax returns and exclude dividends.
Since around begining of 2017, Nifty PE has consistently been above 20. In fact, most of the times, Nifty PE has been above 22.
Whenever Nifty was bought at PE greater than 20, the returns upto 06.03.2020 have almost always failed to beat the benchmark risk free interest rate of 6-7%.
Whenever Nifty was bought at PE greater than 22, the returns upto 06.03.2020 have failed to beat even Savings Interest rate offered by some banks like Kotak.
On the whole, had one bought and held Nifty on any of these dates, your XIRR upto 06.03.2020 would not have crossed 10%. Had one bought and held Nifty on almost all dates after 01.01.2017, the XIRR upto 06.03.2020 would have not beaten the benchmark risk free rate.
There is another argument which says Mutual Funds have outperformed Nifty, hence the same comparison ought to be made with Mutual Funds as well. The problem in doing that is in selecting which Mutual Fund to compare with. With the benefit of hindsight, it is very easy to get biased in favour of or against the best / worst performing funds. I have tried to do that with five of the largest Large Cap Mutual Funds (in terms of closing AUM and inflows during this period) since they would be directly competing with Nifty ETFs .Pls note: I have intentionally not considered similar funds of same Fund house such as HDFC Top 100 fund as it has similar portfolio,style and same fund manager as HDFC Equity.
The last column is the weighted average return after assigning equal weight to each Fund.
As can be seen the results are very similar to the Nifty Index. In fact if one observes closely, this basket of Mutual Funds have underperformed the Nifty Index consistently since around Mid 2016.
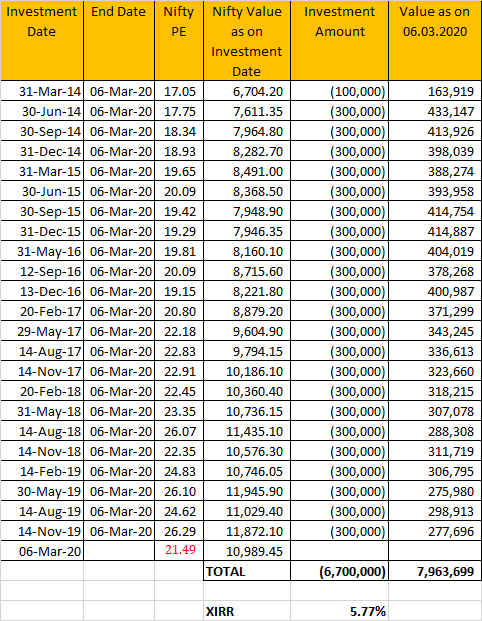
There is one more argument against timing of markets which says that systematic investments like SIP would eliminate the need to Time the markets. I have tried to calculate XIRR of SIP returns in the Nifty made on these dates at the pace of roughly Rs 1 lakh per month (Rs 3 lakh per quarter) as computed in the table below:
I must admit I was a bit lazy and have taken the same dates as per 1st table (One can take monthly values of dates for a more accurate analysis). As can be seen in the table, XIRR of an SIP in Nifty as on 06.03.2020 is a mere 5.77%. Once again this is below the benchmark risk free rate of return.
Of course one has to perform similar analysis in time when market is at an all time high, in which case those who are holding cash / debt funds trying to time the market would seem to be the stupider category of investors.
Over the last few years, I have read and heard multiple times that timing the market does not matter. However times like these provide some reassurance that the writings of Ben Graham and Prof Bakshi are very much relevant even today.
To me the statistical ‘entry barrier’ in the Nifty seems to be when the PE goes below 20 (Would be hit when the Nifty level would fall to 10,220). Till then I would not aggressively buy the index.
Disc - I am a very risk averse investor and have held more than 50% of funds in FDs, Debt funds over last 3 years and at one time this level even reached 80%. In hindsight these funds have earned 7-10% returns pre tax. Now started to deploy funds in the Nifty Index over last few days.
Not anymore. We were waiting for this…Time to deploy cash will soon arrive. Waiting for NIFTY VIX to spike above 30 to start adding.
No purchases since Feb-2018 (except for a small equity purchase in Aug-2019). Existing equity/ETF portfolio down -23%. Lupin, BSE biggest culprits. Gold ETF & SGB have done well in my portfolio.
What is the rationale behind this?
My position is same … waiting patiently for past 2 year for average pe +/- 1 std. deviation to invest.After todays correction the pe of nifty will be 24 and long term average is around 22 so also with +1 std deviation. This will be a good time to invest.
Can we now say “Buffett Indicator” was doing its job? ![]()
Hi Vasu
Yes for me it has actually been 2 years sitting on a large cash allocation.
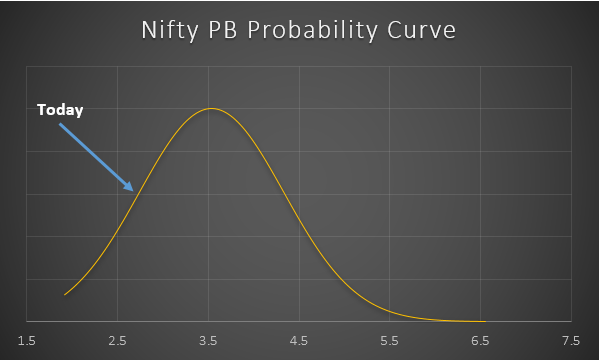
Today for the first time since then I think on the probability curves the index valuation reached 80%. So lets see from where it goes. I would personally not still deploy a large chunk.
With all the caveats of standalone, etc etc. It is for trend and reversion to mean purpose as I have pointed out
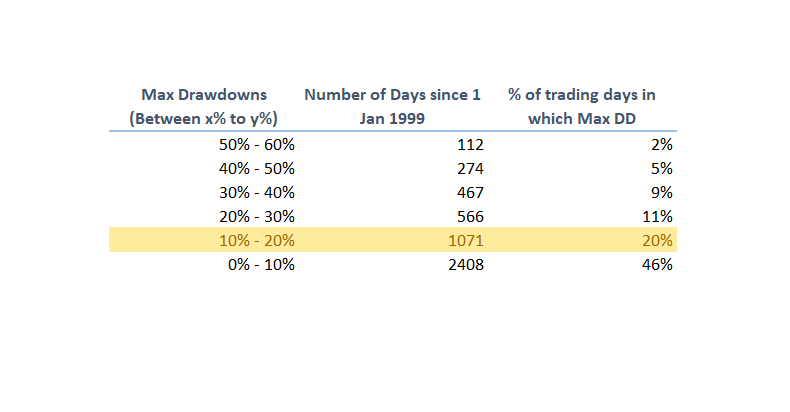
Also most of us are surprised with this fall in the last few days owing to many factors which I will ignore naming. But if one looks carefully at the Maximum Drawdown history of the Nifty50 index from 1 Jan 1999 we are doing ok and things are normal as such.
Today we have roughly 15.5% drawdown of the index and that happens 20% of the times in the 21 years. So we should not be assuming this to be a rare event. The data below.
Lets see how things pan out. I took out all my hedges on Friday perhaps a little premature. But have deployed some capital.
All the best to everyone in the coming phases.
Regards
Deepak
NIFTY VIX is a fantastic behavioural indicator. A spike above 30 indicates extreme fear and is rare. Works well with severe market corrections.
Took a small bite out of a tyre manufacturing company. Works well with the oil price plunge. Great times ahead.
Hmm, it’s 32.49 now.
It is good to quantify patience by considering VIX above 30 but this is only a symbolic and not guaranteed indicator to initiate accumulation. In Jan to March 2016 crash (~24% from high) VIX was trading comfortably below 30 - is it safe to say that markets were not attractive/cheap for buying then at 6800 levels but now are at~10400 levels.
Last time, I started invested heavily was in Aug-Sep 2015, when the VIX spiked above 30 briefly. I kept accumulating all the way until Jan 2016, when I ran out of cash. I did pretty well with those investments.
I didn’t do well when I thought I would pick quality stocks irrespective of market levels. Not my cup of tea.
Based on my prior experience, I now invest only when the indices are trading in a lower range that I am comfortable with. When VIX spikes in this lower range, its an added signal to start accumulating. VIX levels represents fear and complacency. Its a way to quantify Buffett’s saying “Be fearful when others are greedy and be greedy when others are fearful.”
VIX in combination with PE or Index correction is a more realistic accumulating indicator than VIX alone.
Order of priority to achieve financial success in life is as below:
Financial Planning
Cash Flow Analysis (estimating future inflow and outflows)
Asset Allocation
Security Selection
Rebalancing according to changing market conditions and individual circumstances.
If the steps are followed diligently, then ample cash will remain in one’s wallet.
Conceptually, if markets are lower by 20% from highs, it is already discounting fear. Under such market conditions, waiting for VIX to go above pre-decided threshold can produce a false signal , like in JAN -MARCH 2016.
Macro numbers are not encouraging… Even before all this virus issue came to light…
I think virus was just an excuse which caused the fall… But in reality our valuations are still not encouraging, given the macro numbers…Even after such a fall and corporate tax cut nifty PE is at 24. People will argue that some companies are still growing… agreed but those are the top of the pyramid… Once the chain bottom of the pyramid stops they will also be susceptible to slow down… So far thats not the case yet… Let hope for the economic revival…
In the past it was the sentiment revival which took the market to new heights. I fear this time we need fundamental macro recovery.
Hi
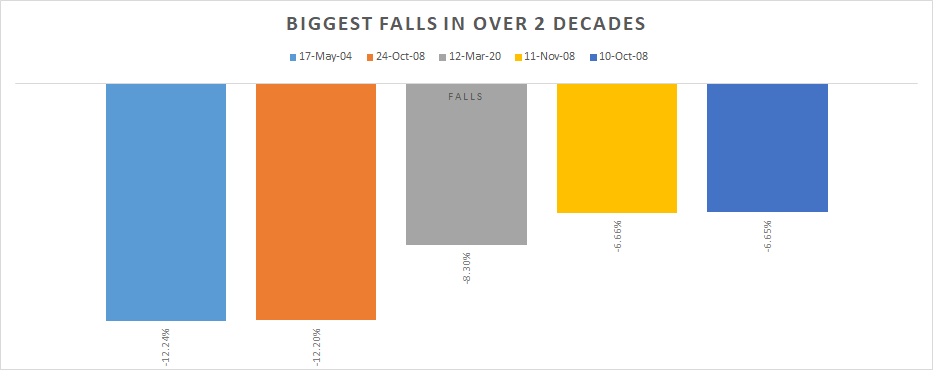
We saw one of the most brutal days since 1999 today. Most of us on the forum including myself had only witnessed 2008 from the outside. I used to be a Finance student then. Irony!
Anyways the speed with which we have seen this drawdown happen is astonishing but we have media comparing it to 2008. 2008 had many such days actually ![]()

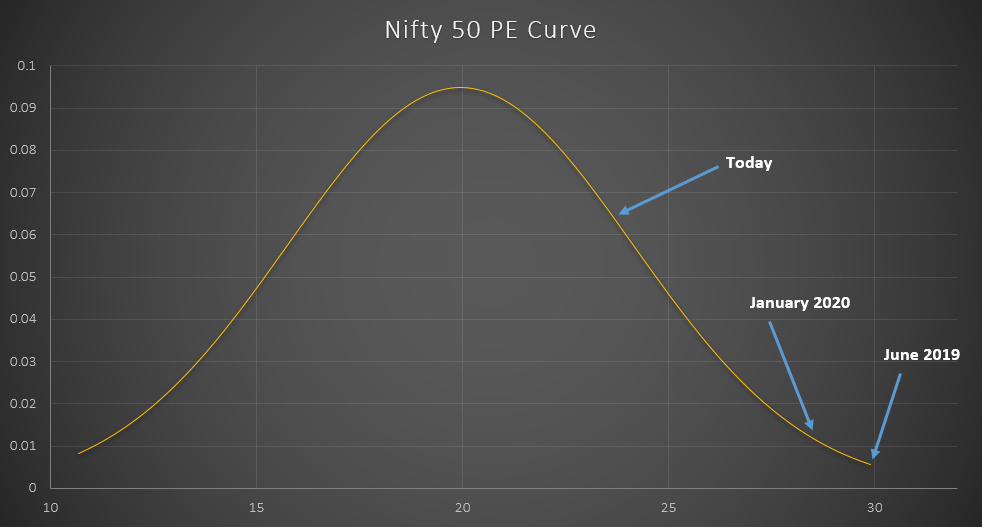
Coming back to NSE reported PE & PB (all the caveats as mentioned earlier, only for mean reversion purpose).
On the PE we have reached 67th percentile. My plan few years ago was to start adding below 75th.
Last time we saw such a level was in December 2016 after the demon episode.
On the PB side as reported by NSE we have reached the 15th percentile. We had been hovering for 1+ years around the median levels. Last time we were at 15 or so percentile was in September 2013.
Again we dont know how much lower we could go because of the multitude of reasons in the world at the moment but we are witnessing a major turn of events.
All the best to your trading! Deploy your money wisely.
Regards
Deepak