Nifty PE crosses 24|A statistically informed entry-exit model!

Typical US inflation is 2-3%. If Buffet has made 25% CAGR then he has beat the inflation by 22%. If India’s typical inflation is 8%, then you need 30-31% CAGR to match Buffet. For instance, a guy in Zimbabwe may make 50% CAGR in a 50% inflation - it means nothing.

The inflation and risk free rate needs to be accounted for when calculating P/E, Returns, RoE etc. For example, an RoE of 20% for US company is 17-18% above inflation. 20% RoE for an Indian company is not all that great.

3 Likes

I am not in the US. There are places like Singapore and Dubai where you don’t have to pay tax on foreign income.
@prem_shankar I know I am not WB :). I am grateful if I can hit 12 to 15% and if once in a while I get a good ride above it I am even more grateful.

Please do understand that I am not a proponent of high valuations. I am a pure value investor and absolutely finding difficult to get investment ideas in my value paradigm. Low full tosses are getting increasingly difficult to find.

What I’ve elaborated is what I’m seeing in the market. More and more people are getting into equity. Friends who used to say “Share market is gambling” just a year back are now coming and asking advice about investing in equity. That does make me cautious.

Most of this rally is driven by huge liquidity and due to almost no choice of other investment avenues. We have to decide whether we want to sit on sidelines (which many have been for 2 years now) or participate with our high conviction ideas. I’ve opted for the later. Fully understanding that one can get a good cut in portfolio. But then portfolio has been giving 60% CAGR in last 3 years, so definitely can take a 30% cut.

-Jiten Parmar

5 Likes

A wonderful example of what a drawdown does. Kudos @bheeshma

1 Like

This is inspiring and sobering at the same time.

Inspiring to know that value investing works and there are some great examples like yourself on this forum. Thanks for being an inspiration to all of us on this forum.

Sobering to know that the high returns earned by my portfolio in the recent years is due to the process and not because of any special talent / insight that I have.

1 Like

Gentlemen. We have a wonderful visually explanatory module built and shared by @sandeeprawat and I recommend anyone to install it.

This is what it shows today.

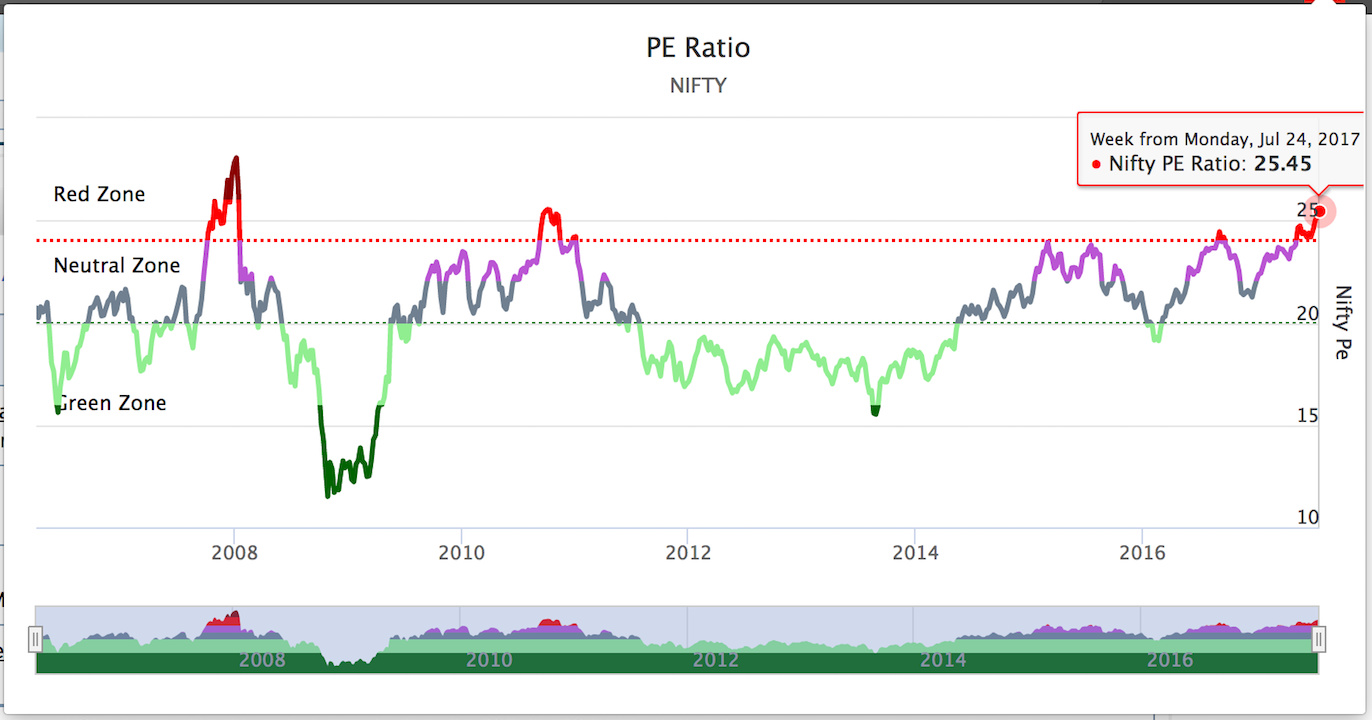
Inferences can be drawn. Basically, what I see is that even if we get a very set of good results, the PE ratio might decrease to 23.5 or so if at all as there might be laggards too… but more importantly, how many times have we seen such exuberance over the last 10 years… and what has followed. This very wonderful chart which auto updates would keep anyone sober and also give courage when it is the right time to invest from a pure Mr. Market perspective.

4 Likes

Thanks. Quiet a lot of the returns are due to sectoral allocations and commodity/cyclical positions. Of course, a lot of very long term stocks have done very well too. And we must thank the market for it.

Also, avoidance of certain sectors like pharma/IT in last 2 years aided a lot.

I always say, 2 things are important in investing and outperformance.

  1. Knowing where to invest
  2. Knowing where not to invest (this is something which many investors don’t give enough thought to)

-Jiten Parmar

6 Likes

Sorry, you won’t be 1/3rd as successful as WB by earning 1/3rd CAGR as WB. If you and WB start with Rs 10,000, and you and WB earn 7% and 21% CAGR respectively, guess how much you will have at the end of 30 years? You - Rs 76,122. WB - Rs 30,44,816.

1 Like

I knew that was coming :). Yes, that’s a fact. To clarify, in the current
environment I am happy with 7% in the current cycle, right now. Will
allocate back into stocks when the time is right.

@sandeeprawat thanks for sharing such info. However, do you have any info regarding the p/b ratio around the same period? I am not much of a technical guy but I was talking to a friend of mine once and he said unless the p/b ratio goes above 4-5 the chances of a big fall are less.

In this huge ocean of information would love to receive some info regarding the above opinion of my friend.

Did some digging and got this from the NSE website. not sure if this is the best way to present. (How do I add an excel attachment?)

Date P/E P/B
08-Jan-07 21.08 5.03
09-Jan-07 20.97 5
10-Jan-07 20.64 4.92
11-Jan-07 21.04 5.04
12-Jan-07 21.63 5.16
15-Jan-07 21.77 5.19
16-Jan-07 21.67 5.19
17-Jan-07 21.59 5.19
18-Jan-07 21.74 5.23
19-Jan-07 21.43 5.21
22-Jan-07 21.42 5.22
23-Jan-07 20.96 5.18
24-Jan-07 21.07 5.21
25-Jan-07 21.35 5.29
29-Jan-07 20.88 5.26
31-Jan-07 19.85 5.2
01-Feb-07 19.95 5.27
02-Feb-07 20.12 5.33
05-Feb-07 20.27 5.37
06-Feb-07 20.18 5.35
07-Feb-07 20.32 5.38
08-Feb-07 20.31 5.38
09-Feb-07 20.14 5.33
12-Feb-07 19.52 5.17
13-Feb-07 19.45 5.15
14-Feb-07 19.47 5.15
15-Feb-07 19.94 5.28
19-Feb-07 20.02 5.3
20-Feb-07 19.74 5.23
21-Feb-07 19.69 5.22
22-Feb-07 19.42 5.14
23-Feb-07 18.94 5.02
26-Feb-07 18.95 5.02
27-Feb-07 18.72 4.96
28-Feb-07 18.01 4.77
01-Mar-07 18.33 4.86
02-Mar-07 17.92 4.75
05-Mar-07 17.2 4.56
06-Mar-07 17.58 4.66
07-Mar-07 17.44 4.62
08-Mar-07 18.09 4.79
09-Mar-07 17.88 4.74
12-Mar-07 17.96 4.76
13-Mar-07 18.14 4.8
14-Mar-07 17.51 4.64
15-Mar-07 17.53 4.64
16-Mar-07 17.36 4.6
19-Mar-07 17.7 4.69
20-Mar-07 17.79 4.71
21-Mar-07 18.11 4.8
22-Mar-07 18.65 4.94
23-Mar-07 18.58 4.92
26-Mar-07 18.38 4.87
28-Mar-07 18.1 4.79
29-Mar-07 18.29 4.84
30-Mar-07 18.4 4.87
02-Apr-07 17.49 4.63
03-Apr-07 17.77 4.71
04-Apr-07 18.43 4.89
05-Apr-07 18.54 4.91
09-Apr-07 19 5.03
10-Apr-07 19.02 5.04
11-Apr-07 19.09 5.03
12-Apr-07 18.93 4.99
13-Apr-07 19.28 5.1
16-Apr-07 19.75 5.23
17-Apr-07 19.55 5.19
18-Apr-07 19.66 5.22
19-Apr-07 19.57 5.21
20-Apr-07 19.88 5.32
23-Apr-07 19.88 5.32
24-Apr-07 20.13 5.4
25-Apr-07 20.24 5.43
26-Apr-07 20.25 5.44
27-Apr-07 19.58 5.32
30-Apr-07 19.48 5.33
03-May-07 19.76 5.41
04-May-07 19.59 5.36
07-May-07 19.56 5.36
08-May-07 19.39 5.31
09-May-07 19.36 5.32
10-May-07 19.31 5.3
11-May-07 19.35 5.31
14-May-07 19.54 5.39
15-May-07 19.46 5.36
16-May-07 19.7 5.43
17-May-07 19.93 5.49
18-May-07 19.78 5.48
21-May-07 19.83 5.54
22-May-07 19.91 5.57
23-May-07 19.78 5.53
24-May-07 19.59 5.47
25-May-07 19.98 5.53
28-May-07 20.02 5.54
29-May-07 20.11 5.59
30-May-07 20.17 5.53
31-May-07 20.41 5.59
01-Jun-07 20.41 5.59
04-Jun-07 20.27 5.48
05-Jun-07 20.35 5.5
06-Jun-07 19.94 5.39
07-Jun-07 19.85 5.37
08-Jun-07 19.69 5.32
11-Jun-07 19.69 5.33
12-Jun-07 19.74 5.34
13-Jun-07 19.54 5.28
14-Jun-07 19.81 5.36
15-Jun-07 19.82 5.36
18-Jun-07 19.7 5.33
19-Jun-07 20.02 5.41
20-Jun-07 20.19 5.46
21-Jun-07 20.28 5.48
22-Jun-07 20.2 5.31
25-Jun-07 20.32 5.32
26-Jun-07 20.44 5.36
27-Jun-07 20.34 5.33
28-Jun-07 20.42 5.35
29-Jun-07 20.6 5.4
02-Jul-07 20.62 5.39
03-Jul-07 20.83 5.45
04-Jul-07 20.84 5.45
05-Jul-07 20.81 5.44
06-Jul-07 21.11 5.52
09-Jul-07 21.27 5.56
10-Jul-07 21.2 5.55
11-Jul-07 21.06 5.52
12-Jul-07 21.35 5.6
13-Jul-07 21.63 5.67
16-Jul-07 21.78 5.71
17-Jul-07 21.65 5.69
18-Jul-07 21.64 5.69
19-Jul-07 21.86 5.77
20-Jul-07 21.76 5.35
23-Jul-07 22 5.42
24-Jul-07 22.01 5.42
25-Jul-07 21.71 5.38
26-Jul-07 21.71 5.42
27-Jul-07 20.87 5.21
30-Jul-07 20.34 5.21
31-Jul-07 20.49 5.31
01-Aug-07 19.65 5.1
02-Aug-07 19.72 5.12
03-Aug-07 19.93 5.17
06-Aug-07 19.65 5.1
07-Aug-07 19.72 5.12
08-Aug-07 20.2 5.24
09-Aug-07 19.94 5.17
10-Aug-07 19.63 5.09
13-Aug-07 19.81 5.14
14-Aug-07 19.77 5.14
16-Aug-07 18.9 4.92
17-Aug-07 18.58 4.83
20-Aug-07 19.04 4.95
21-Aug-07 18.43 4.79
22-Aug-07 18.79 4.73
23-Aug-07 18.62 4.69
24-Aug-07 18.96 4.77
27-Aug-07 19.47 4.9
28-Aug-07 19.55 4.92
29-Aug-07 19.72 4.96
30-Aug-07 19.96 5.02
31-Aug-07 20.2 5.08
03-Sep-07 20.25 5.1
04-Sep-07 20.27 5.1
05-Sep-07 20.26 5.1
06-Sep-07 20.45 5.15
07-Sep-07 20.41 5.14
10-Sep-07 20.4 5.13
11-Sep-07 20.35 5.12
12-Sep-07 20.35 5.12
13-Sep-07 20.5 5.16
14-Sep-07 20.45 5.03
17-Sep-07 20.34 5.01
18-Sep-07 20.57 5.06
19-Sep-07 21.42 5.27
20-Sep-07 21.49 5.29
21-Sep-07 21.89 5.39
24-Sep-07 22.18 5.26
25-Sep-07 22.21 5.27
26-Sep-07 22.21 5.27
27-Sep-07 22.49 5.33
28-Sep-07 22.58 5.36
01-Oct-07 22.79 5.41
03-Oct-07 23.43 5.56
04-Oct-07 23.42 5.56
05-Oct-07 23.62 5.66
08-Oct-07 23.16 5.55
09-Oct-07 24.26 5.82
10-Oct-07 24.78 5.94
11-Oct-07 25.13 6.03
12-Oct-07 24.67 5.93
15-Oct-07 25.77 6.19
16-Oct-07 25.71 5.9
17-Oct-07 25.2 5.78
18-Oct-07 24.33 5.6
19-Oct-07 23.46 5.45
22-Oct-07 23.28 5.42
23-Oct-07 24.53 5.72
24-Oct-07 24.66 5.75
25-Oct-07 25.01 5.82
26-Oct-07 25.57 5.96
29-Oct-07 26.35 6.18
30-Oct-07 26.01 6.15
31-Oct-07 25.74 6.18
01-Nov-07 25.65 6.15
02-Nov-07 25.94 6.21
05-Nov-07 25.57 6.13
06-Nov-07 25.31 6.06
07-Nov-07 25.29 6.06
08-Nov-07 24.92 5.97
09-Nov-07 24.77 5.93
12-Nov-07 24.57 5.89
13-Nov-07 24.92 5.97
14-Nov-07 25.98 6.22
15-Nov-07 25.87 6.2
16-Nov-07 25.86 6.2
19-Nov-07 25.87 6.2
20-Nov-07 25.32 6.06
21-Nov-07 24.35 5.83
22-Nov-07 24.17 5.79
23-Nov-07 24.53 5.88
26-Nov-07 25.07 6.01
27-Nov-07 24.92 5.98
28-Nov-07 24.57 5.89
29-Nov-07 24.65 5.91
30-Nov-07 25.21 6.05
03-Dec-07 25.66 6.15
04-Dec-07 25.63 6.15
05-Dec-07 25.98 6.23
06-Dec-07 26.05 6.25
07-Dec-07 26.14 6.27
10-Dec-07 26.08 6.26
11-Dec-07 26.68 6.4
12-Dec-07 27.69 6.44
13-Dec-07 27.23 6.33
14-Dec-07 27.19 6.32
17-Dec-07 25.97 6.01
18-Dec-07 25.81 5.97
19-Dec-07 25.85 5.98
20-Dec-07 25.92 6
24-Dec-07 26.91 6.23
26-Dec-07 27.29 6.32
27-Dec-07 27.36 6.33
28-Dec-07 27.35 6.33
31-Dec-07 27.62 6.39
01-Jan-08 27.64 6.4

@v31 @sandeeprawat

It is very difficult to place any faith in the PB ratio… it is determined by what are the index constituents of the time… if the index constituents are banks you will see a different story and if they were changed to manufacturing then we would see a different story.

So, as I was asked by a friend and I will reproduce here… he said, what is the value of the PE ratio…

I told him, think you are buying a business. The owner of the business advises you that he makes a profit of 1 lac rupees. Now from this profit, the business owner decides how much to take home (dividend) and how much to keep in the business (retained) but his selling price of the business today is 25 lacs for something that makes 1 lac a year. Does it seem reasonable? Are you willing to buy it?

Now, then as is the market, we come around to low pe, roce, roe and so many more complications…

If one kept it simple… the chart shows most of the times are buying opportunities and 3-4 times a decade are selling opportunities.

1 Like

Can we find out the PEG for Nifty? sorry for asking a naive question. Would that give a more accurate depiction as compared to p/e ?

Thats an interesting question and I never checked that before but I would still say, it is just like p/b ratio; any ratio when mixed with another ratio can show something else and that’s how markets get overvalued. I still like the old… kitna paise dene padenge and kitna paisa kamaai hogi?

PEG RATIO depends on accurate prediction of growth. Last 3 years there is only 2% growth in EPS after predicting 10-15% growth. So trailing PE is better to build a model for entry exit.

1 Like

I have been reading about the works of elliott of late and reading always helps to broaden your thought process ( even if you dont agree at that moment in time). Basically he hypothesized that rallies and corrections move in 8 wave patterns. With a 5 wave upmove and 3 wave downmove. In the 5 wave upmove there are 2 waves that are corrections - wave 2 and wave 4. After the 5th wave finishes we become due for a 3 wave downmove that is bigger than the 2nd or the 4th wave of the 5 wave upmove.

There are some rules to wave counting that one can google but the most interesting one is that wave 3 ( of the 5 wave upmove ) is never ever the shortest wave and is most frequently the longest move and is usually 162% the size of wave 1. If by chance it exceeds the 162% level then we have something called a wave extension which takes wave 3 even higher ( how much higher is any ones guess ).

At todays levels - NIFTY has just done 100% of wave 1 and is expected to do 161.8% of wave 1 according to the theory.

Perhaps experienced guys can share their thoughts and views on the same.

Best
Bheeshma

1 Like

Isn’t the 100% the 5th move?

According to the theory - the 5th move will be 38% or 62% of the distance from point 0 to the end of wave 3 or it will be equal to wave 1 ( i.e 100% of wave 1 ).

If we take 2004 as 1st wave then wont this be the 5th wave

Hi @vivekvan

Thats one of the big drawbacks of elliott theory. Wave counting is very subjective and those with experience in market cycles are probably more adept at defining where one wave starts and one begins. Though i am certainly far from being an expert, i would like to think that Oct 2008 to March 2009 was the bottom formation and in my opinion it certainly adhered to the elliott wave counting rules. Here is the wave count from that period as i see it ( pls note this is all great in hindsight - so serious hindsight bias at work here!)

Now expand the chart from that period to the current period and this is how i would count the waves ( the big bold numbers are the counts )

Obviously a small shift of numbers here & there would easily mean that we are in wave 5 and a correction that is greater than than wave 2 or 4 is in the offing. But i would like to think ( obviously ), that this is the true count.

I would certainly like to see how all this pans out. Wave 3 - good times ahead. Wave 5 - time to be cautious. Which one is it? :slight_smile:

Best
Bheeshma

1 Like