
Go to control panel of your laptop → Region and Language → Additional settings → Currency → Digit Grouping. Change it to formatting you need.
If this does not work, change it in numbers tab too.
2 Likes
Thank you Tushar! It worked.
1 Like
Thanks for updating and sharing the excel for Q1FY18.
Wonder if you have number of shares compiled for NIFTY.
In this way, we could compare your data with other similar reports (ex:
ICICI sec Q1FY18 earning report)
Dear Krishnaraj,
My compliments for a very good study and presentation.
The Nifty 50 may be skewed as heavyweights are not having any increase in earnings.
Are you doing for other indices also? If yes can you please share them.
At least mid cap and small cap earnings may be on the rise?
Any how thanks for the regular updates.
Regards,
No, my purpose was to find Nifty PE from publicly available sources. The exact composition of Nifty and hence what comprises one share of Nifty is not public.
I read the ISec report on Nifty and the EPS they compute is forward earninings, which involves estimates of earnings. I don’t attempt that here.
No I don’t because their weights are not public information.
1 Like
@diffsoft - Thanks for your wonderful work of compiling NIFTY earning quarterly.
You might have already know that NIFTY reconstruction happened on 29th Sept.
A couple of changes happened in the constituents.
In case you missed it, here is the summary
Thank you Lotus for bringing this to my notice. I read through the report
and was curious to know if you have Motilal Oswal report on Nifty EPS
estimates for FY 18 prior to these changes ?
Warm regards,
Dear Krishnaraj
This is other report I could get
http://institution.motilaloswal.com/emailer/Research/STRATEGY-20170921-MOSL-SU-PG12.pdf
Not sure if this is the one you are looking for.
Kindly buzz me privately to understand what you are looking for specifically.
You may use UK English as region in control panel Excel in that case would give you amount comma after every 3 digit.
1 Like
Hi @diffsoft, Can we have the sheet for Q2 results plz? Thanks
Sure, after Eicher, GAIL and Sun Pharma publish their results today
1 Like
Folks,
Attached is the Nifty trailing PE (weighted) for quarter ending September 2017 after results of all firms have been declared. Nifty PE Q2 FY18 for valupickr.xlsx (76.5 KB)
Notes:
-
The Nifty trailing PE as of 14/11/2017 was 22.91 vs 22.83 as on 14/08/2017. Thus valuations have grown just so slightly more than earnings growth. About the same time last year the PE ratio was 19.15 which means valuations grew ~ 17.5% faster than earnings.
-
For the quarter ending September 2017 unweighted PAT grew by 14% over Sept 2016, but weighted PAT grew slower by 12.3%. This was mostly on account of stocks with lower than average weights showing much better performance, that got diminished when weights were added. For instance, Tata Steel turned a profit of Rs 1,000 crores from 60 cr loss year ago, Tata Motors PAT trebled, HPCL & BPCL PAT doubled.
-
For the trailing 12 months ending September 2017, weighted PAT grew 3.70% over trailing 12 months ending June 2017.
Feel free to ask any queries.
Warm regards,
33 Likes
Great work @diffsoft. thanks for all the efforts you are taking in calculating the statistics. This is really helpful especially because published PE is so much higher than the actual number.
Will it be possible for you to calculate Nifty 50 EPS for last few years? I have used your data to calculate Nifty 50 EPS by dividing Nifty 50 index value by PE ratio for last 7 quarters using the sheets you provided. I was wondering if you can calculate Nifty 50 EPS going back until 2012 (if this is not too much efforts)?
thanks again.
1 Like
Thanks Yogesh for your kind words. I do it because I need it for myself and so why not share it.
For calculating Nifty EPS quarterly we need Nifty data quarterly with weights. If someone can fish that out, I can use my data base to get the PE / EPS since 2012.
Warm regards,
1 Like
Hi @Diffsoft,
Thanks for volunteering to dig out the data. Something as simple as an index EPS is so hard to find and calculate. I have downloaded list of Nifty 50 stocks and their weights going back to 2012 from NSE website. Looks like they have started providing that info now. Will you be able to run your program to calculate Nifty 50 EPS upto 2012?
NiftyNext50.xlsx (113.3 KB)
Nifty50.xlsx (116.6 KB)
Let me know if you need the data in any other format.
PS: I have also uploaded Nifty Next 50 data. If it is not too much efforts, can you please calculate that as well? Even if you can do it on an annual basis, that will be helpful. thanks again for all your efforts.
6 Likes
Nifty EPS for the last 7 quarters based on the calculations done by @diffsoft.
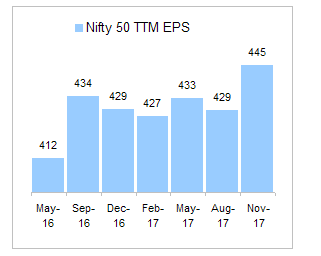
Chart above shows that EPS dropped in 3Q and 4Q of FY17 due to demonetization and then again in Q1 due to GST preparation. Q2 EPS has seen a good growth sequentially (some of that could be due to seasonality as well). Going forward, y-o-y comparisons will be easy as base is low.
Consensus EPS for FY18 although downgraded sharply throughout the year is still way above at 492. This implies almost 10% sequential growth in H2 which looks optimistic.

Source: Fy18 Earnings Estimates May Need To Be Cut Further, Say Brokerages | Mint
Adding FY19 EPS Estimate link

Source:Company Earnings Estimates Continue To Be Cut After September Quarter Results | Mint
5 Likes
Thanks Yogesh because what you have done is the harder part of the work 
I will pull out the data and compute PE n EPS, I think by mid next week.
Cheers,
Dear Yogesh,
PFA EPS since Dec 2012.xlsx (165.1 KB), Nifty EPS and PE since Dec 2012 (which will have trailing 12 months since Mar 12 quarter). The big summary is that earnings have grown by 20% in close to 5 years, whereas valuations have grown faster at 70%.
The summary is as below
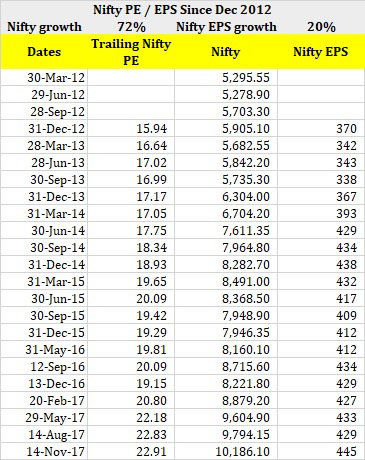
Notes:
-
Sept 2014 Nifty weights weren’t available in the spreadsheet given by you, so I assumed it to be the same as June 2014.
-
Consolidated statements have been used where-ever available in quarterly data, standalone used otherwise. This even if the firm has material business outside the standalone entity and provides consolidated results only annually (like RIL, M&M for example). I take care of it in the quarterly PE computation I share by looking at the non-statutory info they provide quarterly.
-
The detailed working are in the sheets so feel free to come back for any clarifications.
Cheers,
14 Likes
Excellent work @diffsoft. Your data confirms the lack of earnings growth not just over the last 2 years but over the past 5 years. It’s high time for earnings recover now after so many years of flat growth. Earnings recovery has been elusive for last 2 years for some or the other reason but investors have nonetheless pushed the stock prices higher in anticipation of growth.
for last 2 years EPS estimates started out with a big recovery only to be scaled down as one time factors like asset quality review, demonetization, GST etc pushed earnings lower. May be once earnings starts to trickle down, market can finally call it a top.
4 Likes
The elusive earning recovery everyone is talking about is still not to be seen anywhere and we may not see for some time. (except a break out of international conflict and major war)
The reasons go deep into micro / macro / international economics. SA Aiyar has written an excellent article on this topic (which I have been observing for sometime, but failed to articulate it as he has done)
Looking forward to counter arguments to prove me / SA Aiyar arguments flawed.