Hey @Krishna_7,
As I am new to understanding business of MCX, can you explain your source of DATA ?
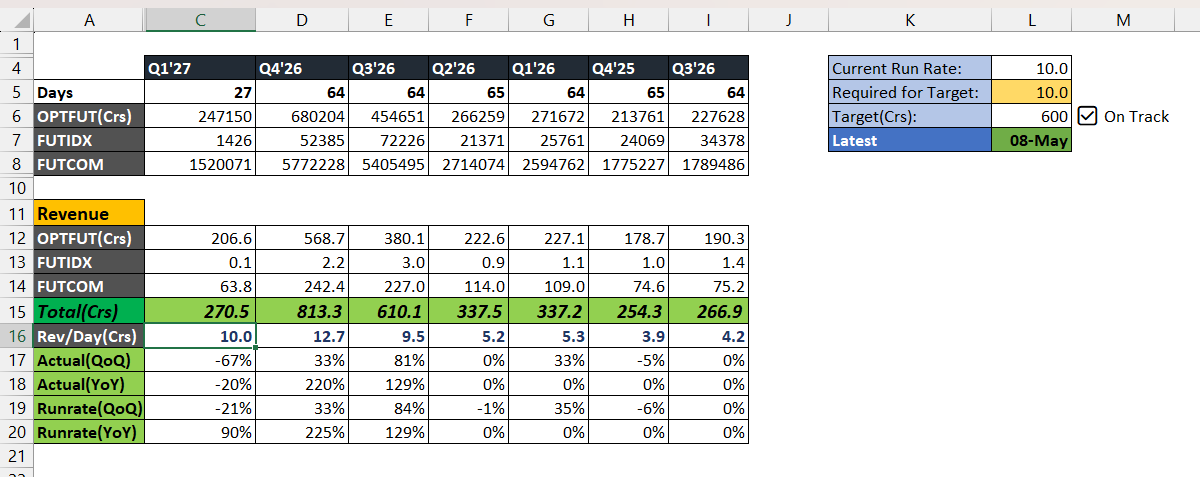
And what does the table above the revenue indicate & what to interpret out of it ?
For e.g it says, total days in Q4’26 is 64 & OPTions FUTURE in Crores is 680204, so what is this 6,80,204 number and why it is different from revenue figure.
TIA.
1 Like
Hey @vivek_lakhani,
I pull this data daily straight from the MCX Turnover Search page(Historical Data), specifically tracking the “Premium Value” for options and “Total Value” for futures.
The top table shows the raw traded volume (like that 6.8 Lakh Cr), which just gives a sense of the platform’s overall activity and velocity. Since MCX only keeps a tiny fraction of that as a transaction fee (like ₹83.60 per lakh for options), the bottom table applies their official fee multipliers to calculate the actual revenue. It basically translates those massive trading volumes into the exact cash hitting MCX’s top line.
Hope this helps..
6 Likes
Mcx daily volume is not same . A lot depends on expiry and volatility.Mcx not only get benefited from rising prices but also with volatility. This quarter was exactly like this.
Coming q would be much better than this. I have been telling q326 could be the base for next 4 to 6 quarter. We are looking at 25 rs eps per quarter in fy27 as base case.
4 Likes
hey @Krishna_7
had a question regarding your revenue component from OPTFUT turnover/volume data.
Your Revenue calculation for OPTFUT across quarters comes to 0.0836% transaction fee of volume.
But MCX mentions the transaction fee of ₹41.80 per lakh of premium turnover value, that comes to around 0.0418%.
May I ask the reason why you have taken more transaction fee for OPTFUT volumes?
For FUTDX & FUT commodity, MCX quotes ₹2.10 per lakh of turnover value, which comes around 0.0021% - which also doesnt aligns to your revenue figure taken at 0.042%.
Can you educate for the same, why your transaction fee rate in calculation is more than what is mentioned by MCX.
TIA
Hey @vivek_lakhani,
Those rates are just for one side, but MCX collects from both the buyer and the seller, so I’ve doubled them to get the total revenue.
1 Like
super result. QoQ 30% and YoY almost 400% profit . 20 rs Q eps which used to be annual eps FY25.
also 8 rs dividend .
3 Likes
There is talk about MCX being included in the global MSCI indices at the next rebalancing in a weeks time
2 Likes
Hey @Krishna_7
Q4FY26: 889cr.
seems your calculation were spot on with Q4 forecasting.
Kudos..
3 Likes
Its just publicly available data, just organized the data nothing much, and inspired from @vikas_singh.
Data as of 8th May. This quarter may be soft quarter nonethless YOY will be excellent but noting like Q4’26. As in previous quarter we have witnessed many global things and price surge in Gold hit all time highs and all the uncertainities. Now with cooling down of macro things and all expecting Q1 revenue to be around 650-700cr with other income. Lets see if this becomes a new normal to MCX.
5 Likes
lets wait for Q to complete.
https://goldprice.org/ is telling different story. I am playing MCX on commodity cycle and the cycle hasn’t peaked yet.
https://www.reuters.com/world/india/four-indian-stocks-added-four-excluded-key-global-index-mscis-may-rejig-2026-05-13/
Added to the MSCI Global index in May rejig. Changes effective May 29th. Expected inflow of $373 million into MCX. This translates to um3 days of average trading volumes.