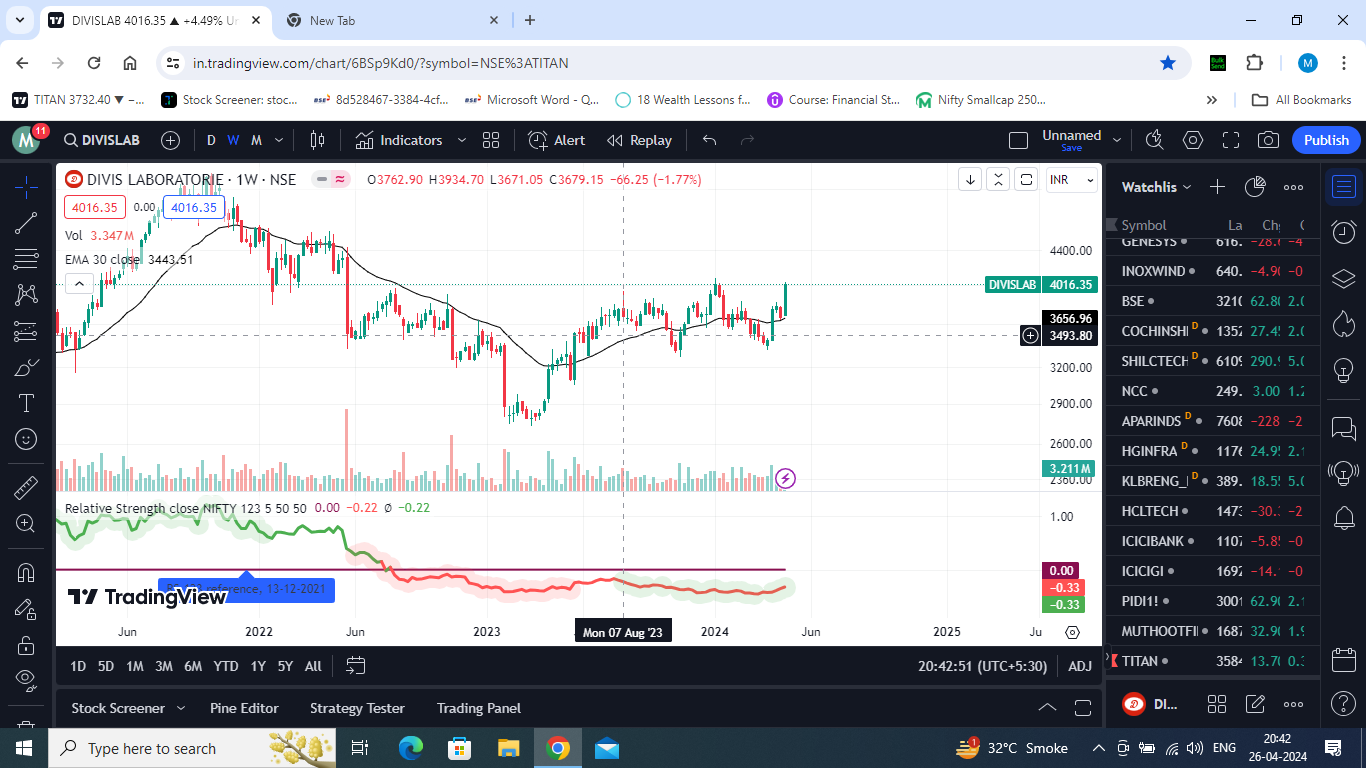
See above chart of Divis Labs…You can see that currently Divis labs is moving up…its in uptrend but May 22, April 22 and before that dec 21…all those Tops are there. These people who bought at those levels are waiting for price to come to their buy levels, once price comes to their levels they will start selling and hence your price will go down…That means these earlier buyers will not allow your stock price to move ahead and they will offer resistances for price advance.
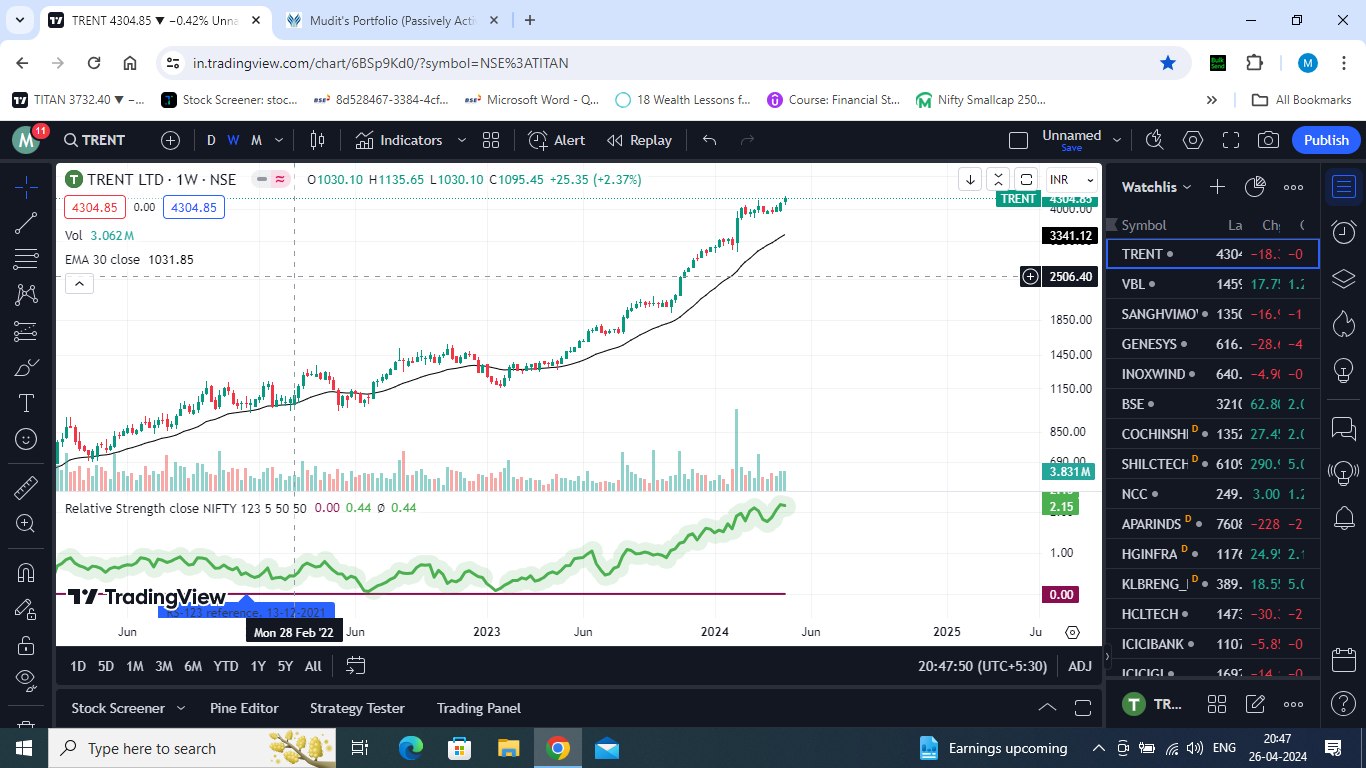
Here the sky is clear…No resistances for price increase…So it can go up easily as no previous sellers are there…
Now most important thing is the older these resistances are, they become more in-effective…so Beyond 1-2 years it doesn’t matter even if there are resistances , because then old resistances don’t influence the price. .Because most investors or traders don’t hold stocks so long for their price to come back,Many ppl mostly sell at loss and get rid of losing stcoks.
About bearish Market , I have not yet thought of…or secretly hoping, it never comes…
But , may be even during bearish market there might be some sectors or stocks who might be outperforming or may be in bullish phase…I really dont know…May be I will be in Cash that time…So Thats a blindspot. Thats the reason I am 70% invested in Mutual Funds and only 30% into this strategy as I am evolving and in learning phase so dont want to make earlier mistake of taking on more that i can chew. So I have employed Fund managers to do the heavy lifting of 70% ( even in that they will be doing 35% and remaining 35% into index so auto-pilot) and I will be doing 30%…But I am open to suggestions about bear market behaviour.
Buying the known names will get you average performance only, direct equity is all about finding things earlier than others. For example, force motors is my core investment, in ine year it has gone up from 1200 to 10000. Large alpha can be created only with underdogs ignored by market. Shifting to mutual funds will not make your portfolio safe rightnow as returns are always mediocre in comparision to direct investing. I never bought a large cap in last 4 years. Momentum trade + mid small cap portfolio with all ignored companies or cheap valuations created a 38X returns on portfolio from Mar 20 lows. Sam dam dund bhed all strategies, only aim is to add value to portfolio even it is 5% positive trade apart from long only portfolio.
ABFRL was dumped by market, made a bulk entry around 230 levels and saw two upper ckt in one month.
I dont believe in mutual funds as my ego doesn’t allow me to do that.
Now a days stock is valued with coming 5-20 year earnings hence putting money in discovered stories for long term will be a worst capital allocation as time correction risks are very high. Long term investements are done in bear market, you get very less real opportunities in a roaring bull markets. Capital protection is the key or need to do some momentum trading with discipline.
@Mudit.Kushalvardhan i have been following you since beginning and I was surprised by transformation.should you think of changing thread tagline (passively active? As you mentioned ultimately it’s the price difference of trades that matters to make money .And I am also eager to read book on stage analysis and to be prepared atleast for next bull market.
All I want to tell is please check the effect of recency bias and availability bias, authority bias …good luck…keep updating us.
Does it remain manual and subjective, checking 1 name at a time? At what frequency do you recheck the same name? Also, how do you weigh valuation in the overall decision making?
List of stocks from trendlyne by relative strength is system driven…But once list is made, after that manually we have to apply stage analysis.
Earlier my buying and selling rules were arbitrary and I used to enter just by looking at Stage 2…But during bull market you will find , may be 200-300 stocks out of nifty 500 in stage 2 and obviously , you cant invest in 200 stocks, So we have to screen them to bring that number down to 15-20 maximum. For that what I have started doing is , since I have decided to sell the stocks whenever it breaches 30 week EMA, that same logic I will apply while entering…in the sense, I will try to enter as near possible as 30 week EMA. If you recall, in stage investing,one rule was, entry should not be late. So if current price is lets say at 25% above its 30 week EMA and suppose I enter at current price, then I will be selling that only when it breaches 30 week EMA, means 25% below my purchase price…That would destroy my capital by 25%…Hence better to invest when current price is closer to 30 week EMA, may be within 5-10% . so maximum loss I would be incurring is 10% when 30 week EMA gets breached. But also there are some exceptions. Some good stocks always maintain 20-25% Gap with its 30 week EMA even during short term consolidation…In that case you can keep the entry flexible…
Frequency of checking portfolio stocks can be weekly as anyways I will be using weekly chart and my exit criteria is weekly EMA, so no need to check chart everyday.
Once you have selected your 15-20 stocks, then you should stop watching relative strength for investing purpose, but just for curiosity purpose. Because relative strength will be throwing different stocks each day but we dont have to be interested in it. Our 15 stocks , if they are continuing in stage 2 and not going down, there is no need to find stocks each day…
As I said, in bull market, more than 200-300 stocks will be in stage 2…To reduce this number , many other criteria can be applied. Like you can include stocks only from growing sectors. There might be some stocks from down sectors which have come on your radar, you can ignore them. Then you can apply some fundamnetal filters also…like earnings growth, sales growth, debt, Promoter holding etc…But all this after you are sure of Stage 2 and chart is good.
See, in this strategy , you are supposed to be nimble…so even if you enter in high valuations stocks, still this is not buy and forget strategy…so.if that stock start going down your 30 week EMA, you will promptly sell it, so major losses will never be there even if you enter into high valuation stocks. And our quantity is low, so no problem of selling such low quantity, even if selling pressure is there.
Can you list out what criteria RSI is driven by. So, what would the Trendlyne algo use to filter based on RSI. And then why EMA vs SMA or WMA or some other factor.
Hi…You got it wrong. No RSI…RElative strength is different and RSI indicator is different. Relative strength ( RS) measures the relative outperformance of a stock price compared to Nifty index or its sectoral index. While RSI measures the strength of stock price compared to itself over a period like 50 days or 60 days. On trnedlyne, its a simple relative strength is used where you can select a universe of Nifty 500 and outperformance over a week or month is screened.
Exponential EMA is used to consider the prominence of recent price data compared to simple average. EMA also takes care of trailing stop loss concept. You dont have to apply trailing stop loss seperately and it keeps the things very simple. Why 30 weekly EMA , is because, it allows us to ride the upmove to maximum extent. If you apply 9 EMA or 15 EMA, you will get sell signal frequently and it would turn into trading instead of investing. For good stocks, 30 week EMA is very rarely broken, sometimes 2-3 times in a decade…You can remain a long term investor even after following stage analysis which seemingly appear as technical trading based strategy.
I would suggest to read Stan weinstein instead of William O’neil as Stan keeps things super simple and still so much effective. William introduces so many patterns in charts that a new bee like me try to fit those chart patterns where none exist.
You can start with equal weighted 15 or 20 stocks. And when it falls below 30 week EMA, then sell it. During the journey, remain agnostic about position sizing.
Nice to see that you started including technicals as well. I first got to know about stage analysis through Ishmohit of SOIC. A very simple and good way to keep a check on our stocks.
Please share your MF folio and stock portfolio if you are comfortable.