Stellar results!! What were the drivers of this growth? A trailing 12 month EPS of 74 at a PE of 15 gives a target of 1100. Can someone confirm that it has broken out of a flag pattern?
Low cost inventory due to rupee appreciation in H2 FY’14, helped the company together with better realization, lead to significant growth in Q1 FY’15 and in FY’14 as well. The seed business and high end Glyphosate business continue to do well and management expects the trend to continue.
On a long term basis, the volumes should continue to grow for both the products. Pricing would be a factor of competition and rainfall in India, though with increase in soil fertility and irrigation, pricing will slowly improve.
Management expects Rabi crop to be strong this year and thus sales growth should be strong.Overall, Outlook for both seed business and corn business is positive
Revenues has increased from 93 crores in q4 fy 16 to 145 crores in q4 fy 17.
Net profit has increased from 24 crores in q4 fy 17 to 30 crores in q4 fy 17.
For full year, total revenues has increased from 555 crores in fy 16 to 654 crores in fy 17.
Net profit has increased from 101 crores in fy 16 to 147 crores in fy 17.
EPS has increased from 58 in fy 16 to 85 in fy 17.
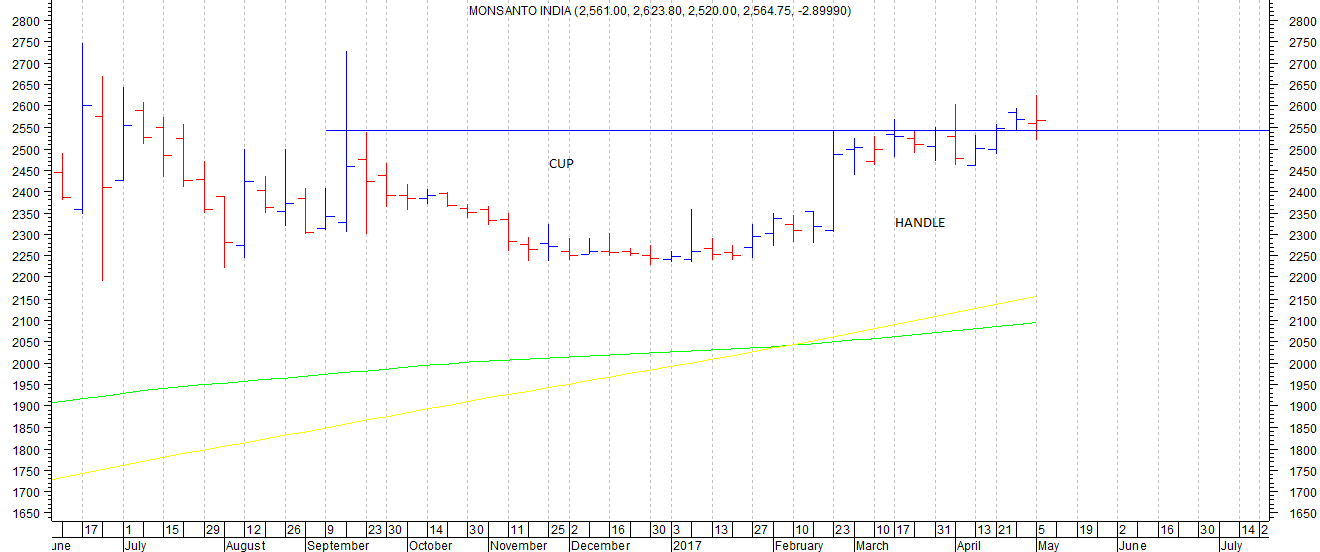
The technical pattern is interesting and which drew me to this company after a long time. as attached chart shows the stock has formed a cup and handle pattern on weekly charts.
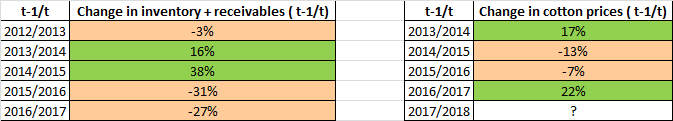
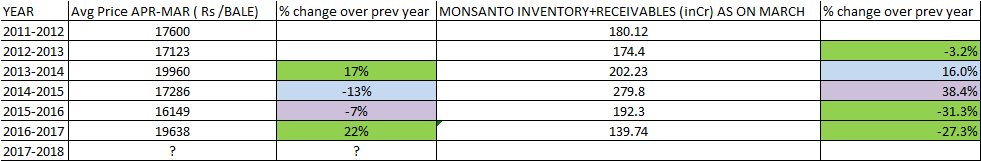
Whenever Monsanto inventory+receivables are down the prices of cotton in the subsequent year jump up and vica versa ( i.e whenever inventory+receivables levels are up subsequent prices are down)
Changes in the monsanto inv+rec seem to be correlated with subsequent cotton price movements.
For e.g inv+recv went down by 3% in 2013 & the 2014 avg cotton prices jumped up by 17%. In 2014 I+R increased by 16% and 2015 cotton prices had a bad year and fell by 13%. Similar correlations in other yrs as well.
This is a very useful inference. It may be just a coincidence. But I think this looks like a real possible theory. This would mean Higher cotton prices are a possibility.
I would appreciate if any one can share good link/sector study to understand which companies will benefit increased cotton production and will likely to increase topline and bootomline as a result of this.