@Mudit.Kushalvardhan It depends on the pf size that you form with Nifty 750 universe.
If you choose the top decile, of 75 stocks, it is quite possible it will contain stocks of all the pf that I hold separately.
For example: On a 6 month look back period, I give below the momentum ratio (returns / SD of daily returns) of different universe.
Microcap 250: TIDEWATER - 50.05
Midcap 150: UNOMINDA - 44.02
Nifty 50: NTPC - 20.58
If one had just 40 or 50 stocks in the pf, you may not find any stocks from Nifty 50 or Next 50.
The 75th rank (BAJAJCON) in Microcap 250 has a momentum ratio of 24.51. This is more than NTPC and hence there is no chance for NTPC to find a place in the pf even when we decide to have 75 stocks.
1 Like
I just checked. If I select 30 stocks, from universe of 750 stocks, i get one third from large cap, one third from midcap and one third from small cap. Its evenly distributed. Nothing from microcap is coming, may be because my trading volume criteria.
@Mudit.Kushalvardhan It is quite possible due to the system you have chosen. I was referring to the stock selection based on the Sheet that I follow.
If you are not getting any stocks from Microcap, clearing you are missing out on returns big time. For me, amongst all pfs, microcaps have given me the highest returns.
As I pointed out, even the 75th rank is better than the 20th rank of Nifty 50.
In a momentum pf, more conditions you lay down, lower will be the returns (and possibly lower drawdowns).
2 Likes
this is the first time I used python @visuarchie
This is the video I used to setup python. Please try doing what is told here. Tell me how it goes
It is done on microsoft excel, if you want to do in Gsheets, you’ll have to copy paste the data. shouldn’t be a problem
3 Likes
@Mudit.Kushalvardhan I will try this. Is possible to share input file “ind_nifty200list.csv”
@Mohana_kri I will try this. Is it possible to share input file “ind_nifty200list.csv
@Mohana_kri
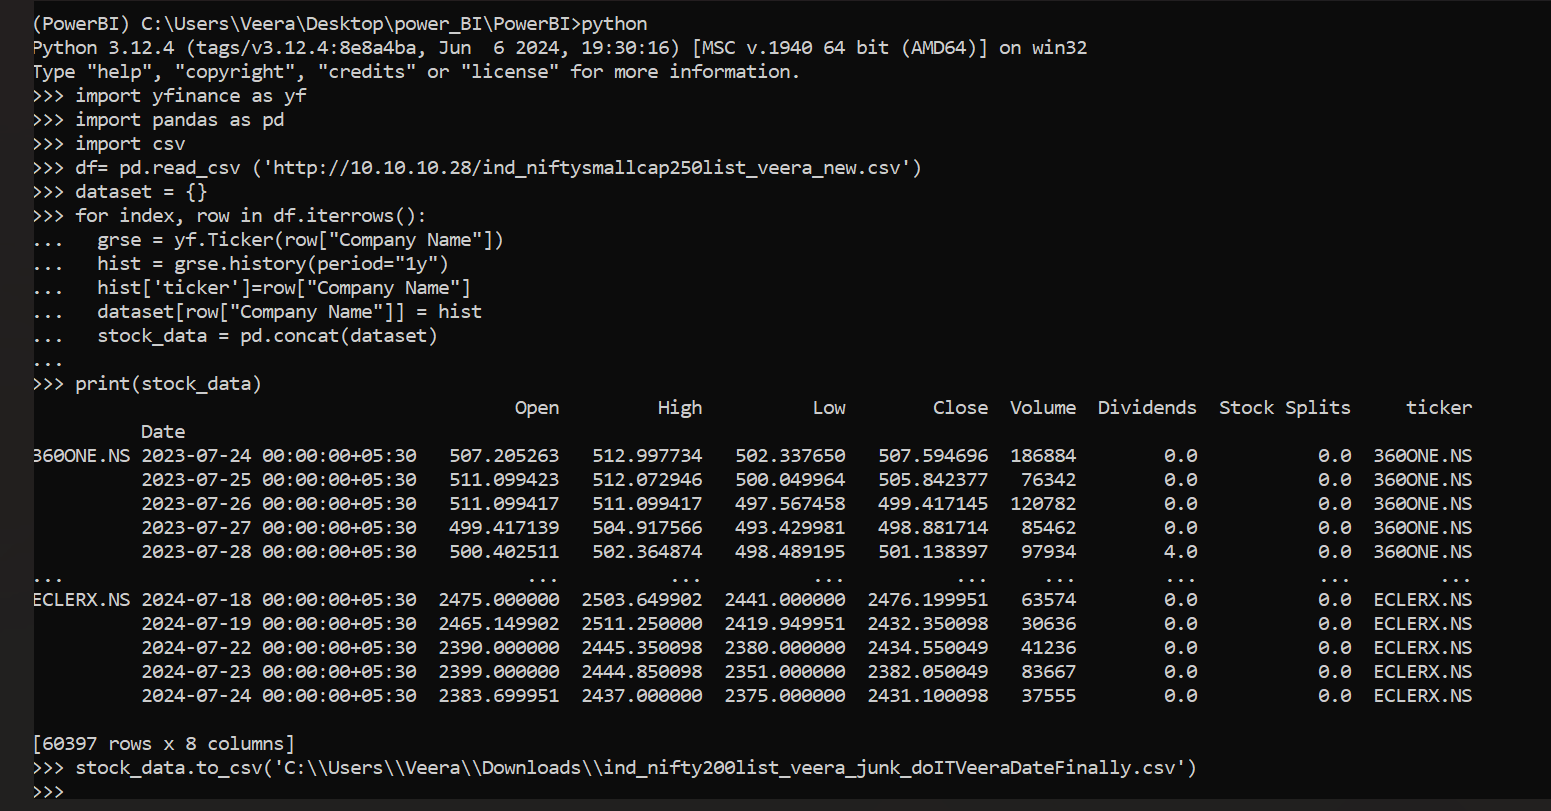
Followed videos and made setup.
Tried below code with attached CSV file , but blocking at Line 10. Can you please help me
Its showing like this & never coming out
C:\Users\Veera\Downloads\ind_niftysmallcap250list_veera.csv
1 import yfinance as yf
2 import pandas as pd
3 import csv
4
5 df= pd.read_csv (‘http://10.10.10.28/ind_niftysmallcap250list_veera.csv’)
6 dataset = {}
7
8 for index, row in df.iterrows():
9 grse = yf.Ticker(row[“Company Name”])
10 hist = grse.history(period=“1y”)
11 hist[‘ticker’]=row[“Company Name”]
12 dataset[row[“Company Name”]] = hist
13 stock_data = pd.concat(dataset)
14 print(stock_data)
if i execute only from line 1 to 9 , its working till that level
#####################################################
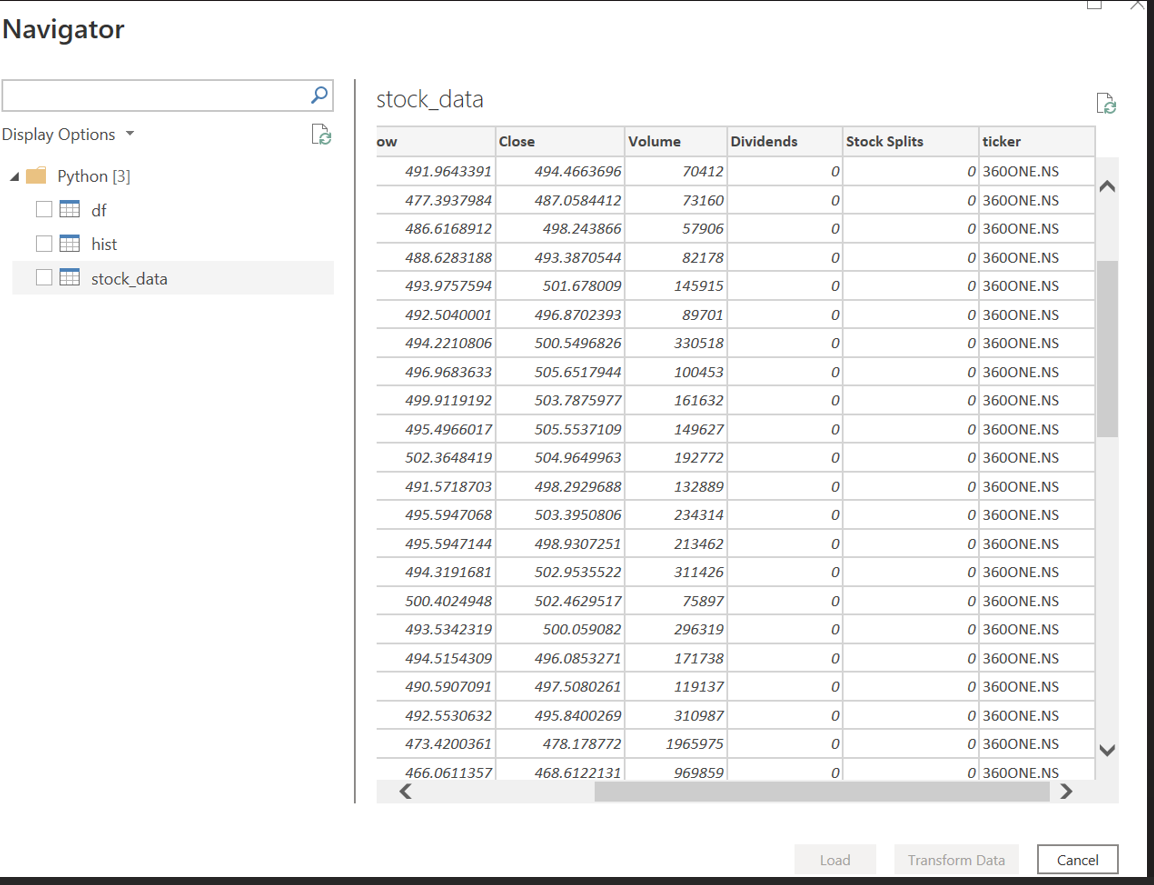
Able to Solve issue
Finally able to solve the issue and get data/prices shares for 1 years
Hello @9916673623 , Hope you’re able to get the data now
Finally able to solve the issue and get data/prices shares for 1 years
@Mohana_kri Yes Sir i got raw data . Thanks a lot showing path how to solve raw data issues.
One doubt are you processing the raw data from python code or processing from xlsx sheet. if you are processing usinng python code can share your thoughts. Thanks 
@Mohana_kri Yes Sir i got raw data . Thanks a lot showing path how to solve raw data issues.
One doubt are you processing the raw data from python code or processing from xlsx sheet. if you are processing usinng python code can share your thoughts. Thanks
Bhavcopy CSV version is discontinued now, so what is the alternate way please?
@9916673623 ,Glad that you could get the raw data. Currently I’m working on excel with raw data. Once I have the python code for processing data and getting the ranking, I’ll share it here.
Few thoughts on this way of trading,
- Please be prepared for drawdowns, sometimes greater than 10%
- If you’re not comfortable with drawdowns, then STP & deploy money with 8 or 16 weeks
- Works great in uptrend, beats index in sideways. Not so great in downtrends
@visuarchie , request you to opine on these points
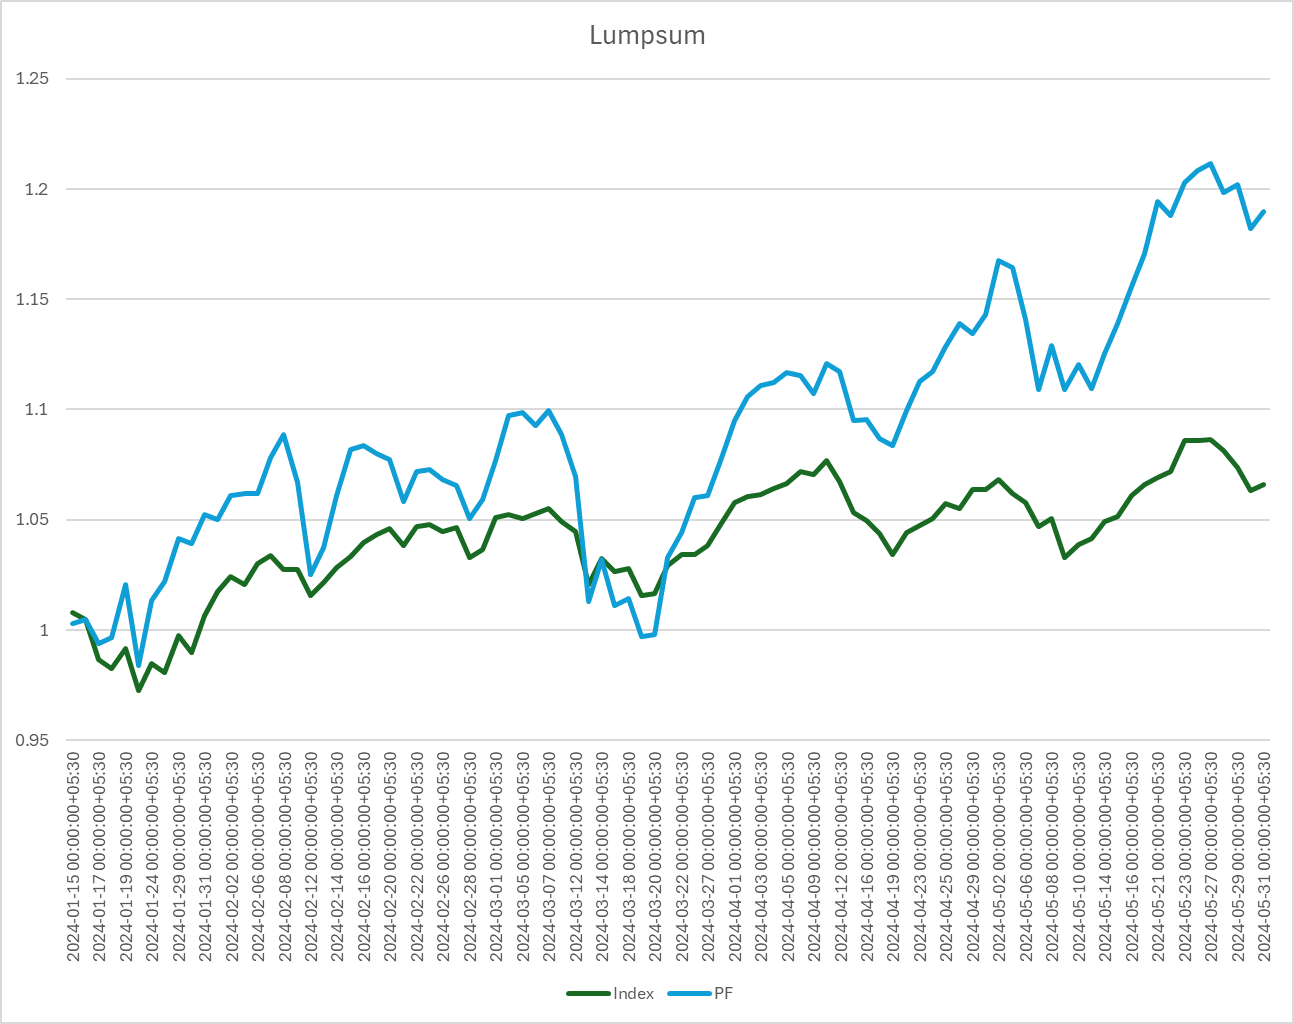
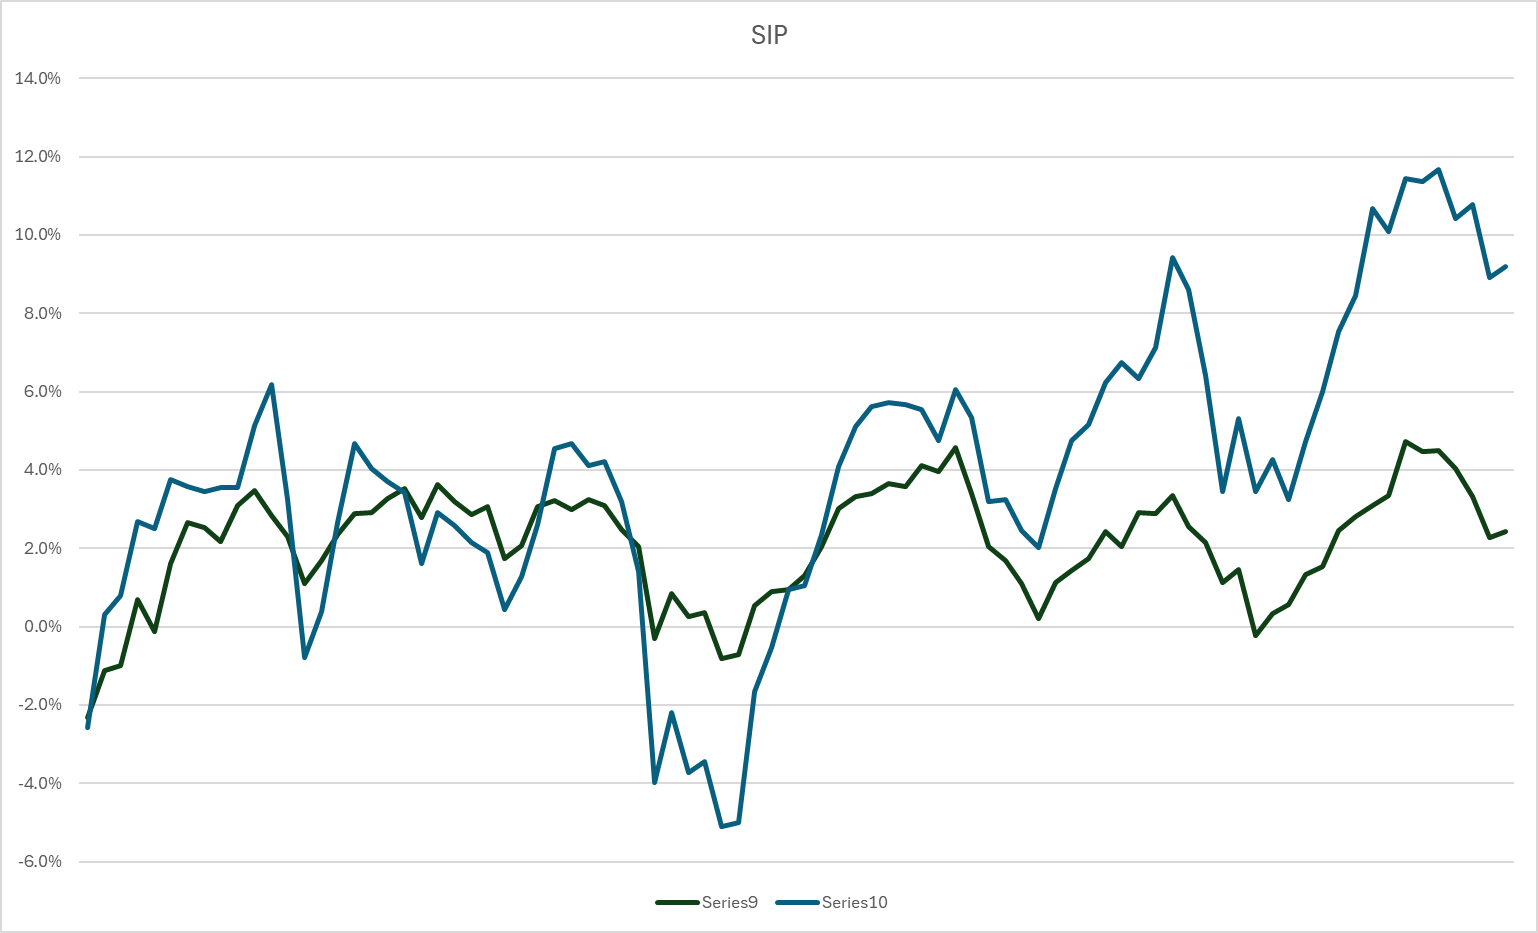
Backtested Results for this strategy on CNX200
Series 10 is PF, 9 is CNX200
@visuarchie Can Anyone please share the latest “Microcap 250 momentum ratio” sheet here
One of the techniques that is used is when index 50 DMA goes below 200 DMA you have to start converting your position to cash. Momentum strategy works only with trend.
True, but in present market, before 50DMA goes below 200DMA, your PF will be down by 15-20%. Hence risk management is crucial. This is one reason I prefer part entries, instead of going in all at once
1 Like
Hello sir, Can you explain how can we plan SIP method in this strategy. Thank you
@Mohana_kri , hi , I didnot understand the 2nd point
STP and deploy money 8 or 16 weeks … kindly elaborate
Can we follow 50 EMA crosses 200SMA (downside) we can come to cash.
or
50 EMA crosses 200 EMA (Downside)
@Mohana_kri Thanks for Sharing you thoughts.
Regarding python code i am also trying from my side to process the raw data.
deploying same amount to each stock each week.
for eg, you have 2L to invest for this week, it’ll be 2L/20stocks = 10k in each stock irrespective of their current weight.
@visuarchie , suggests that you invest money in each stock so that their weights become equal.