
My notes on Maithan alloys:
This is an extension of presentation done last month in Bangalore group (deck available in VP Bangalore thread)
So far, this has been an area which I have totally avoided due to lack of incompetence, not spending enough time in market to see multiple cycles, personal psyche. However, then, you get times when you have to take your chances and so have I.
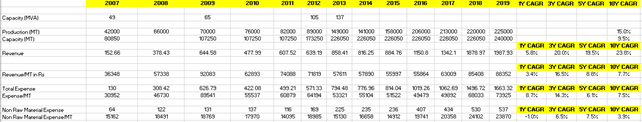
The script I am discussing belongs to one of the heavy cyclical sectors but when I tried to analyze the numbers across its bull and bear cycle, it confused me more. Below are some of the numbers captured
The script is Maithan Alloys which is into ferro alloys and chrome alloys related to steel sector which is one of the most cyclic sectors. One of biggest dilemma, curiosity and learning while studying this stock for me has been the small nuisances between market perception to quality, value, commodity, outliers, cycles and valuation.
We are often told that – “ Look for companies with more than 7-10 years of respectable return on capital, low leverage, strong balance sheet and high cash flow, reasonable growth, high promoter stake etc.”. Let us call it statement one.
At the same time, we are also told that – “Stay away from cyclicals”. Let us call it statement two.
So, what happens when get stocks who have more than 7-10 years of respectable return on capital, low leverage, strong balance sheet and high cash flow, reasonable growth, high promoter stake etc. but they belong to heavy cyclical sector? Should we go with the first statement and ignore the second or vice versa or there is a mid-way or there is a different way to handle? Also, the way companies belonging to first statement are valued are very different from companies belonging to second statement in terms of valuation techniques. So, how should we value companies which fits in both buckets? Maithan Alloys is a classic case to discuss this outlier behavior and in next few paragraphs, we would try to answer some of those questions. Needless to say, being first stock, I analyzed in cyclic sector, there has been immense learning and would try my best to share that through this article. I am still not sure why I ended up picking this company out of multiple cyclic sector companies. One reason which comes to my mind is penchant for companies belonging to statement one but urge to expand knowledge base and attempting companies belonging to statement two. Also, I must thank some of my colleagues from raised by curiosity on this script through regular discussions and also helped on some of the queries I had while researching the company.
So, first and most important question – What does company do?
Maithan alloys is One of major producers of ferro alloys with 10% domestic market share and 2% international market share. Below is little bit of details about the business, product and its usage:
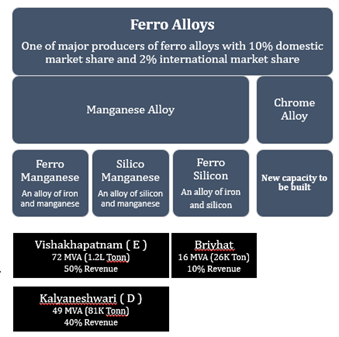
Ferro alloys enhance steel strength, durability, anti-corrosion and anti-stain properties and acts as de-oxidant for Steel Manufacturing
Ferro Manganese - An alloy of iron and manganese: Used in steel products wherein silicon content needs to be controlled at low levels, Used in flat steel, manganese-rich steel and stainless-steel manufacturing
Silicon Manganese- An alloy of silicon and manganese: Cost-effective blend of silicon and manganese, Consumed in all steel products. Used in higher quantities in 200 series stainless steel, alloy steel and manganese steel
Ferro Silicon - An alloy of iron and silicon: Silicon acts as a steel oxidant, used primarily in special steels and in small quantities in mild steel, Revenue is evenly spread between domestic and export with major export to Asia pacific except China
Some of customer brands where company’s products are sold are
Some key points about company and industry business dynamics:
• Specialize in Ferro Alloys and attained a certain mastery over manganese alloys. This basket comprises of both products Ferro Manganese and Silico Manganese. In addition to the same, also produces small quantities of Ferro Silicon. Currently not doing Ferro chrome. Planned to do Ferrochrome in the future
• Break up by product type: It is almost of equal quantities but detailed exact break-up we would not be able to give. Out of the 2,25,000 ton, roughly about 13,000 ton and balance would be Manganese Alloys either 40: 60 to 60: 40 between Ferro manganese and Silico manganese.
• For Ferro Manganese and Silico manganese put together, our belief is in an average cost scenario which let us say it somewhere close to today’s market scenario, Out of the total variable cost about 50% would be Manganese ore cost, 30% of the cost would be power cost, 15% of the cost would be Coke and Coal cost and 5% would be others. So, this is the breakup of the material cost for our product apart from other fixed costs
• A broad range of power cost is Rs.4.5-5.0 per unit.
• The most important raw material is Manganese ore. Import Manganese ore from Africa and Australia apart from minor local procurement
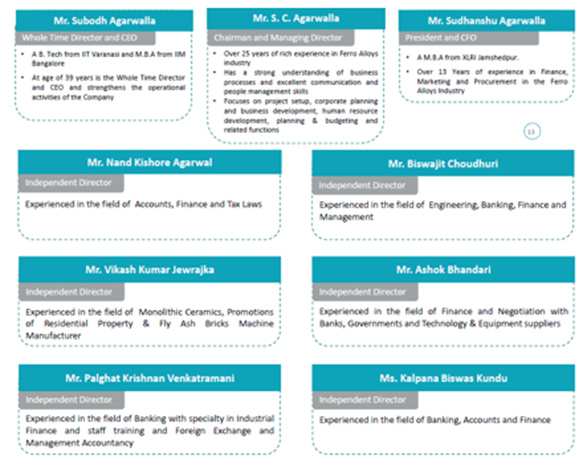
Next question – Who runs the company, who are the promoters and who are board of directors?
The company is led by Mr. S C Agarwalla and his two sons – Mr. Subodh Agarwalla and Mr. Sudhanshu Agarwalla. Both sons seem to have decent education background from prestigious universities and have been totally involved in business with Mr. S C Agarwalla. So, overall management is a mix of old and new generation family with fair educational background
The company belongs to one of business groups from Asansol Kolkata area, named. BMA group, which has been in news for all the bad reasons and we will discuss more about it in a more relevant section in detail
All 3 of them are on company board and apart from them, company has 6 independent directors on board. The list is below
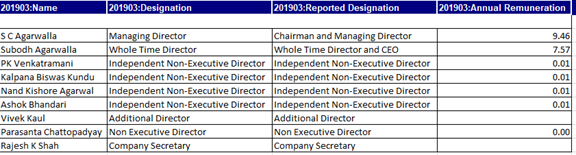
A look at management compensation highlights that salary is on the higher side, however, management has done reasonably well on business performance and at the same time:
• Salary is variable and linked to performance.
• Further, management has not shied away from taking lesser pay
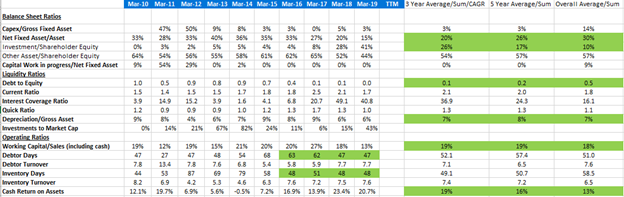
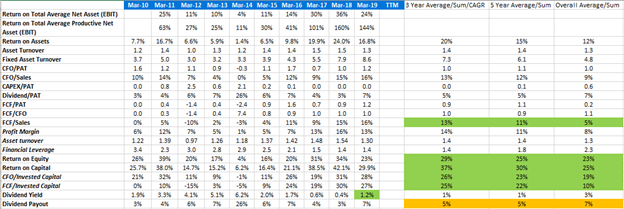
How has business done over period of time, how does balance sheet, P&L and cash flow looks like?
A glance overall last 10 years of financial performance throws some key insights over how company and management has done:
• Respectable growth rates
• Clean and consistent receivables and inventory performance
• Lower tax rates (one of plant in SEZ zone, we will discuss more about it in risk and concern section)
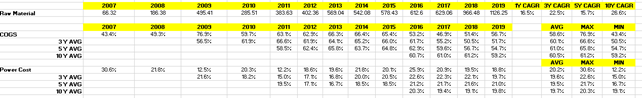
• Volatile raw material and power cost. What is normalized raw material and power cost?
• Asset light balance sheet (do not own mines) with net fixed asset being 30% of overall balance sheet and rest in the form of primarily cash or liquid investment
• Improvement in debtor days. Reasonable and consistent inventory days
• Respectable cash return on assets
• Depreciation rate looks satisfactory
• Excellent free cash flow to sales ratio over 10-year history covering both up and down cycle
• Respectable return on capital ratios over 10-year history covering both up and down cycle
• Still, dividend payout is low. This is despite having Rs 670 crore cash with Rs 1300 crore market cap
• Not uniform and shows volatility and cyclic behavior, however, still from a cyclic commodity business perspective, company could generate reasonable ROCE in worst of time. Question is what is sustainable ROCE and operating margins? Why margins were so low in 2014?
• Company has been able to reduce leverage and is debt free now. Will it need debt for future expansion?
• Operationally efficient and good asset utilization ratio though not yet at peak asset turns despite 90% capacity utilization
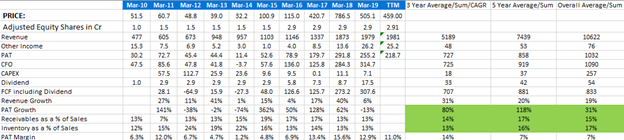
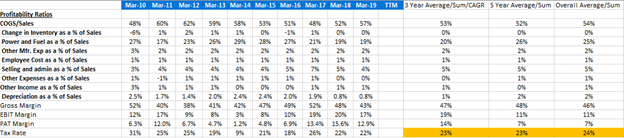
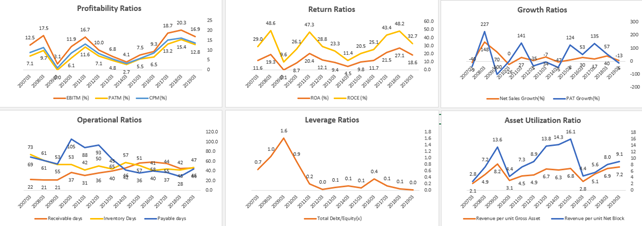
So, overall, company seems to be doing well with its share of spikes and fall in margin in good and bad cycle and its share of concerns which we would discuss in detail in risk section
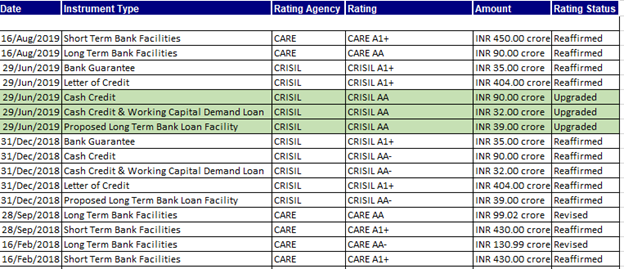
How does credit rating agencies have rated company in last few years?
We can see that company had respectable credit rating (though we should not reply much into it, still, CRISIL being one pf credit rating agencies and so far, relatively cleaner reputation provides some comfort). Also, company has improved its credit rating over years
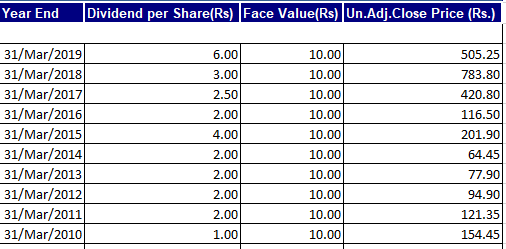
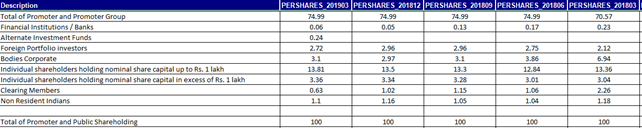
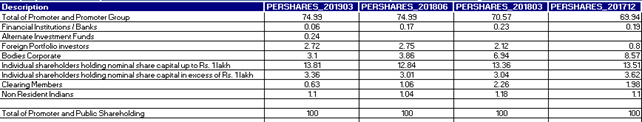
Dividend and shareholding analysis
Following are the key highlights from dividend and shareholder analysis:
• Company has been paying continuous dividends
• Bonus issued in 2010 and 2015
• 74.99% held by promoter with some share change happening in 2018
• 3% by FII and AIFs
• 14% by individual with nominal share capital up to 1 Lakh
• No mutual fund holding
![]()
Open Questions, Risks and Concerns:
So far, there have been few open questions, risks and concerns around tax rate, sustainable margin, raw material and power cost, promoter reputation, high cash on books and related usage etc. Also, investment is all about future and though history has been good, we need to address future and growth and related concerns. Let us note down all these concerns below and try to deep dive into each of them in further detail:
High cash and low dividend yield
Power tariff in the country is high compared to other ferro alloy producing countries
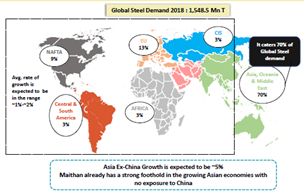
Industry is bracing to tackle competition from Malaysia and Indonesia
Another challenge facing producers in India is the non-availability of low phosphate coke.
Family reputation with recent frauds and family transactions in 2017 to shift business from one hand to other hand
Volatility in margins and expected sustainable margin
Significantly low margin in 2014, is company purely cyclic and will it also make losses sometime
How company manages raw material price volatility
Growth concerns, capex plan and how new capex will play out
Any other concerns which have not been highlighted above or in this list
Con call transcript provides response on some of these concerns and it is up to investors to interpret what they want to interpret out of it:
On High cash and low dividend yield: “We are earning about 7% post tax return on our surplus cash. The company is supposed to use cash judiciously for its own growth. Now we have seen three years of good growth in margins and cash flows which is why we have that kind of money. So, we became net cash 2.5 years. ago and in these 2.5 years we have been able to build a war chest of around Rs. 650 crores or so. Now we have been constantly looking at growth and looking for only the last 2.5 years because prior to that the entire industry was in doldrums and we could not think of growth. So, 2.5 years ago is when we started looking at growth and we have a very long-term view on the business and therefore follow very conservative and prudent financial policy as our sector has seen ups and downs throughout.
In the past let us say to support our history of 20 years we have always been taking loans for one expansion project. We have been repaying that and in many cases prepaying the loan and only after the old loan is on the verge of getting totally prepaid is when the next project is planned, and the next term loan is taken. With this strategy we were able to grow from 10 MVA in 1997 to 137 MVA by the end of 2012 - that is in 15 years we were able to grow by 14 times. So, this has proved to be successful recipe and in spite of it being a low risk thing growth has been high. So, we would tend to continue with the success recipe, and we are constantly evaluating inorganic growth opportunities along with the announcement of a Greenfield CAPEX of about Rs. 275 crores. We need to conserve cash for the short-term because we are uncertain how much money we will be spending on the inorganic growth front. We totally appreciate that keeping this cash has a negative carry and we have been debt averse, but we would still want to carry this money for another 12 months because we would hate to lose out on opportunities which come our way. And because we have been able to do a good job of expanding and operating, so we have a request to our various stakeholders to just be patient and give us another 9 to 12 months and we are hoping to put that cash to use. If we are unable to put the cash to good use, then we would consider to return the money to the shareholders. But growth is our priority and if we can achieve better returns with the money, we would prefer that only.”
On power cost being contributor in our being a low-cost manufacturer: “I don’t think so anybody who sets up the unit at any place where the power cost is higher, they would be forced to shut down. So, I would say it is a necessary evil or a necessary hygiene but that does not give you a competitive advantage but if not attended correctly it would result in competitive disadvantage”
On business cycles and sustainable margin: “ On the EBITDA metrics in the 13 quarters from September 2012 EBITDA margin was around 5% on an average. So now what has changed now is that our EBITDA margin would be in the 15% to 17% range as opposed to the 5% in those three years? So basically, what was happening in FY12 or by the end of FY12 is that we had commissioned the Visakhapatnam plant which at that time was in our 100% subsidiary. That subsidiary got merged into the parent company from the start of FY16. So, till the end of FY15 it was a subsidiary. Now that plant in the first three years that is in FY13, 14 and 15 was not operating well. We were wanting to operate it in a hands-off approach thinking that things would automatically happen but that was not to be. When the plant did not perform even in the third year let us say about July 2015, I was given the mandate of taking over control of the plant and do whatever is required to ensure that that plant would perform at a level at which Kalyaneshwari plant was operating. Now if you want to separate the performance and really understand what I’m saying you can take the standalone performance of the company and to get a sense of the Vizag plant working, you deduct the standalone from the consol. So consol minus standalone is the subsidiary. So, from that perspective you can see what was the EBITDA which was coming from the subsidiary and what was the EBITDA which was coming from the parent which was the Kalyaneshwari and Meghalaya plant. The performance of the subsidiary was not so good in spite of the fact that it was not having to spend any money for its working capital needs. So, the parent company was buying raw material and selling it at cost and buying the finished product from the subsidiary and selling it outside at cost as well. This was essential because the raw material and finished goods tie-up was there with the parent company because overseas suppliers were comfortable with Maithan Alloys and not with this new subsidiary which had come up. Because of the poor performance of the subsidiary, it really dragged the performance of the parent company. So, if you’re referring to EBITDA, the EBITDA which reflects on the standalone is the right figure. However, in the revenues you have a lot of trading revenues also figuring in which is the purchase and sales to and from the subsidiary which resulted in a zero margin. In the cost metrics you have a figure called purchases for sales. So, if you deduct the purchases for sales from the revenue of the standalone portion you would get an idea of the real manufacturing revenue of the standalone portion which is the Kalyaneshwari and Meghalaya units and you would have an EBITDA figure against that. So, this is a little bit complicated but if you want to have a better understanding you can go deep into it and you will understand that the Vizag unit was not doing well, the other units were still doing reasonably well. When we made a shift from private sector into the public sector in domestic market in that one year also, we had a hit on EBITDA because we had to grab market share and push people out. This was something which we had done consciously because we could see that steel was entering into a bad phase and we wanted to ensure that we would have no bad debts and we would not be losing money.
I had done some figures. We have a 4% headroom over competition on the EBITDA front, so
when the industry or our competition is making 8% EBITDA beyond that figure, they enter
into a cash loss type of scenario. So, I would assume that the industry can go to that EBITDA
margin which means at that particular juncture our margins would be 12%.”
Raw material and price volatility: “ We are negotiating prices all the time. We would always want to maintain typically an order book of about 3 months’ time. So, we can’t wait till the end of the 3 months. If all the orders expired let us say in the month of March, then sitting on the 1st of April we will be having a
zero-order book; that is something we would hate. We have 3 different types of the contracts. One is a Spot contract. That is something that we are not very keen on and which would be let us say one-time contract for maybe 500 tonnes or 300 tonnes. Anything that is less than 200 tonnes is something that does not interest us. Second is the contract for 3-4 months which is at a fixed price and it gives a certain amount of
visibility to us. For any contract which is 6 to 12 months, these contracts are fewer in numbers, but these contracts are not fixed price in nature. They are linked to the index. There are publications which are publishing prices of Manganese ore and Manganese alloy every week. The published price of Manganese alloy at time of making the shipment would be applicable plus or minus any discount or a premium, decided at the time of the contract. It means if the prices of alloy move up by $ 10 (from contract date to shipment date), then we also charge $ 10 higher (compared to price prevailing on contract date) However this is applicable only for monthly contracts which are of the periods of 6 months or more. For contracts which are up to 3-4 months we have fixed price contracts. If the contracts are 6 months or more, only then we have a price linked contract.”
Competition and threat: “Malaysia being a bigger threat in terms of the import scenario - I would say during second part of calendar year ‘16 and the calendar year ‘17, Malaysia ramped up their capacity significantly. Because of that there was pressure on prices and the prices remained in check otherwise they would have gone up much faster. It means for the last 15 months Malaysia has been producing to capacity so whatever disturbance they were to create that they have already created. There is no additional threat left They don’t intend to add more capacities there because the cost of CAPEX in Malaysia has been proved to be about 2.5 times that of India. Nobody is interested in putting up more capacities there; they will continue to produce what they are producing, and they will not be part of any growth or degrowth”
Usage of manufacturing locations and taxes: “ India is the largest exporter of Silico manganese and hence export earnings and domestic earnings are typically almost at par. For us, we have Vizag plant where it is in SEZ, so we have to export. Most of the plants which are not in the SEZ they have the flexibility. So, if any plant is able to generate a higher EBITDA by exporting, they would export and if they are generating higher EBITDA for domestic sales, they will do that. So, it is a self-alignment which automatically happens and say maybe half a percent difference sometimes but, on an average, it evens out.”
New capex and growth opportunities: “ In our new plant that would be coming up, you would be essentially doing Ferro manganese and also Ferro chrome? Subodh Agarwalla: Yes, we would be doing Manganese Alloys and/or Chrome Alloys; we don’t know right now. It depends on the market scenario prevailing once the plant is ready.”
Analysis of risks and concerns
Now, let us put our own perspective on analysis of risks, open concern items, growth possibilities and future quality of business:
Sustainable margins:
A look into historical margin performance provides a reasonable guestimates of business cycle, peak, trough and sustainable average margin
![]()
Competitive advantage and sustainability:
It is noteworthy that company has such good numbers in a highly cyclic industry. So, question is how company is achieving such numbers and why peers are not able to achieve or do peers hide good numbers for internal reasons. Below is a relative comparison with some of similar players:
Here is capacity of most prominent players and some of them are listed:
| Company | State | Location | Type | Capacity Ton |
|---|---|---|---|---|
| Facor | AP | Garividi | FM-SM | 72500 |
| Anjaneya Alloys | AP | Vishakhapatnam | Ferro Alloys | 120000 |
| Sarda Energy | MP | Raipur | FM-SM | 66000 |
| Sal Steel | GJ | Gandhidham | 61890 | |
| Anjaneya Alloys | JH | Jamtada | Ferro Alloys | 41850 |
| Chandrapur Ferro Alloys | MH | Chandrapur | FM | 50000 |
| Chandrapur Ferro Alloys | MH | Chandrapur | SM | 32765 |
| Maithan Alloys | MEG | Rio bhoi | FM | 28000 |
| Tata steel | ORI | Joda | FM | 50000 |
| Nava Bharat Ventures | TEL | Khammam | FM-SM | 125000 |
| Maithan Alloys | WB | WB | FM | 94600 |
| Shyam Ferro Alloys | WB | WB | SM | 104957 |
| Indian Metals & Ferro Alloys Ltd | ORI | Rayagada | Ferro Chrome | 275000 |
A financial comparison with some of players reveal that Maithan has best financial numbers:
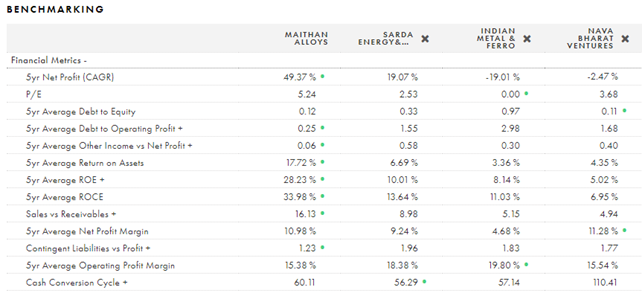
Further, doing a one on one comparison with IMFA highlights the following for better financials:
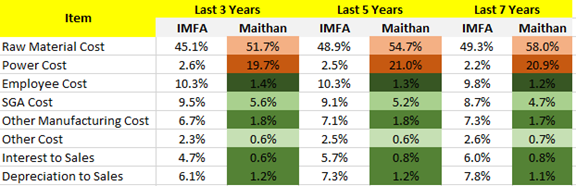
• 19% production share for ferro manganese and 33% production share for silico manganese, thus, building significant scale in 2 specific alloy categories
• Lowest cost produces due to higher efficiencies in employee productivity, SGA efficiency, other cost control, strong balance sheet and asset light model
• Company balance sheet does not hold assets like mines which looks like competitors are holding and hence associated man power etc.
Corporate Governance:
Company and promoters have been in question due to multiple factors and market perception arising out of:
- High cash holding
- BMA Advisors name is brokerage frauds which was led from extended family members
- CSR expenses from BMA foundation
One needs to again deep dive into company shareholding structure, subsidiary structure family relationships and related party transactions:
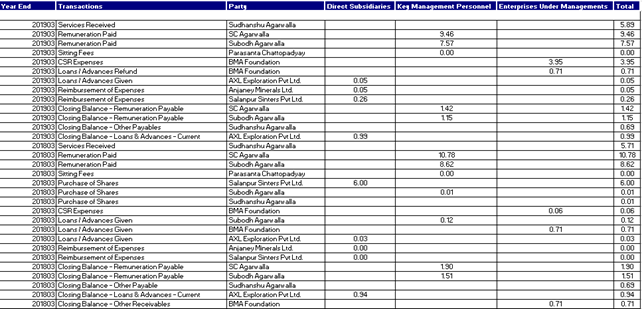

Key points to note:
- Major shareholding transfer between agarwalla family in 2017-18 where Mr S C Agarwalla and his son took complete ownership of company as promoter, board and management
- Other family members with association with BMW wealth advisors continue to hold shares in company, however, stake has been decreasing over time
- None of BMA wealth advisor family holds management or board position in the company
- One of family members who is in marketing position in BMA wealth is in top 10 shareholding list, however, not in management or board
- Related party transactions look clean with an exception of CSR to BMA foundation. However, it is not clear who owns BMA foundation – SC Agarwalla family or his brother who have been charged in brokerage fraud cases
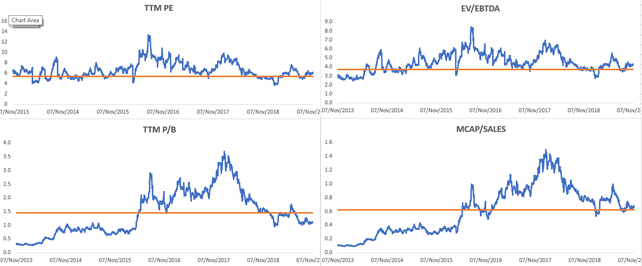
Valuations and Margin of safety
This analysis was done when company’s price was trading around last month and hence please factor in current price while analyzing. Let us analyze if current valuation is attractive or not based on multiple ways to value the company. First and foremost, let us look at historical valuations during bull and bear time and on multiple dimensions like book value, price to sales etc., specially, considering this is a cyclic business.
Historical valuations: Looks like current valuation is not the best of valuation yet but still on the attractive side. However, it should be noted that company has stronger balance sheet, cash flow and evident track record of management execution
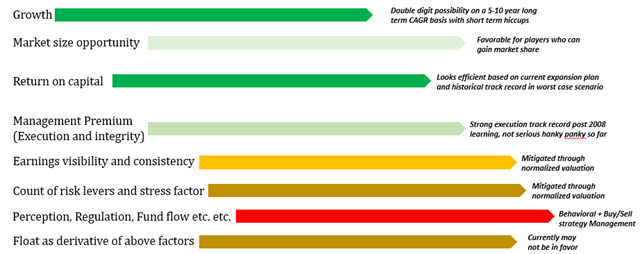
Another attempt at valuation: Going back to initial dilemma that should I value this company as a quality business or should I value it as a cyclic business made me think hard that why some businesses are valued this way vs that way. This further led to some more brainstorming on what drives valuation and where Maithan alloys stand on that framework. Briefly, based on experience, literature and discussions with colleagues and investment fraternity, following are the key pillars I have arrived which plays in the role of valuation both from short term as well long-term perspective:
• Growth and market size opportunity
• Return on capital
• Management Premium for execution and integrity
• Earnings visibility and consistency
• Count of risk levers and stress factor
• Perception, Regulation, Fund flow etc. etc.
• Float as derivative of above factors
Now, let us evaluate how company fairs on each of these parameters:
Growth – How did it happen and how it could happen: Historically, company has done overall 24% CAGR topline growth for 12 years out of which 15% came from expansion in production capacity and 7.7% came from pricing. Expense growth rate was same as revenue rate and hence operating profit also grew at similar growth rate. Though raw material cost growth rate was higher, it was compensated by controlled other expense items. So, 1x growth is by pricing and 2x growth is by expansion compared to industry growth rate of x
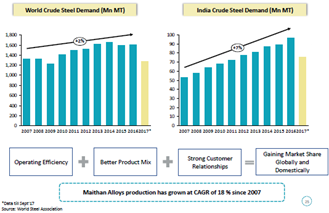
Even though company has shown very attractive growth, it is important to analyze how company has growth with respect to industry and also what is future growth size opportunity. Below are some estimates related to this:
| Item | India | APJ except China | Maithan Share |
|---|---|---|---|
| Ferro Manganese + Silico Manganese | 2.5 million ton | 10% | |
| Ferro Chrome | 1 million ton | 0% | |
| Total | 3.5 million tonn |
Concall* ( Industry utilizable capacity for Ferro manganese and Silico manganese: ~ 2.5 million ton
Maithan Share: 10% ( For the year FY19 our production was 2.25 lakh ton, nearly at full capacity and similar as last year)
![]()
Earlier, company has grown 3x of industry combining volume expansion and price hike. Based on all of this, one can make his own conservative estimate of future growth and how it would come through expansion and pricing. However, for growth
Sustainable Margins: In the financial analysis, we have seen that margins are cyclic and volatile due to raw material and power cost fluctuation as well as volatility in product pricing and hence, it is important to analyze what is sustainable margin. Below is analysis of sustainable raw material and power cost margin which ultimately provides some guestimate into sustainable EBIT margin
![]()
Based on this, 11% looks like reasonable EBIT margin with some kind of non-linearity considering company’s balance sheet and scale has improved historically.
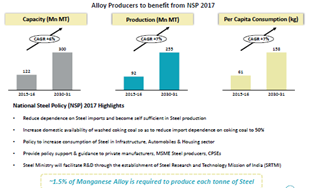
Future Return on Capital Employed: Proposed greenfield expansion and relative guidance provides some clues on ROCE for future expansion
- New Greenfield capacity: 120000 Ton per annum (50% of current capacity to be funded through internal accrual)
- Project Cost: Rs 275 Crore
- Current Rates for product: Rs 60K -61K per ton post correction in last 2 years (post 15-20% correction from peak) with 5-10-year price CAGR around 7-8% and hence looks sustainable
- Revenue possibility: Rs 720 Cr
- EBIT at normalized margins of 11%: Rs 80 Crore
- Return on Investment: 29%
Combining all of this, this is how overall valuation pillars look like:
If combining all this, we dare to do a DCF given company has maintained statement 1 type business model though it belongs to statement 2 type industry, this is how it looks like on price of Rs 459 a month back
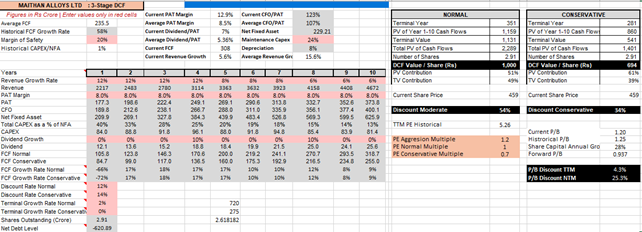
Thus, company looks 25% to 54% undervalued based on pure free cashflows. However, this should be taken with pinch of salt as it belongs to typical cyclic investment which is usually not a buy and hold investment. Another good thing is competitors are already showing losses from last 2 quarters which is early sign of sector forming business bottom (price bottom and business bottom may not be a linear relationship). Also, till FY21, we may not have any real triggers unless management comes with a pleasing news on utilization of cash
Valuation is an ever-changing perception. One who can patiently play b/w fear of pessimists and greed of optimists with reasonable timing and risk reward scenario makes successful investment. Currently, company has been in negative cyclic behavior, doubts on corporate governance due to frauds in businesses related to extended family.