Leap India Ltd
IPO Price Band: ₹151–₹159 | Listing: August 14, 2026
Business Description — “Movers Monopoly”
Leap India is India’s only national-scale asset pooling company, a business model that is fundamentally different from logistics, manufacturing, or SaaS, and needs to be understood on its own terms before any valuation discussion.
The asset pooling model in plain English: Companies like Hindustan Unilever, Marico, Coca-Cola, Mahindra, and Amazon need to move goods through supply chains. They need pallets (flat boards that hold goods on forklifts), containers (reusable plastic boxes), and material handling equipment (forklifts, hand trucks). The traditional model: each company buys its own pallets, stores them, repairs them, tracks them, and often loses them.
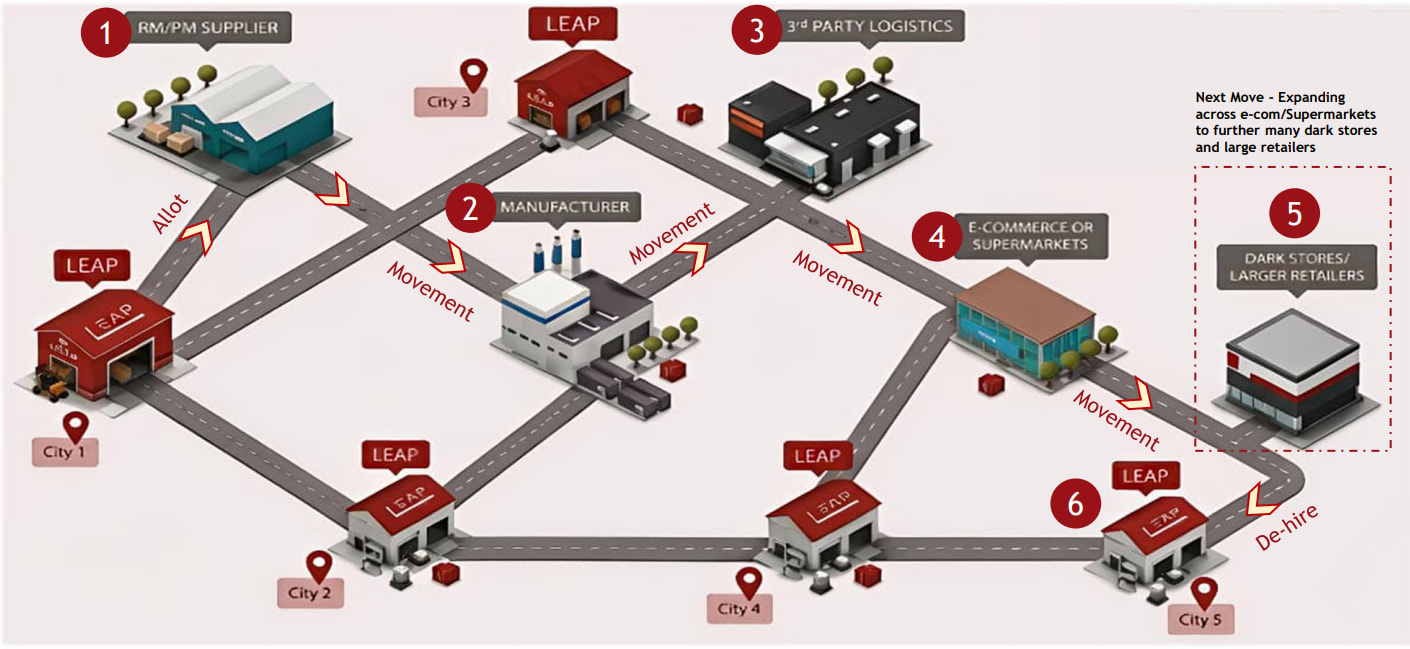
LEAP India rents these assets on a pay-per-use basis; clients convert capital expenditure into variable operating expenses. LEAP owns the assets, manages the network, repairs damage, and tracks location across 10,100 touchpoints.
The founder’s LinkedIn bio sums up the best: “LEAP India’s services allow customers to focus on their core businesses and multiply the returns on their CAPEX. We take care of all the activities of the supply chain that should be OPEX driven. Better the supply chain network, better the cycle time.
LEAP’s efforts are focused on supporting its customers, right where they are. Our competence lies in the management of assets and inventory and we solve logistics challenges with smart solutions. We provide end to end solutions to our clientele for the movement of products. By defining a high standard of products and services, we streamline nation-wide operational tasks for our customers.“
Scale: 14.7 million pooled assets. 10,100 touchpoints nationwide. India’s largest on-demand asset pooling provider by number of pooled assets and the ONLY player currently operating at considerable national scale.
Customer base: 1,000+ customers including Hindustan Coca-Cola Beverages, Marico, Toll (India) Logistics. Top 100 customer churn: 0.00% in FY26, down from 0.75% in FY24. Zero churn among top 100 customers is genuinely extraordinary it reflects both switching cost moats and the sticky nature of supply chain partnerships.
KKR backing: KKR acquired a majority stake in 2023 as part of its Asia infrastructure strategy. KKR’s infrastructure thesis is significant; they view LEAP as infrastructure, not logistics. Infrastructure assets typically command EV/EBITDA multiples of 15–25x and are valued on yield, not P/E. This framing matters enormously for how the stock should be valued.
Key acquisition: CHEP India was acquired in January 2025. CHEP was the second-largest pallet pooling player globally operating in India. Post-acquisition, LEAP is not just the largest in India it is essentially the only scaled player. This is a legal near-monopoly in a niche critical infrastructure category.
IPO Mechanics
| Parameter | Detail |
|---|---|
| Issue Size | ₹2,480 Cr total |
| Fresh Issue | ₹480 Cr (19.4% of issue) |
| OFS | ₹2,000 Cr (80.6% of issue) |
| Post-IPO Market Cap | ₹7,004 Cr (at ₹159) |
| Final Subscription | 8.82x overall (QIB 17.73x, NII 13.31x, Retail 1.81x) |
| Promoters | Sunu Mathew (Founder/CMD) + Vertical Holdings II Pte. (KKR vehicle) |
The OFS Concern- Critical Red Flag:
Only 19% of proceeds go to the company. This is primarily a route for KKR’s vehicle to monetise, not a capital-raising event.
Of the ₹2,480 Cr raised: ₹2,000 Cr goes to KKR and existing shareholders. Only ₹480 Cr goes into Leap India. And of that ₹480 Cr fresh issue: ₹360 Cr is earmarked for debt repayment, rest for general corporate purposes. The company is raising ₹120 Cr of net growth capital from a ₹2,480 Cr IPO. This is almost entirely a PE exit event, not a business funding event.
This doesn’t make Leap India a bad business, but it means you are buying at the price KKR needs to exit profitably, not at the price the business fundamentally deserves.
Financial Snapshot: Last 3 Year Story
| Metric | FY24 | FY25 | FY26 | CAGR |
|---|---|---|---|---|
| Revenue from Operations (₹ Cr) | 365 | 466 | 730 | 41.3% |
| Total Income (₹ Cr) | 372 | 485 | 747 | 41.8% |
| Revenue Growth YoY | — | +27.7% | +56.8% | Accelerating |
| EBITDA (₹ Cr) | 180 | 263 | 379 | 45% |
| EBITDA Margin | 49% | 56.4% | 50.7% | Peak then compressed |
| PAT (₹ Cr) | 37.56 | 37.56* | 62.34 | 29.5% CAGR |
| PAT Margin | 10% | 7.7% | 8.5% | Thin |
| ROE | — | 4.09% | 6.48% | Very low |
| ROCE | — | 18.01% | 19.06% | Healthy |
| D/E | — | — | 1.01x | Moderate |
| Total Borrowings (₹ Cr) | 513 | 802 | 1,018 | Rising every year |
*FY25 PAT identical to FY24 at ₹37.56 Cr despite 27.7% revenue growth; this is the CHEP acquisition integration year, where costs surged before revenue synergies arrived.
EBITDA vs PAT Gap: The Most Important Analytical Distinction
This is the central analytical question for Leap India and requires careful unpacking.
EBITDA margin of 50.7% is among the highest seen in asset-pooling and logistics services businesses.
But PAT margin is only 8.5% on ₹730 Cr revenue = ₹62 Cr PAT.
How does 50.7% EBITDA become 8.5% PAT?
| Line Item | Amount (₹ Cr est.) | Comment |
|---|---|---|
| Revenue | 730 | |
| EBITDA | 379 | 50.7% margin |
| Depreciation | 200 Cr est. | Asset-heavy; pallets depreciate over 5–7 years |
| EBIT | 179 Cr | 24.5% EBIT margin |
| Finance Costs | 90 Cr est. | On ₹1,018 Cr borrowings at ~8.5% average |
| PBT | 89 Cr | |
| Tax (30%) | 27 Cr | |
| PAT | 62 Cr | 8.5% PAT margin |
The massive depreciation (estimated ₹200 Cr on ₹1,500+ Cr of physical asset base) and rising interest costs (on ₹1,018 Cr borrowings) consume most of the EBITDA before it reaches shareholders. This is the fundamental nature of an asset-rental/infrastructure business: high operating margins, low PAT margins, capital-intensive.
ROCE vs ROE divergence:
-
ROCE: 19.06% - healthy. The deployed capital is generating good returns.
-
ROE: 6.48% - very low. Equity holders are getting poor returns because leverage amplification hasn’t yet overcome the depreciation and interest burden.
As debt reduces (₹360 Cr from IPO proceeds), interest costs fall → PBT and PAT expand. This is the investment thesis: buy now when ROE is 6.5%, hold as debt reduces and ROE scales toward 12–15%.
Key observations:
Revenue acceleration is real: FY25 grew 27.7%, FY26 grew 56.8%. The CHEP India acquisition added scale that is now converting to revenue. Automotive grew from 10% to 24% of revenue mix, diversifying away from F&B concentration. Revenue per asset recovered in FY26 after dipping in FY25; the integration efficiency is playing out.
EBITDA margin compression: EBITDA margin fell from 56% in FY25 to 51% in FY26 because depreciation and finance costs both rose faster than revenue on a larger, more leveraged asset base following the acquisition. The 570 bps margin compression in one year is notable. It’s structural (more assets = more depreciation), not operational, but it limits PAT growth.
PAT CAGR of 29.5% vs Revenue CAGR of 41.8%: PAT is growing slower than revenue the inverse of the operating leverage you want to see. This is the asset-heavy model’s fundamental constraint: every additional ₹1 of revenue requires physical asset investment (pallets at ₹300–500/unit, forklifts at ₹3–8 lakh each), which adds depreciation and debt, which suppresses PAT growth relative to topline.
Debt: Borrowings climbed every year: ₹513 Cr (FY24) → ₹802 Cr (FY25) → ₹1,018 Cr (FY26); rising alongside assets. ₹360 Cr of IPO proceeds repaying debt still leaves ₹658 Cr of net debt. Net Debt/EBITDA = ₹658 Cr / ₹379 Cr = 1.7x post-IPO, manageable but not light for an asset-rental business.
Working Capital Quality: STRUCTURALLY SOUND
The asset pooling model is inherently WC-light. Customers pay per-use fees (subscription + per-trip charges). Revenue recognition is service-based. No inventory accumulation (the pallets ARE the inventory and are tracked as assets). Customer churn among top 100 fell to 0.00% in FY26 the stickiest customer base imaginable.
The WC risk is physical asset attrition; pallets get lost, damaged, or stolen at scale. Physical assets circulating across thousands of touchpoints get lost, damaged, or poorly tracked. Replacement cost flows straight to the P&L. This is a structural cost that is unique to LEAP’s business model and must be tracked as a percentage of revenue.
Business Moat - Genuinely Exceptional, but also Narrow
POSITIVES:
1. Network Economics: The CHEP Model. Pallet pooling works only when the network is national. A pallet shipped from Mumbai needs to be retrievable in Kolkata. 10,100 touchpoints nationwide took LEAP 11 years to build. A new entrant would need 5–7 years and ₹2,000+ Cr of capex to replicate and would still face the chicken-and-egg problem (customers won’t join a small network; the network needs customers to grow).
2. Zero Customer Churn. When a supply chain company integrates pallet pooling into its logistics operations, swapping providers means re-tagging every asset, retraining every warehouse team, and renegotiating every OEM-logistics contract. The switching cost is prohibitive.
3. Acquisition of CHEP India = Eliminated Only Credible Competitor. CHEP was the second-largest pallet pooling player in India. India now has one scaled national pallet pooling company. This is a legally acquired near-monopoly.
4. ESG / Sustainability Tailwind. Maybe not a tailwind per say. Every pallet pooled = one less pallet bought, used once, and discarded. KKR’s infrastructure thesis explicitly includes LEAP’s role in reducing supply chain carbon footprint.
NARROW in some dimensions:
-
Wood pallet pooling is the core (62% of revenue) but pallets are a commodity. Competition from unorganised players (small regional pallet renters) on price is persistent in Tier 2/3 markets.
-
Top 10 suppliers and service providers make up 63.27% of total purchases, creating supplier concentration risk.
-
International players (CHEP globally, iGPS, TOSCA) could theoretically re-enter India if margins prove attractive enough.
Unit Economics
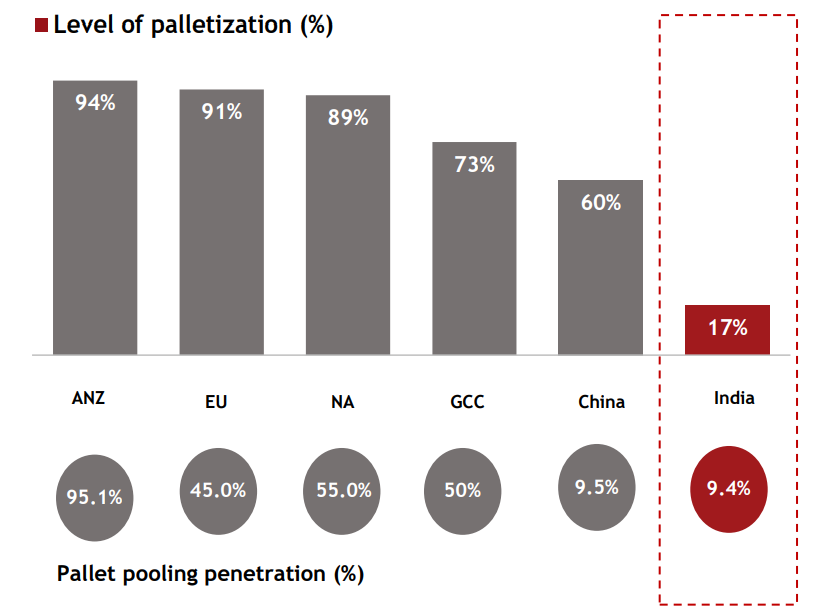
Pooled pallets made up 9.4% of India’s total pallet stock in FY26. LEAP controls roughly 90% of India’s pallet pooling market by fleet size, with 14.70 million pooled assets and 29 fulfilment centres.
Revenue per asset:
Revenue from operations FY26: ₹730 Cr. Total assets: 14.70 million units.
₹730 Cr ÷ 14.70 million assets = ₹497 revenue per asset per year = ₹41 per asset per month.
That is the blended number. The mix matters:
- Pallets (60% of revenue, approximately 10–11 million units): ~₹45–50/unit/month.
- Containers (foldable plastic, approximately 2–3 million units): ~₹60–80/unit/month (higher value, smaller volumes).
- MHE/Forklifts (TARON, approximately 1 million units): ₹500–2,000+/unit/month (forklifts are high-ticket rentals).
Cost per asset (I could be wrong):
A standard 1,100mm × 1,100mm wooden pallet in India costs approximately ₹300–450 new. LEAP’s total asset base of 14.70 million units includes varying grades.
Assuming a blended asset cost of ₹450 per pallet-equivalent, total asset replacement value = ₹6,615 Cr. This compares to LEAP’s total assets on the balance sheet of ₹2,401 Cr, reflecting depreciated book value after 5–7 years of accumulated depreciation.
Revenue yield on assets (gross): ₹730 Cr ÷ ₹2,401 Cr (book value) = 30.4% gross revenue yield on book value.
EBITDA yield on assets: ₹379 Cr ÷ ₹2,401 Cr = 15.8% EBITDA yield on book value.
Compare to Brambles globally: Brambles’ 348 million pallets generated 2024 group revenue of US$5.6 billion (approx. ₹46,900 Cr) = ₹135 revenue per asset per year = ₹11/unit/month. Brambles operates in high-cost developed markets (Europe, USA, Australia) where pallet rental is a mature, commoditised product with lower per-unit pricing but much higher volumes
LEAP India earns ₹41/unit/month vs Brambles’ ₹11/unit/month, nearly 4x per unit. Why? India is early-stage adoption where pooling creates genuine capex replacement for customers, justifying a premium. As India matures toward developed-market adoption rates, this premium will compress a 5-10 year normalisation risk.
CHEP globally loses approximately 1 million pallets every year. At LEAP’s blended asset cost of ₹450/unit, 1% annual loss on 14.70 million assets = 147,000 pallets = ₹66 Cr annual replacement cost. This flows directly to the P&L as cost of goods/maintenance. At 30% revenue yield, the attrition cost consumes approximately 9% of revenue; a structural, unavoidable cost of the business model that does not show up in the headline EBITDA margin because it is buried in depreciation and asset replacement.
Valuation Assessment
P/E: 111.97x. P/B: 6.48x. RONW: 6.19%. Market cap post-issue: ₹7,004 Cr.
At 112x P/E with 6.5% ROE, it’s absurdly expensive by any conventional equity metric. The correct valuation framework for LEAP is EV/EBITDA, not P/E:
| Metric | Value | Comment |
|---|---|---|
| Post-IPO Market Cap | ₹7,004 Cr | At ₹159 upper band |
| Less: IPO proceeds to company (net) | -₹120 Cr (net of debt repayment) | Growth capital received |
| Net Debt post-IPO | ₹658 Cr | ₹1,018 Cr – ₹360 Cr repaid |
| Enterprise Value | ₹7,662 Cr | Mkt Cap + Net Debt |
| FY26 EBITDA | ₹379 Cr | 50.7% margin |
| EV/EBITDA (FY26) | 20.2x | Infrastructure comparable |
| FY27E EBITDA (~30% growth) | ₹490 Cr | |
| EV/EBITDA (FY27E) | ~15.6x | Very reasonable for infra |
Global comparable: CHEP’s parent, Brambles Ltd (ASX: BXB), the world’s largest pallet pooling company trades at 15–18x EV/EBITDA on ASX. LEAP India at 15.6x FY27E EV/EBITDA is IN LINE with global CHEP multiples. This is the institutional logic for the 17.73x QIB subscription; institutions are valuing LEAP as infrastructure, not as a logistics or FMCG company.
The P/E problem: At 112x P/E, no traditional equity fund can justify ownership. But at 15.6x EV/EBITDA with 50%+ EBITDA margins and zero top-customer churn, every infrastructure fund globally would find this attractively priced.
Institutions are buying for the long term, not to flip. The 17.73x QIB subscription reflects 12–24-month holders pricing in:
Bull Case | 3 Catalysts
1. Palletisation Penetration Expands From 15% → 40% Over 5 Years. India’s palletisation rate is well below developed markets (USA 80%+, Australia 60%+). LEAP is the only scaled provider. TAM expansion flows entirely to LEAP with no competitive erosion. A 3x palletisation penetration rate = 3x LEAP revenue with similar fixed cost base = PAT compounding at 40–50% for 5 years.
2. Debt Reduction → ROE Doubles → Re-rating. IPO proceeds repay ₹360 Cr debt → interest cost falls ₹30 Cr annually → PAT increases to ₹90–95 Cr in FY27E. ROE improves from 6.5% to 9–10%. Institutional equity funds that couldn’t own it at 6.5% ROE begin entering at 10%+. Multiple re-rates from 112x P/E toward 60–70x P/E on higher PAT. Price target: ₹220–240 within 18–24 months if execution confirms.
3. Adjacent Asset Classes- Plastic Containers + Lithium MHE Scale. TARON (acquired) is the second-largest forklift pooling player in India, the leader in lithium-ion MHE. Electric forklift leasing is growing at 25–30% annually as warehouses electrify. Plastic foldable containers (RPCs) are growing faster than wooden pallets. As these adjacencies scale from 38% to 50%+ of revenue, revenue quality and EBITDA margins improve.
Bear Case | 3 Risks
1. 80% OFS = KKR Is Selling For A Reason. The most important question any IPO investor should ask: why is the primary selling party (KKR) choosing to exit now? KKR acquired in 2023 at what was presumably a lower valuation, made the CHEP India acquisition (January 2025), scaled revenue 56% in FY26, and is now selling 80% of the IPO at a point where ROE is 6.5% and PAT is only ₹62 Cr. Only 19% of proceeds reach the company. KKR is an excellent capital allocator; if they’re selling now at 112x P/E, they believe they’ve extracted most of the near-term value. This is the most intellectually honest bear case.
2. P/E Multiple Compression On Disappointment Has No Floor. At 112x P/E with 6.5% ROE, there is no mathematical floor from a traditional equity valuation standpoint. If FY27 PAT comes in at ₹75 Cr (vs expected ₹90+ Cr) because debt reduction was slower than planned or CHEP integration costs exceeded expectations, the stock de-rates from 112x to 70–80x on lower earnings = ₹120–130 per share 20–25% below IPO price.
3. Business Model Risk: Asset Attrition At Scale. LEAP now manages 14.7 million physical assets across 10,100 touchpoints in India. Pallets in a chai factory in Coimbatore get damaged differently from pallets in an automotive plant in Pune. As the network scales, physical asset losses, damage, and poor tracking flow directly to the P&L as replacement costs. At 14.7 million assets, even a 2% annual attrition rate = 294,000 pallets to replace at ₹400 each = ₹11.8 Cr additional cost annually. This scales with revenue but is not fully visible in the EBITDA number.
Management Pedigree
Sunu Mathew previously worked at CHEP as a Director, FMCG. He is the Founder, Chairman, Managing Director and CEO of LEAP India. He has been awarded as the Sustainability Professional of the Year.
This is the most underappreciated fact about LEAP India’s founding. Sunu Mathew did not stumble into pallet pooling; he ran FMCG sales at CHEP India before founding LEAP in 2013. He knows the CHEP model from the inside: its strengths, its customer relationships, its pricing mechanics, and its operational failures. When LEAP eventually acquired CHEP India in 2025, Sunu was essentially buying the company he used to work for at a point where KKR’s backing gave him the financial firepower to do so.
Disclaimer: Used AI to streamline content. Not SEBI registered. The above is just for information.
Position: On watchlist