YoY Growth (%) = [(Q4 FY25 Value – Q4 FY24 Value) / Q4 FY24 Value] × 100
For KRN’s Q4 FY25 Revenue:
You provided:
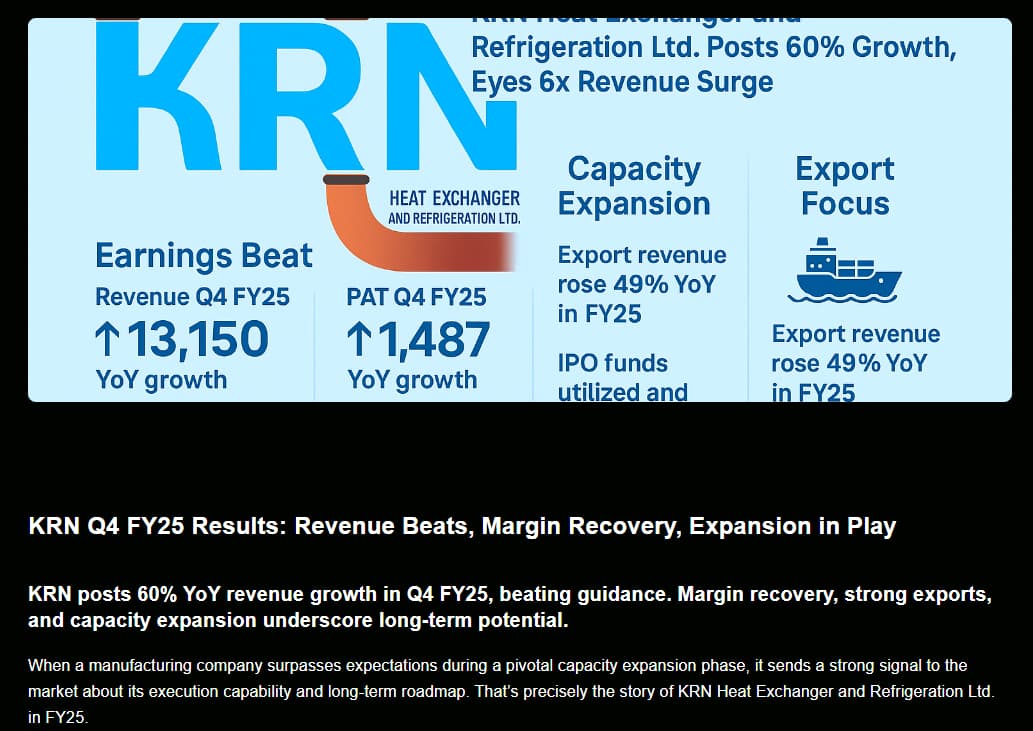
Q4 FY25 Revenue from Operations = ₹13,150.24 lakhs
Q4 FY24 Revenue from Operations = ₹8,201.57 lakhs (implied from reverse calculation)
YoY Growth (%) = [(Q4 FY25 Value – Q4 FY24 Value) / Q4 FY24 Value] × 100
For KRN’s Q4 FY25 Revenue:
You provided:
Q4 FY25 Revenue from Operations = ₹13,150.24 lakhs
Q4 FY24 Revenue from Operations = ₹8,201.57 lakhs (implied from reverse calculation)
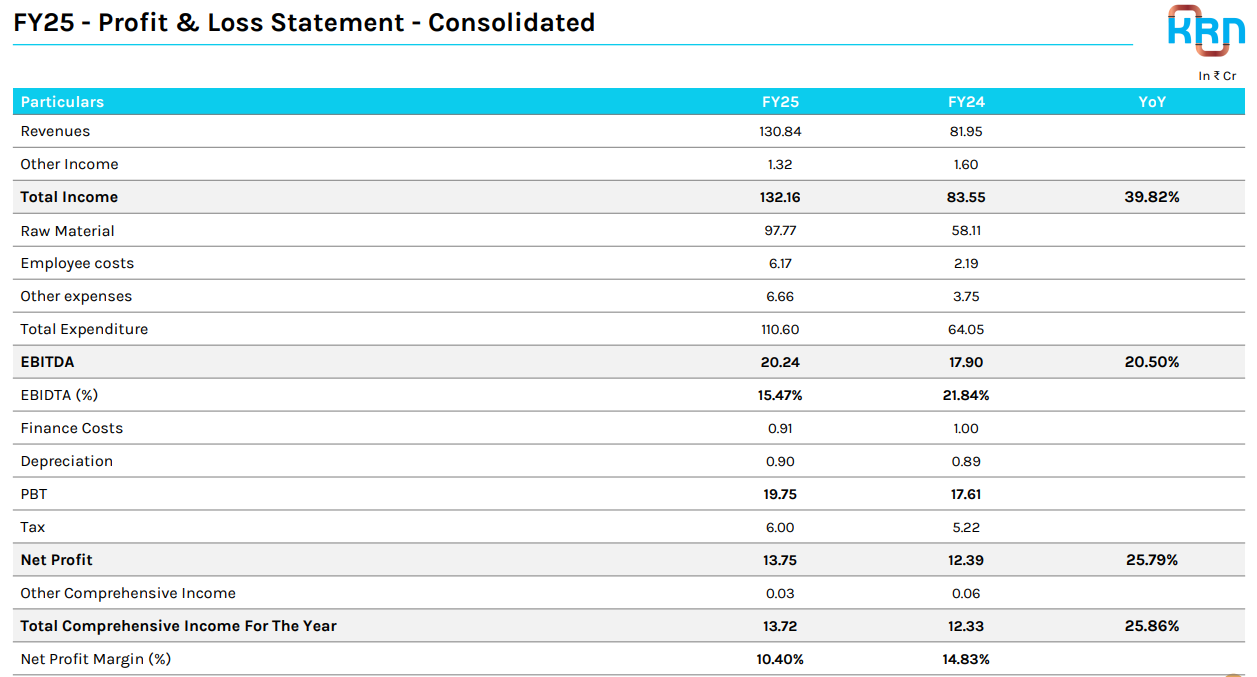
YoY Growth (FY)
= [(FY25 Value – FY24 Value) / FY24 Value] × 100
Thanks
I am invested in Krn
I don’t see negative cash flow
You are possibly looking at the large amount shown as investment but that was the reason for the capital raise.
If you look at cash flow prior to it, I don’t see a issue
If they raise another cash for another plant without fully utilising the current one and without generating profit, then I would be very suspicious
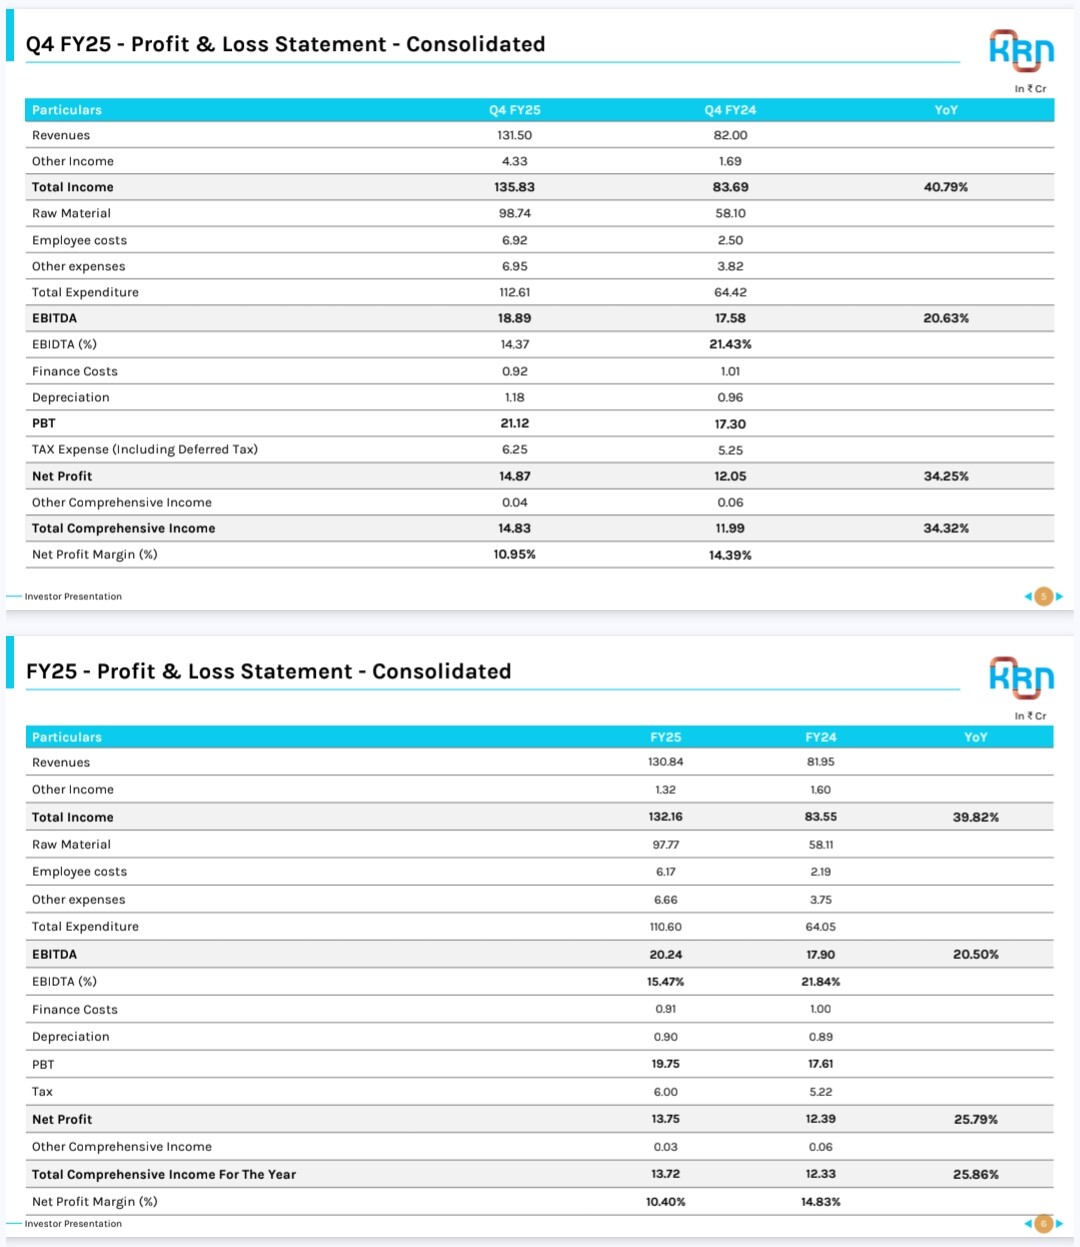
@Vikas2412 ..Vikas ji pls check their presentation >https://www.bseindia.com/xml-data/corpfiling/AttachLive/243421f3-f86f-4685-a870-3cbbc50bc1c1.pdf
YoY topline growth 40%, the auto analysis has different figures.
Why i keep coming back to auto analysis part is, when such so called AI’s dont fetch the correct figures it might be time consuming to gather correct picture unless one is a blind follower of such auto presentations.
The auto analysis is on point , I think there is some misunderstanding from your end.
There are basically two YoY growth figures.
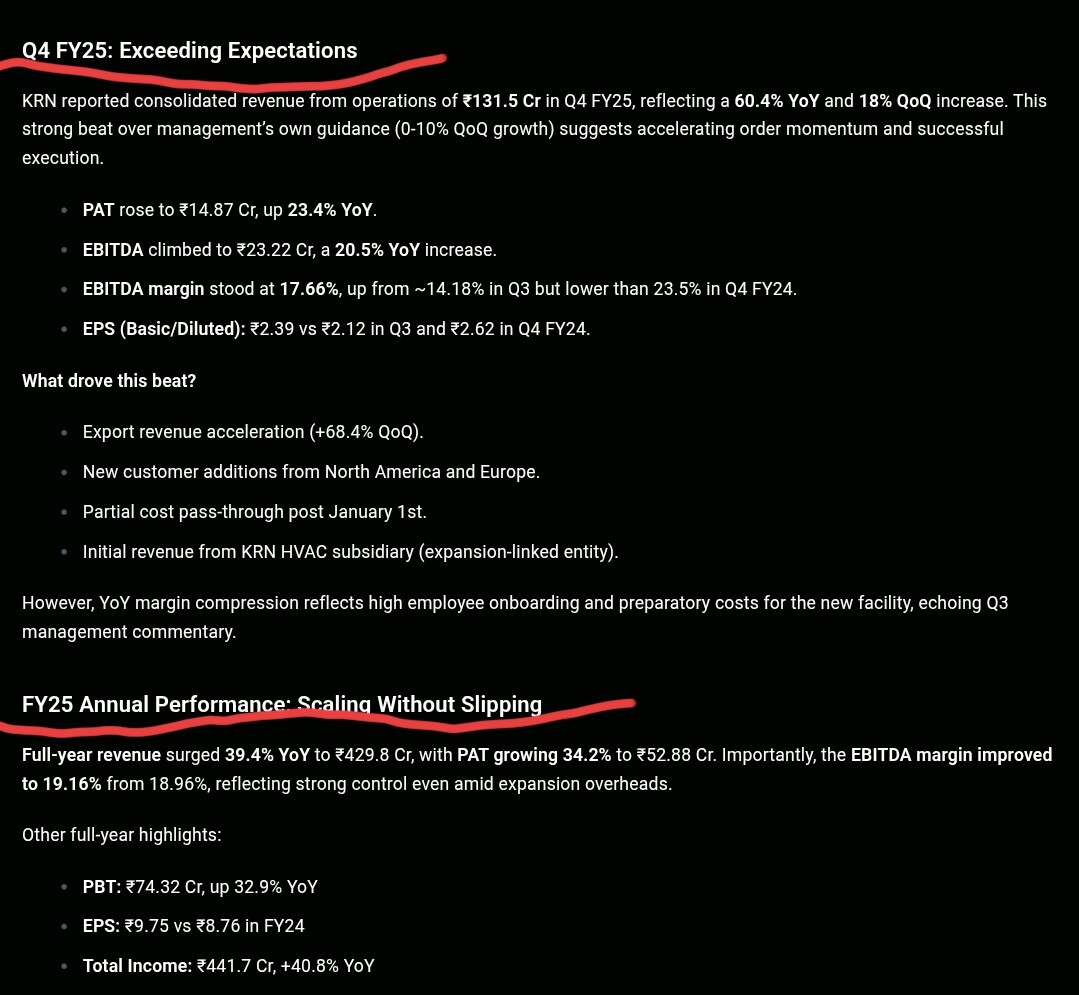
One is for growth in Q4 which is 60.4% and other is for whole financial year that is 39.4% .
To be honest, they have not presented their own data in the correct form in IP.
It’s always good to look at audited financial statement for numbers ![]()
@Vikas2412 Thank you for clarification..I am still learning around here…my intention was to understand results…so YoY its 40%.
Yes, so there are two parts.
YoY for quarter (Q4) is 60% and for full year(FY 25) it’s 40%.
How is the company making mistake in such simple calculation? Maybe it is time for AI to definitely replace them xD As a rule always look at audited results first and then promotional material like investor presentation as they’re unaudited
Q2FY26 Can someone care to explain, how their latest consolidated figures are less than their standalone numbers ?
@Surender that Explains & makes sense. Even trade receivables for Standalone increased 179 % (by ~118 Cr) & trade payables for consolidated increased 182%
Management’s commentary summary on Standalone vs. Consolidated Financials Discrepancy:
The standalone revenue (227.22 crore) was significantly higher than the consolidated revenue (154.46 crore).
Management explained this was due to a large inter-company sale of raw materials from the parent entity (KRN Heat Exchanger) to its new subsidiary. This was necessary because the new subsidiary’s vendor codes with international raw material suppliers were not yet established. The subsidiary has not yet sold all the material it purchased from the parent, leading to the discrepancy after inter-company eliminations during consolidation. This is expected to normalize by the end of the year.
KRN Heat Exchangers Picking Up Heat: Rs. 1000 Cr MOU With Rajasthan Govt. and Capacity Expansion
Latest media interaction…multiple margin expansion levers.
Valuations @780 is at a PE of 80 (screener) which provides no comfort…languishing at these levels for almost 12 months. The market dosen’t seem to be wary of the high multiple.
Regulars here…pl share your thoughts on the valuations and possibilities
Disc - Not invested