
Makes sense now as the max milling capacity is (195MT per hour)(24 hr)(365 days) = 17 lac MT per year .So the company is operating at a third of its maximum production.I would say the real maximum prod is probably around 8-9 lac MT per year .So probably the company is near its limits and needs to construct milling capacities.

It has been consolidating for too long…Most of the companies after march fall are back to their highs or breaking those high. KRBL is stuck and if the markets fall again will be interesting to see if it holds the current floor.
1 Like
Buddy what are settings u ve taken?
This is what I am getting (I am a beginner in TA)
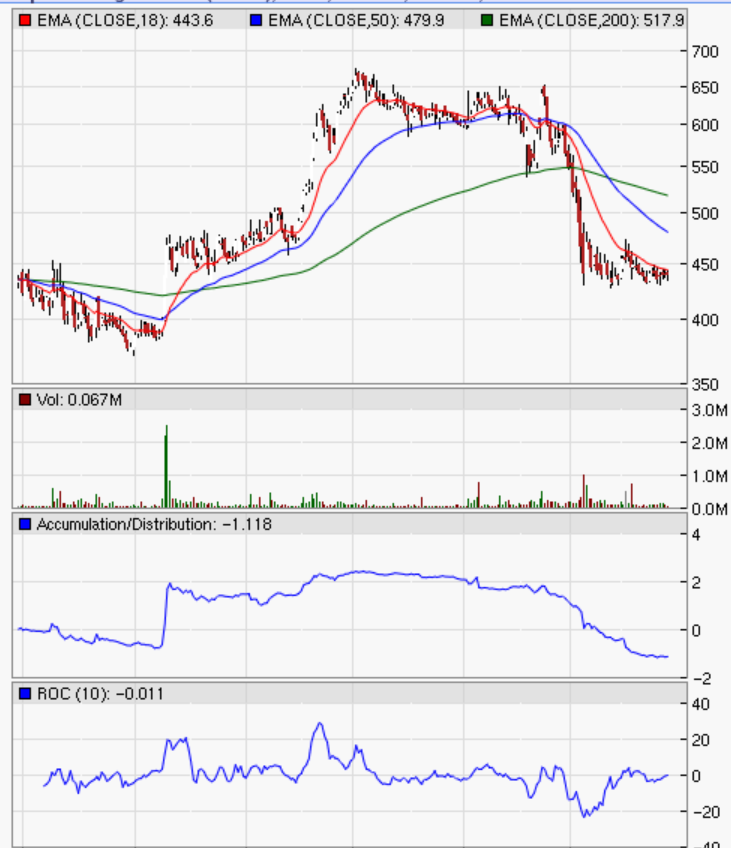
This is daily plot on 18,50 and 200 EMA with volume , A/D and ROC
The same at weekly level

Weekly looks interesting to me but need some volume activity else do not sense anything.
However, Jan’18 Basmati rice export was 38% up YoY. So, if fundamentally nothing looking bad and technically at least on weekly level 18 EMA kissing 50 EMA again and distribution and rate of change both seems to changing direction but not yet confirmed totally, probability is may be we will see interesting time . May be some more wait. May be till results lets see. Any idea of Feb and March export nos? That would confirm
1 Like
What I had posted was hourly chart. Hourly 200 EMA has dropped down and flattened and today it closed above 200 EMA (just after I posted the previous chart).
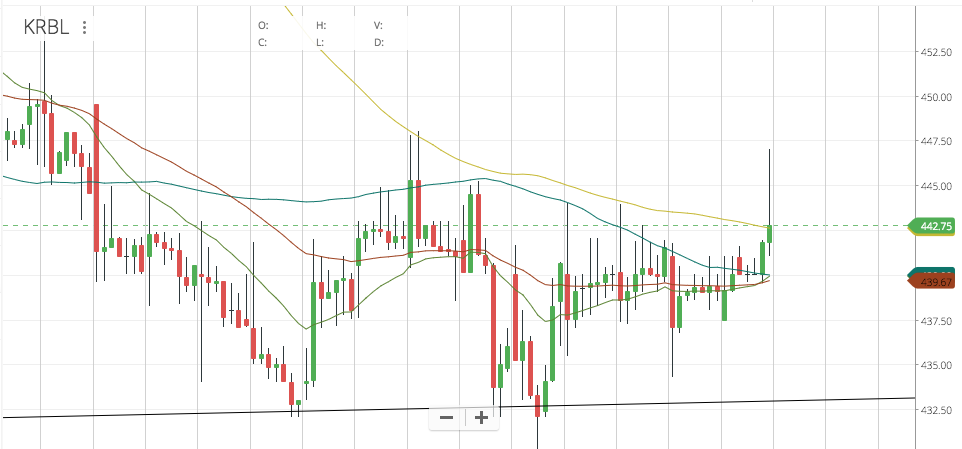
This is the first time it has closed above 200 EMA in hourly since 15th Feb. In smaller timeframes its already mildly bullish so this is important for direction of further moves. I think next week we could have something. Let’s see. No idea about Feb and Mar numbers. I see that non-basmati exports is at all time high and Pakistani basmati rice exports have risen by nearly 20% but nothing about Indian basmati rice exports for Feb/Mar.
2 Likes
Some updates on latest Basmati rice export numbers updated on my blog:
5 Likes
Thanks for digging the numbers @suru27. Its nice to see that exports to middle east has picked up. KRBL’s exports were flat last year but considering they have a strong market share in the middle east, this year they may show growth in exports. I am hoping they show growth in market share in domestic as well, which is the expanding market. KRBL’s FY18 balance sheet and AR should have lot of useful info when it comes out to see how the future is going to be. Let’s see.
I saw India Gate Basmati rice in Woolworths in Australia under specials. This is among the top two super market chain in Australia and this is the first time I am seeing India Gate in Woolworths.
2 Likes
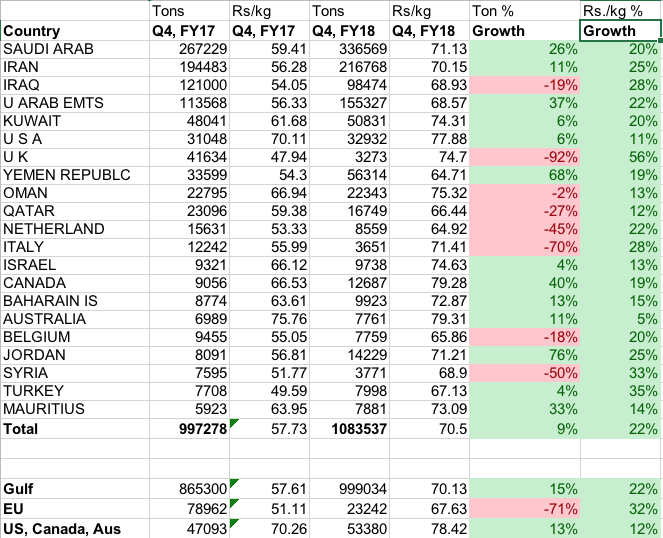
Here is a little simplified representation of @suru27’s numbers. I have ignored the tonnage and picked the top 20 odd countries that contribute to over 95% of the exports in rupee terms for simplicity.

Here are my inferences.
-
The overall export growth in Q4, FY18 vs Q4, FY17 is 33%. But more importantly, the growth in the Gulf countries is around 41%. This is KRBL territory.
-
Gulf countries contribute to over 90% of the overall basmati exports (7005 Cr vs 7639 Cr overall).
-
EU is showing significant de-growth but then looking at the Rs. value of such exports, its a miniscule amount of overall (< 5%)
-
US, Canada and Aus are growing at 27% - This has mostly been LT Foods territory. In Rupee terms, this growth is just about 87 Cr. Even if 50% of this is LT Foods’ share, it may not have a significant impact on its topline. To put it in perspective, LT Foods does a topline of about 900 Cr per quarter.
-
While the growth in gulf will benefit LT Foods as well, KRBL while having a superior market share, will also benefit better if they maintain their superior margins from the past.
The numbers seem to point to a very good Q4 for KRBL especially since export growth has been non-existent so far. If domestic doesn’t play spoilsport and if there are positive surprises there, the numbers may be even better.
9 Likes
A little more data to mull, this time to see growth in tonnage and in realisation. We already know there is good growth in overall export in rupee terms.
Observations
-
33% Growth in rupee terms hasn’t come solely via increase in tons exported. In Ton %, the overall growth is only 9%. For Gulf countries, it is 15%, EU has de-grown more radically in tons exported than in rupee terms and US/Can/Aus growth is at 13%
-
Avg. realisation per kg has increased from Rs.58 levels to Rs.71 levels which is fantastic 22% growth overall. For Gulf, this realisation is same 22% while for EU its a higher 32% and for US/Can/Aus its relatively lower at 12%. Maybe due to de-growth in tonnage in EU Zone, the exporters tried to compensate in realisation. Have US/Can/Aus realisations grown lower because of LT Foods’ lack of pricing power? Hard to tell but the realisation per kg was already high in Q4 FY17 for this zone.
-
Although all Gulf countries have shown growth in Rupee terms, Iraq has actually de-grown in terms of tons. Its only the fantastic growth in realisation (56%) which has kept things afloat. The de-growth could be due to the single one-time large order in Q4, FY17.
-
KRBL’s inventory was low cost so the growth in tons (15%) and realisation (22%) in the Gulf should definitely improve their margins even more. Won’t be surprised if OPM is north of 25% this quarter.
5 Likes
@phreakv6 True , actually major revenue growth comes from price shift due to cyclic nature. It plays out like typical cyclic . In bear cycle no one wants to produce rice and slowly demand high supply less, prices start increasing , slowly farmers notice n then more and more want to produce rice and slowly supply peaks n price crash. Volume change happens more due to regulatory issues (historical instances ) . Iraq’s low tonnage is I think result of import ban. Some of these countries ve history of doing this .
Any idea how KRBL does P&L accounting ? Let’s say if they purchased raw material in 2016 and selling finished product in 2018 created out of 2016 raw material which was lying in inventory ,do they shift that inventory to expense in 2018 P&L statement . Pardon me for my poor accounting knowledge , I understand that inventory is balance sheet concept ,however, I believe some kind of inventory adjustment is done once sales are realised though I do not understand it completely in accounting terms. If someone can shed more detail on accounting part, it would be great . Some links to understand the same
3 Likes
This is my understanding. There could be gaps. Inventory in the balance sheet could be raw material purchased and finished goods. This could be unmilled rice as well as rice left for ageing for KRBL (major part of inventory as ageing is part of the business model).
Inventory in the balance sheet is expensed in the P/L as ‘Cost of Materials consumed’ and as ‘Change in Inventory of Finished goods’ in the quarter where sale happens. Cost of materials could also be off-balance sheet as well for KRBL - For eg. Power, fuel, packaging etc. Change in inventory is negative when goods produced during the quarter didn’t contribute to the topline but went towards inventory and positive if finished goods from the inventory were sold in the quarter. For KRBL, finished goods seem to be hardly stored in inventory - so its mostly rice stored for ageing. Most of the inventory expensing happens via ‘Cost of materials consumed’.
You can see the same in this.
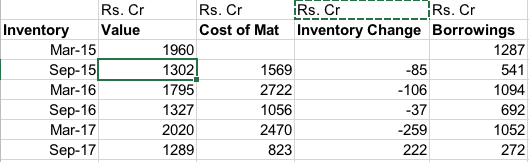
See how the inventory moves every 6 months. Please note that half-yearly numbers are for half-year (Mar-Sep) while March numbers are for whole year. Procurement season is in the second half of the year and the borrowings (mostly short-term, for WC) as well moves in a cycle in sync with the inventory. Inventory is definitely expensed via Cost of materials as the other expense line-items are too small in comparison to the topline.
Value of inventory I think is at cost for KRBL since value is usually either cost or realisable value - whichever is lower. So the 1289 Cr inventory KRBL holds in Sep-17 could have been built in FY17 procurement season and a relatively small part of it even earlier in FY16. Another thing to note is that not all product lines of KRBL are aged for 2 years - if I am not mistaken only India Gate Classic is, so that will also dictate what % of the inventory is held for what lengths.
10 Likes
Dear forum members,
I have gathered my thoughts on KRBL on my blog:
I have tried to touch upon all the aspects of analysis. Would be glad to hear your views.
Disclosure: Tracking, have invested an insignificant amount.
29 Likes
Great work Harish. It’s a well articulated piece. Specifically liked your analysis on the energy business.
Regards
SJ
1 Like
Great insights and article on the company. On your concerns of capital allocation to energy, haven’t the management clarified that this won’t be the focus for any future capital allocation? Instead any future capex will happen around either developing new products or scale existing operations? Please correct me if I am wrong.
Good work harish bhai …Can you share comarision between LT Foods and KRBL. Is LT Foods better in capital allocation than KRBL?
Looks like that big bad breakout I was waiting for has come. The volume is a bit misleading though as a bulk of it is not part of the price/action.

6 Likes
This could be reason for the spike. Should be trading activity. Even HCG up by 5%.
2 Likes
20 DMA kissed 50 DMA and flied and now with huge volumes which seems confirmation and we have fundamental export data to support. Cant get better than this. Hope this converts into good results  . Great, thanks for initiating the chart pattern discussion
3 Likes